Carter-Ruck, Britain’s most famous libel firm, threatened whistleblowers, journalists, regulators and even the police on behalf of OneCoin, a $4 billion crypto-fraud. The firm played a key role in helping the fraud to continue. Did Carter-Ruck cross the line, and commit a criminal offence?
UPDATE 15 December 2025: The Solicitors Disciplinary Tribunal has just dismissed charges against Carter-Ruck partner Claire Gill. It looks like Carter-Ruck will face no consequences for having helped one of the world’s largest financial frauds.
OneCoin’s founder is now on the FBI’s Ten Most Wanted list; the rest of its executives were jailed or went on the run. Yet at the height of the fraud, Carter-Ruck was, in its own words, working to “silence the critics and ultimately the police”
We and other free speech campaigners successfully applied to the Solicitors Disciplinary Tribunal for full copies of all of the internal Carter-Ruck’s files disclosed to the SDT. The documents suggest that Carter-Ruck never knew who really owned OneCoin, or who was paying its bills. They also reveal that the firm knew OneCoin faced detailed and credible fraud allegations, knew its founder, Ruja Ignatova, had a recent conviction for fraud, knew the police suspected it was a scam – and knew all of this was making it “very difficult” for OneCoin’s business to operate. So Carter-Ruck stepped in to protect OneCoin: taking down YouTube videos and sending legal threats to journalists, whistleblowers, regulators and the police.
Carter-Ruck’s work was not incidental. It was part of the machinery that kept the fraud alive. Ponzi frauds require that the fraudsters keep the trust of their victims – and Carter-Ruck helped maintain that trust. As partner Claire Gill put it in an email to her client: “The goal of legal action is to reassure members and to send a strong PR message”.
There’s nothing unusual or improper about lawyers acting for criminals. It’s fundamental to our justice system that lawyers defend people accused of crimes, even if they suspect their clients are guilty. What Carter-Ruck did was different: they actively helped criminals to continue their fraud. That’s why the Solicitors Disciplinary Tribunal ruled that Carter-Ruck was instructed in furtherance of a fraud.
Carter-Ruck have said – correctly – that their firm isn’t covered by anti–money-laundering regulations. But the Proceeds of Crime Act (POCA) applies to everyone – regulated or not – and makes it a criminal offence to help someone retain the proceeds of crime, or to receive money that comes from crime, if you suspect that’s what’s happening.
Carter-Ruck surely didn’t know they were facilitating a fraud – but they should have suspected it.
And if Carter-Ruck did suspect their actions were helping a fraud, that raises the real possibility that they committed these offences. If, on the other hand, Carter-Ruck genuinely didn’t suspect fraud, when so many other people did, that raises serious questions about their judgment and competence.
The Solicitors Regulation Authority is prosecuting the Carter-Ruck partner, Claire Gill, for an “improper threat of litigation“. We believe there is a more serious case to answer: that Carter-Ruck may have committed a criminal offence under POCA.
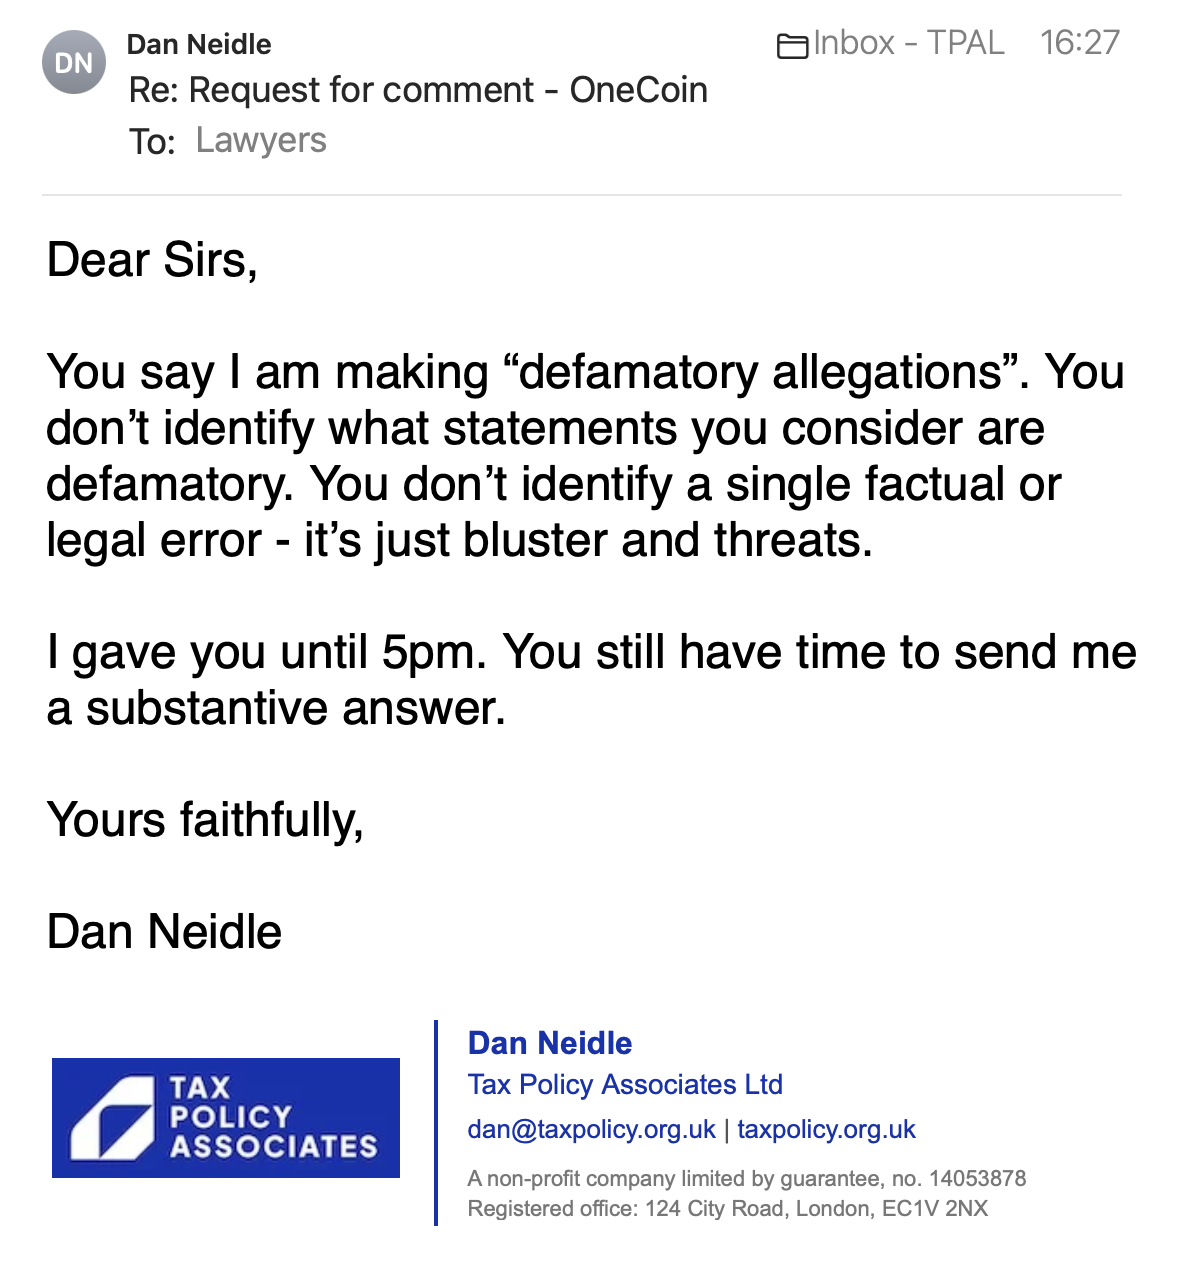
Carter-Ruck’s only response has been to threaten us with legal and professional consequences for reporting this story. They say we are making “baseless” and “seriously defamatory” accusations, and that we are “launching a wholesale attack on Ms Gill and this firm” based on a “highly selective, tendentious and indeed grossly distorted view of the materials”. They have not identified a single specific legal or factual error. We’ll update this report if they do.
Carter-Ruck’s client: OneCoin
OneCoin claimed to be a cryptocurrency like Bitcoin, but centralised. It wasn’t. There was no “blockchain” – OneCoin just made up prices, took investors’ money, and paid some out to other investors and kept the rest for themselves. There’s no such thing as a centralised cryptocurrency. It was a Ponzi fraud.
The whole thing collapsed in 2017, and its executives are all now either in jail or on the run. Around $4bn was stolen from millions of investors, across 125 countries. Carter-Ruck’s client, Ruja Ignatova, is one of the FBI’s ten most wanted fugitives, with a $5m reward for information leading to her arrest.
The BBC article, podcast and Jamie Bartlett’s book are probably the best sources for the history of OneCoin. Jen McAdam’s book is also excellent. There is an excellent analysis of Ponzi schemes and their history in The Ponzi Puzzle by Tamar Frankel.
After the Solicitors Disciplinary Tribunal (SDT) accepted the case against Carter-Ruck partner Claire Gill, we and a consortium of media and free speech organisations were able to obtain complete disclosure of the SDT documents. Those documents reveal the inside story of Carter-Ruck’s relationship with OneCoin, and form the basis of this report.
Carter-Ruck never knew who owned OneCoin
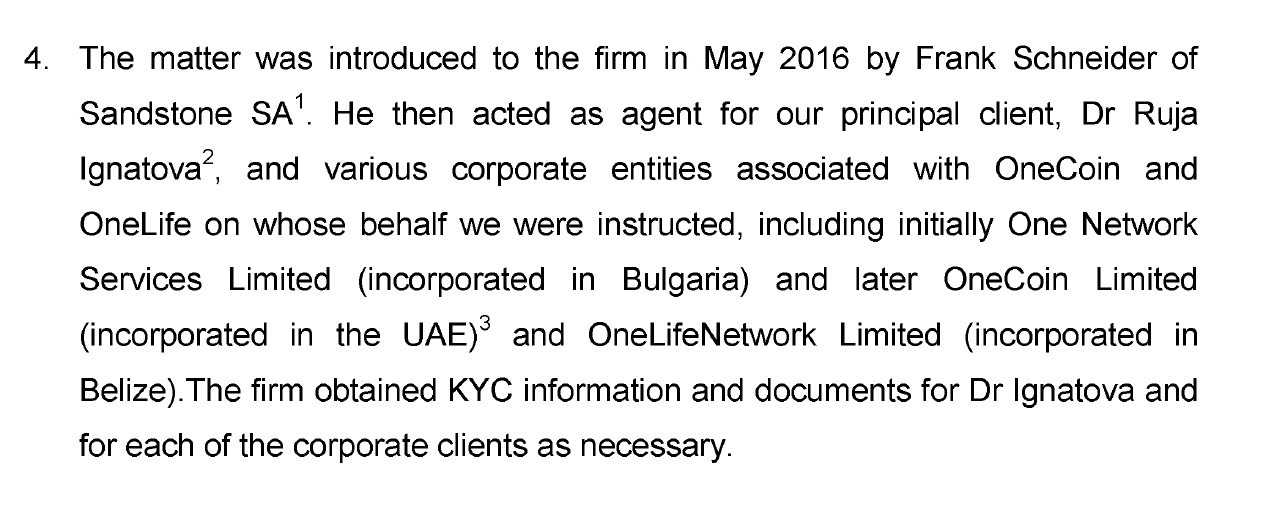
When the Solicitors Regulation Authority (SRA) started investigating Carter-Ruck, Carter-Ruck sent this explanation of how they started acting:
This misses out an important detail.
Carter-Ruck knew they were acting for their human client, Ruja Ignatova, and obtained copies of her passport and utility bill. However Carter-Ruck were also acting for the OneCoin companies – and Carter-Ruck appears to have known little or nothing about them.
“Know your client” (KYC) is the procedure which law firms, banks and many other types of businesses follow to identify their clients – both individual clients and corporate clients.
Carter-Ruck’s standard KYC form required Carter-Ruck to receive accounts or certificates of incorporation from their corporate clients. Carter-Ruck appears to have received no such documents from any OneCoin companies. Carter-Ruck asked in August 2016; received nothing, and just continued to act.
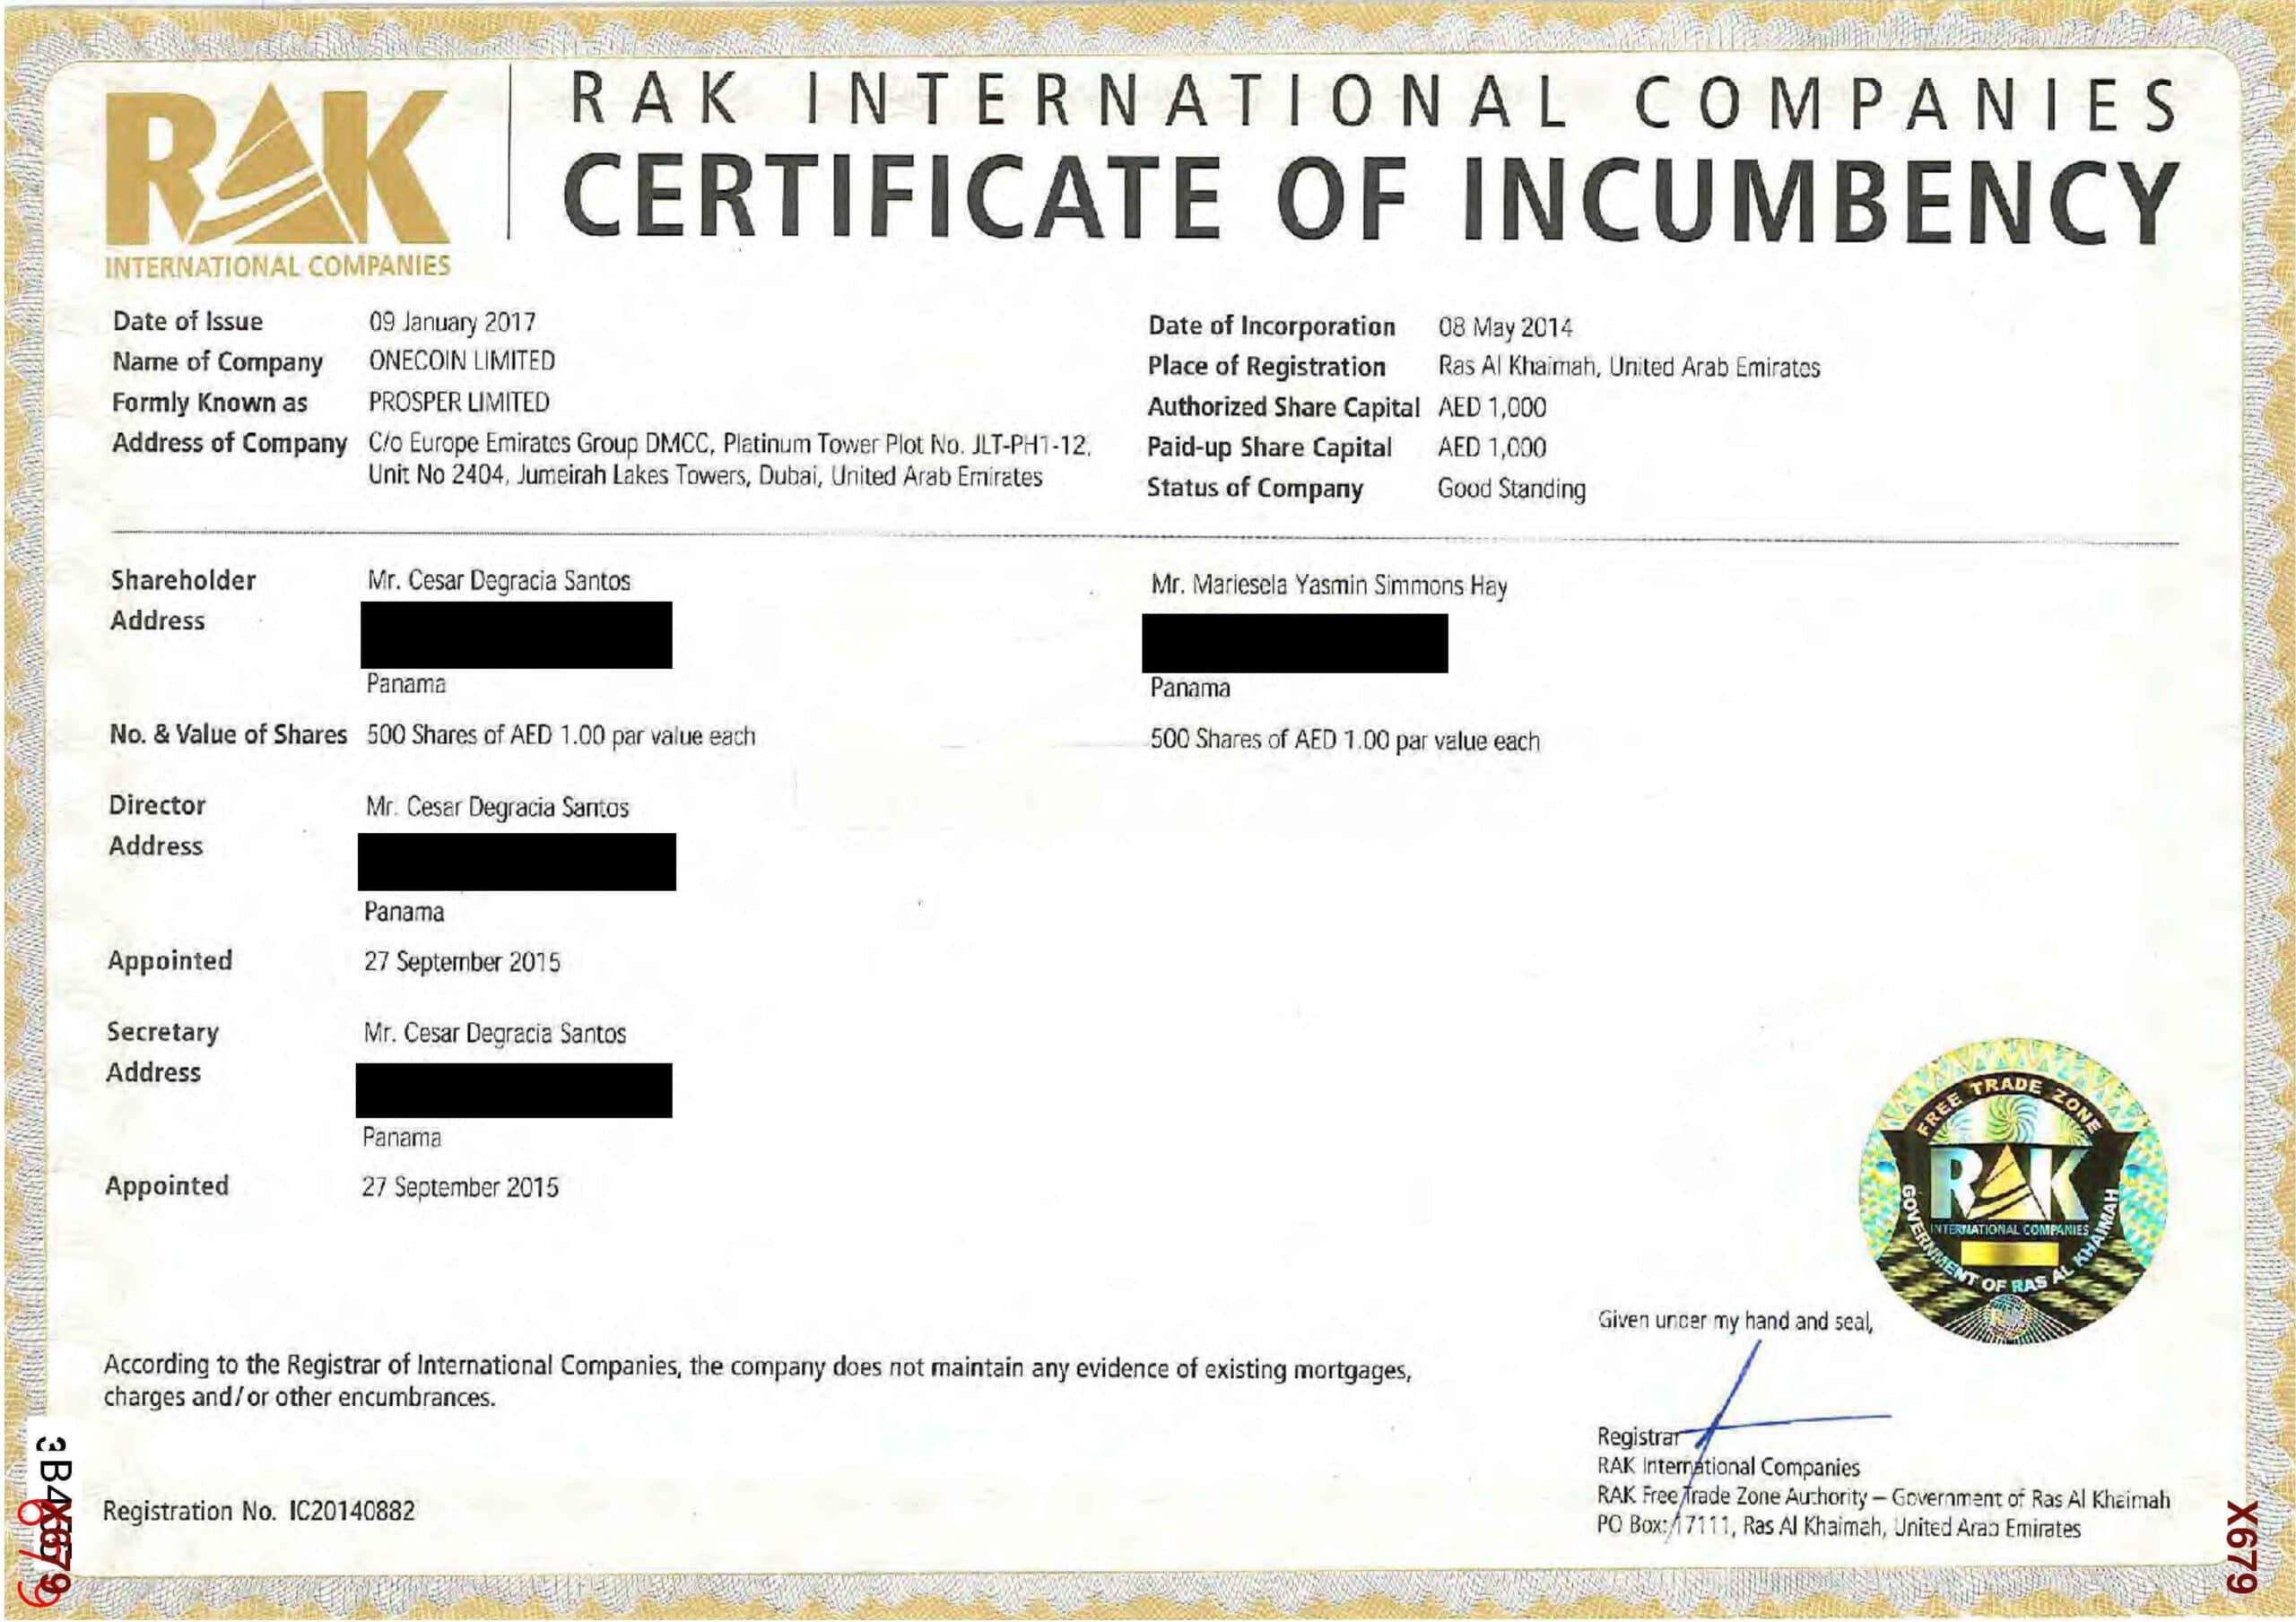
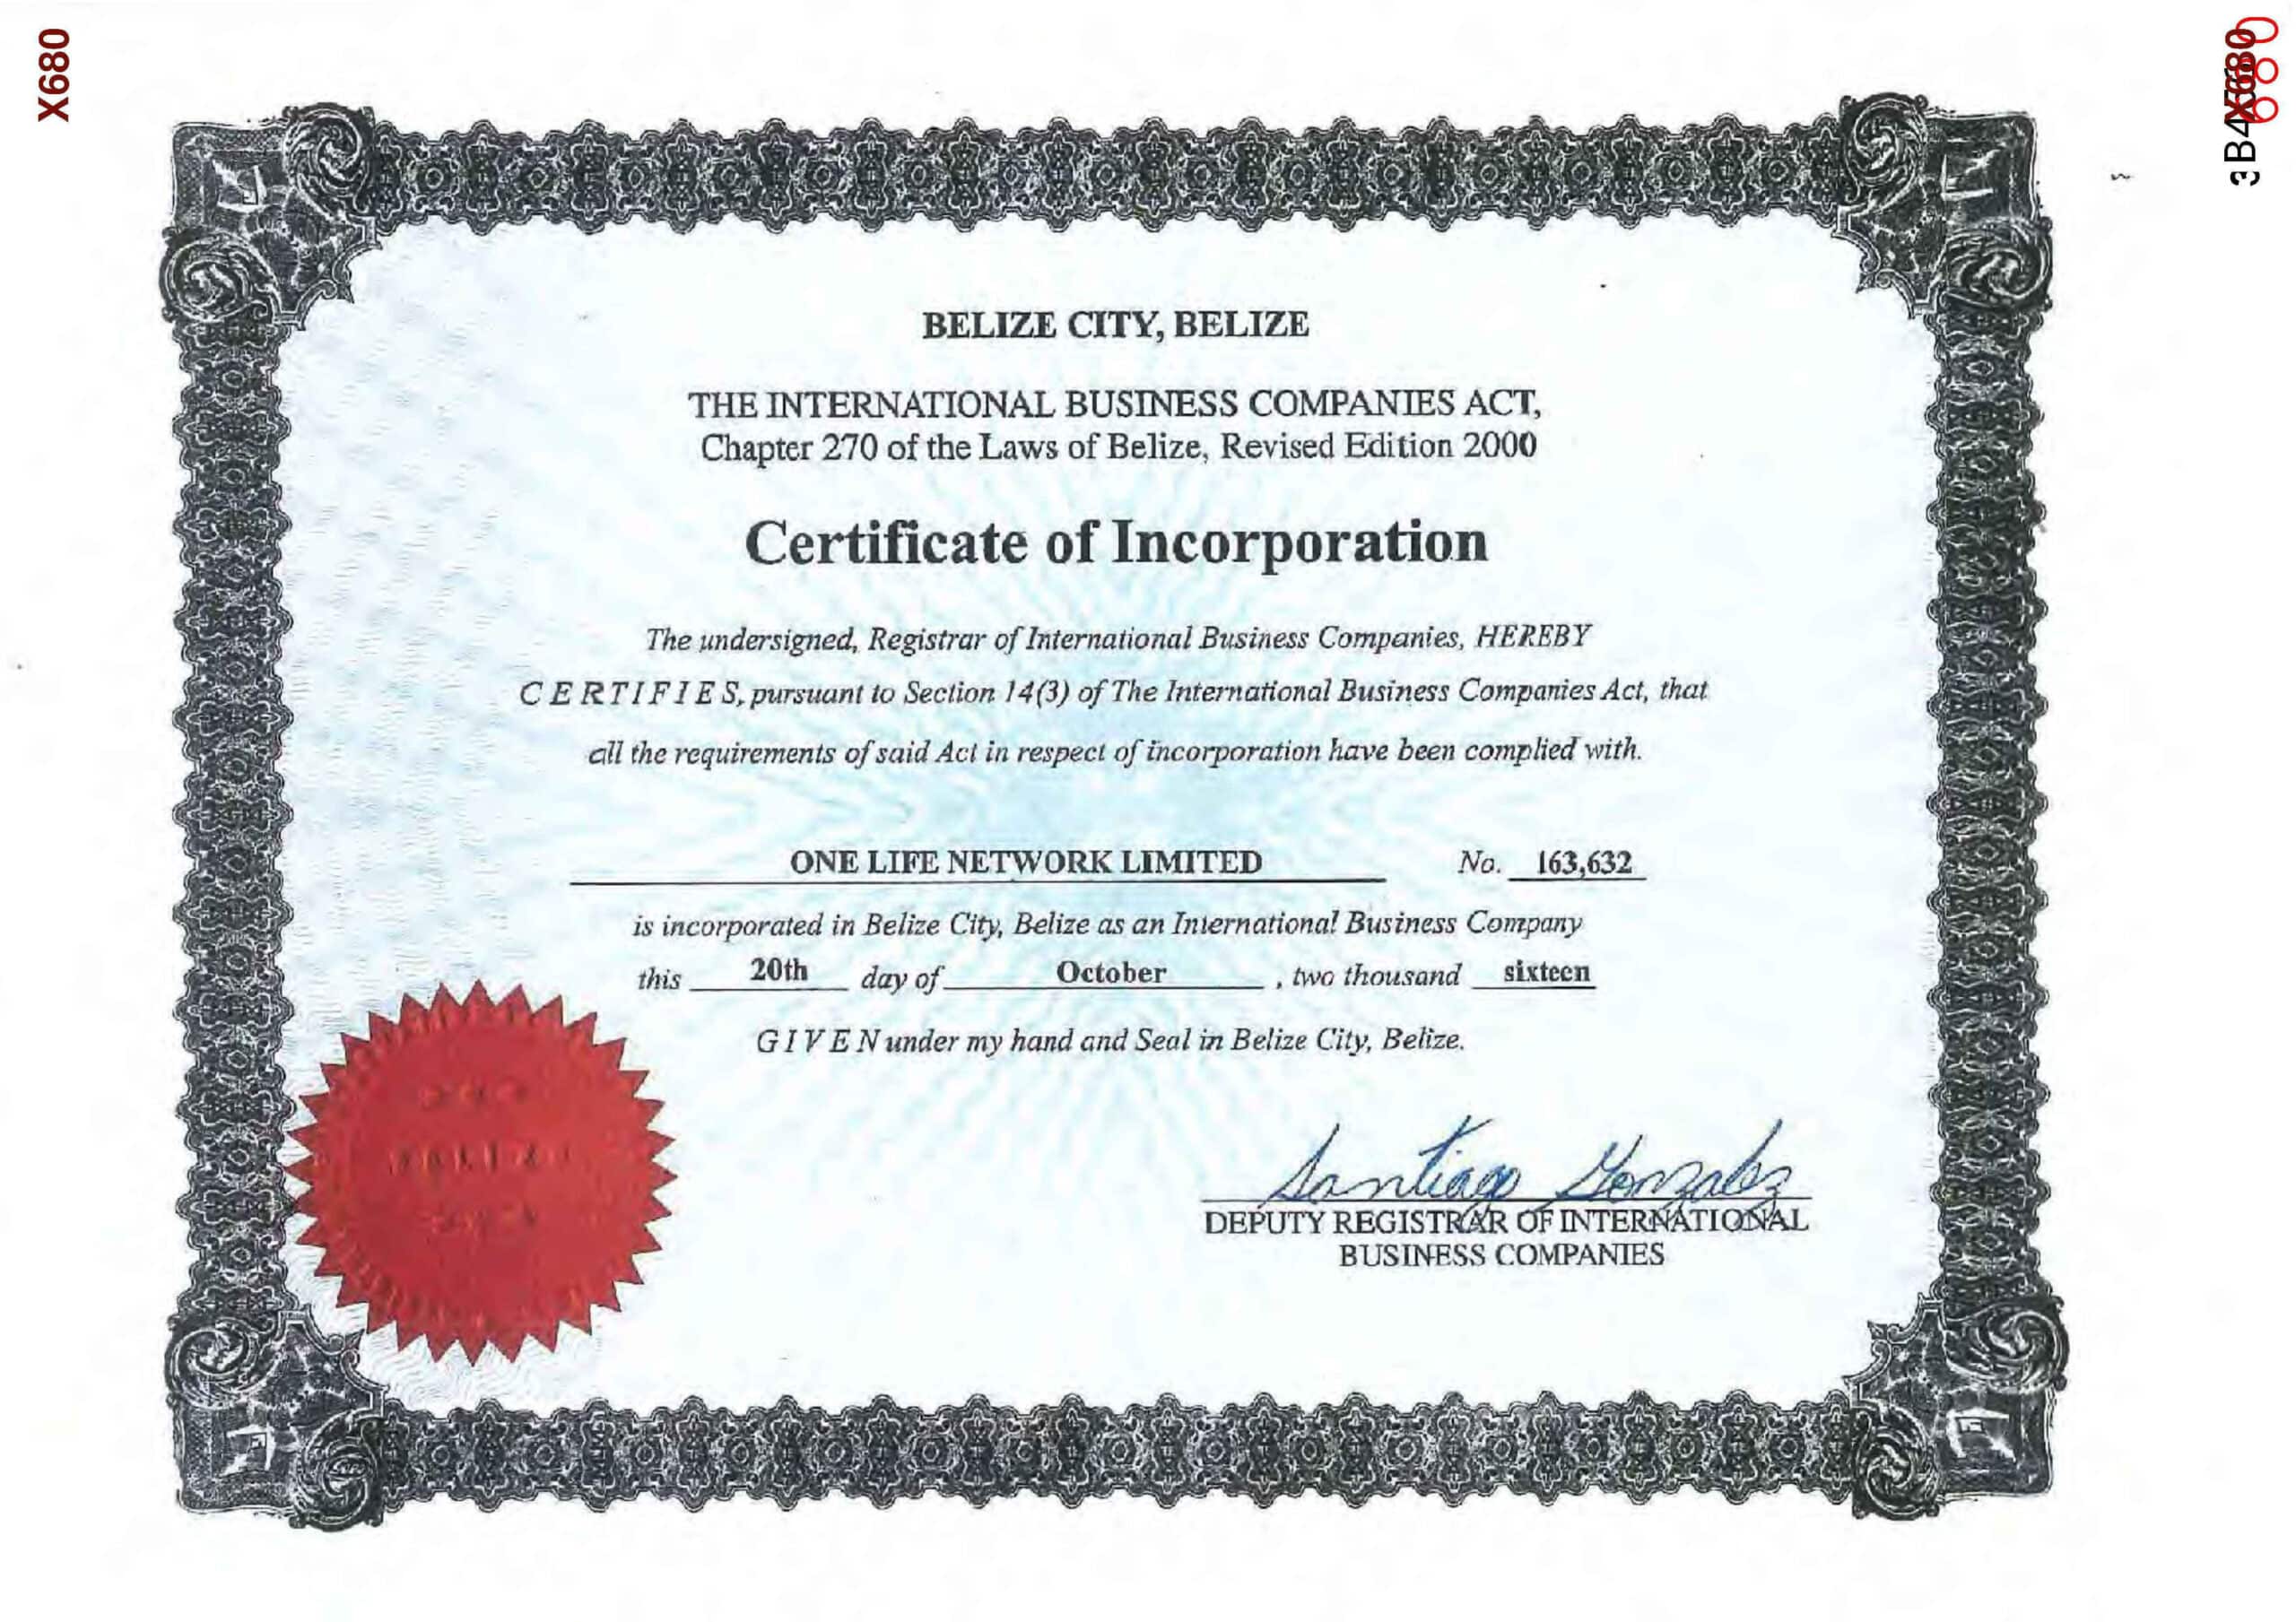
Carter-Ruck asked for the information again in October 2016 and again in December 2016; the next month they were finally sent this:
The first document shows OneCoin Ltd was incorporated in the UAE and had two unknown Panamanian individuals as shareholders. The second shows OneLife Network Ltd was incorporated in Belize, with no information on the shareholders.
We would expect most law firms’ KYC processes would have regard this as a red flag. Belize and Panama are not normal business locations for European businesses:
This was, however, more suspicious than merely companies and shareholders in high risk jurisdictions.
The two listed Panama shareholders, César Degracia Santos and Marisela Yasmín Simmons (now Simmons Hay), were readily identifiable as corporate services providers. In other words – they were fronting for the actual, unknown, owners of the company. The use of nominee shareholders in this kind of context is usually suspicious, and that’s particularly the case given that at the time the official position of the Panama authorities was that the law did not permit a Panamanian person to act as nominee shareholder for another.
It would have been usual practice for most law firms to speak to Messrs Santos and Simmons, to see who they were acting for. At that point, the firm might then have discovered that Santos and Simmons no longer owned OneCoin Ltd. There are documents which appear to show that by that time OneCoin Ltd had been sold to an Emirati royal in consideration for a huge number of Bitcoin plus the ownership of a bank.
It would have been good practice for Carter-Ruck’s KYC processes to check their new client had audited accounts. In 2015, OneCoin claimed it had been audited by a firm called Semper Fortis. At that point OneCoin claimed to have a market capitalisation of around $2bn. Semper Fortis was a small and unknown firm with no obvious credentials. As at January 2016, its website consisted of one page saying “under construction”. The comparison with Madoff’s obscure auditor is obvious.
There is, however, no evidence in the documents we reviewed that Carter-Ruck carried out due diligence, spoke to the Panamanian individuals, or appreciated the unusual and high risk nature of this arrangement. The 2017 risk email from Ms Gill just refers to a “complex corporate structure”. This was not a “complex” structure. It was a suspicious structure – those are two very different things.
Carter-Ruck continued with business as usual – their next step was to write to the City of London police, complaining that a police officer had defamed OneCoin when he sought to protect vulnerable and impressionable people from investing in the company. The Bureau of Investigative Journalism has wrote about that episode here.
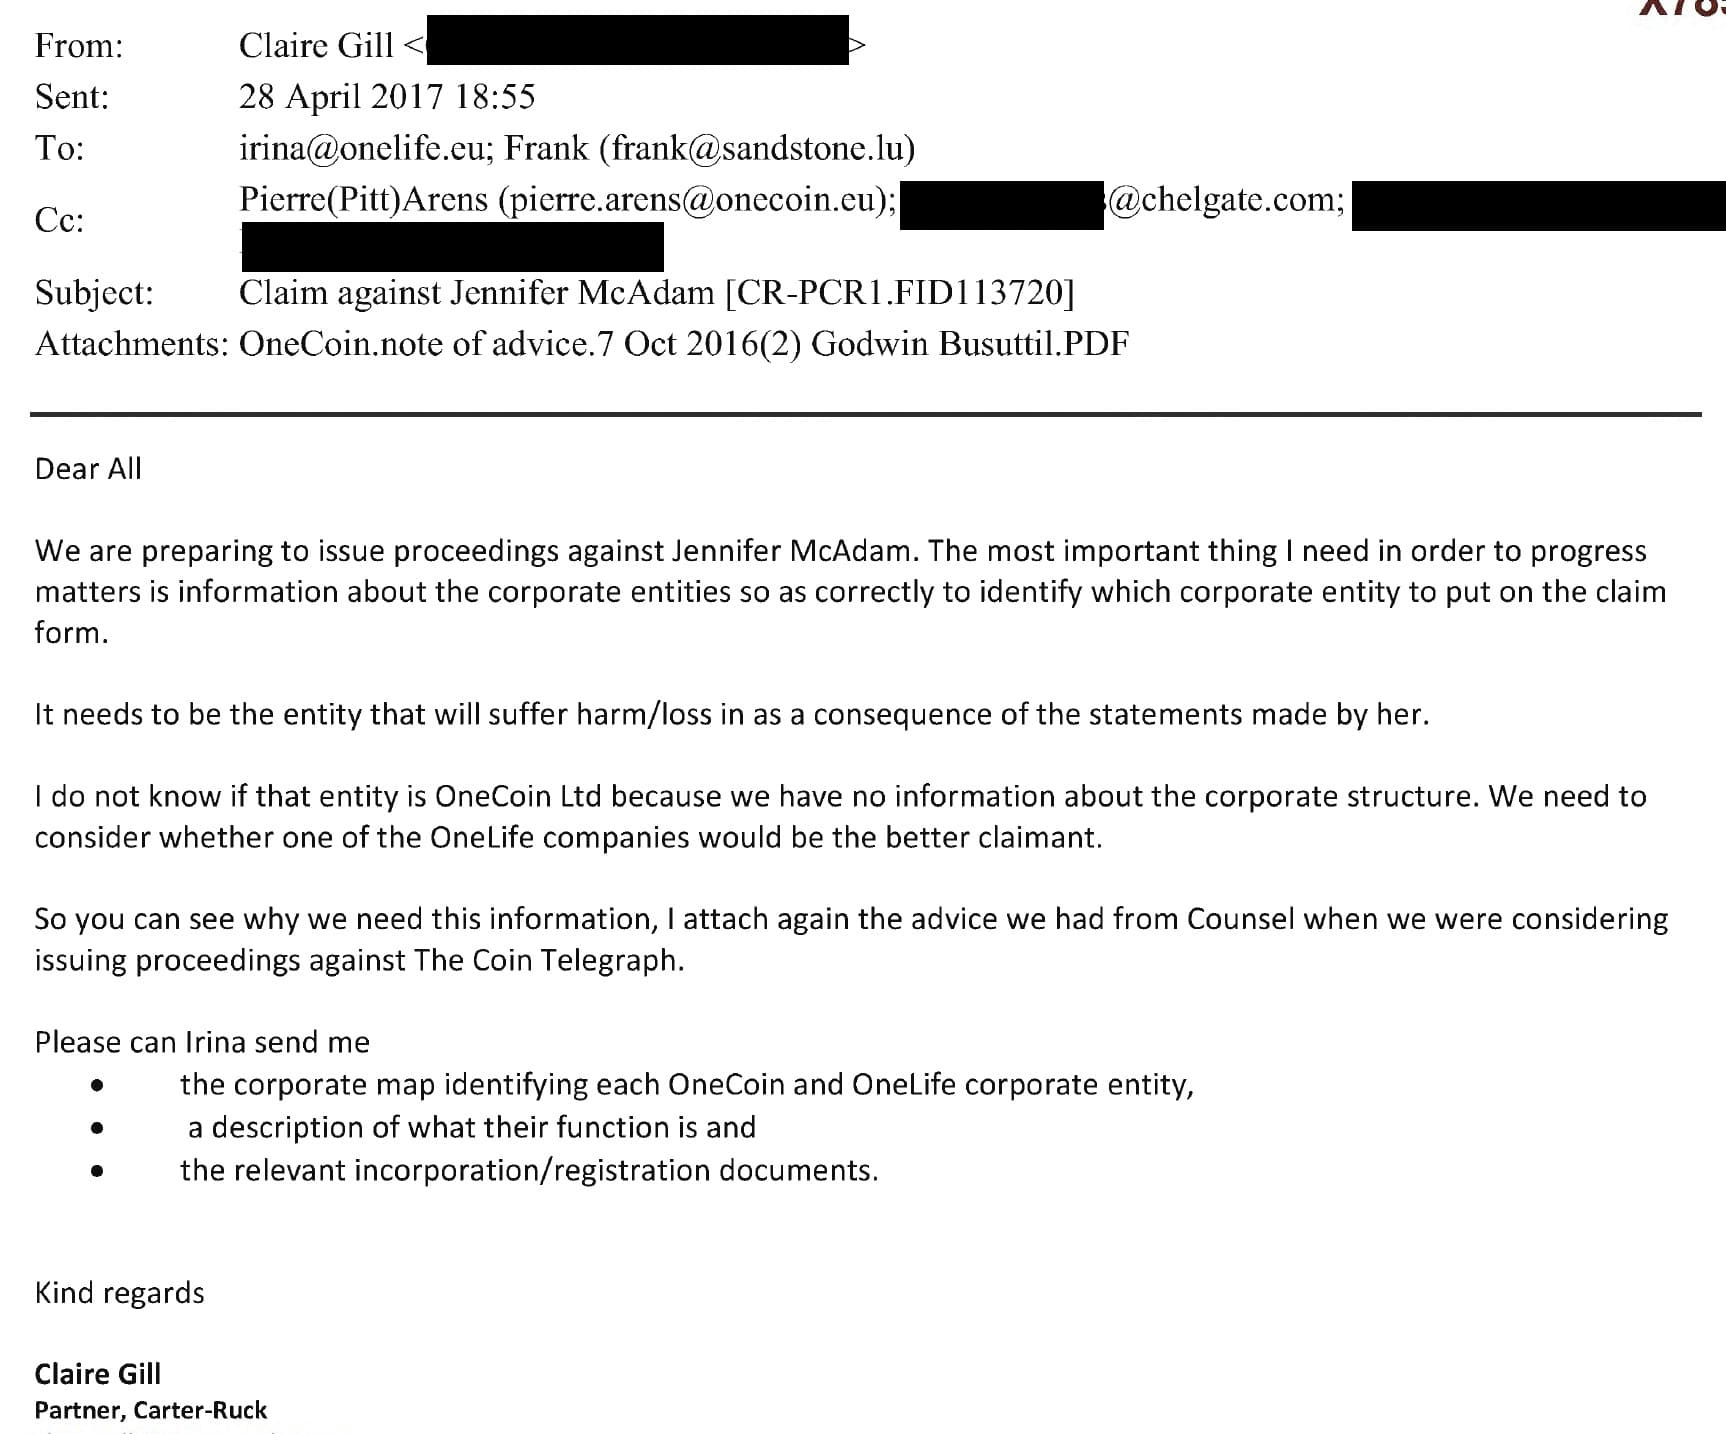
Carter-Ruck asked OneCoin for more information in April 2017, when they thought they were about to issue proceedings:
Carter-Ruck didn’t receive a response, but continued to act.
A month later, Carter-Ruck still didn’t know anything about the two Panamanian individuals, and still didn’t know who owned the Belize companies.
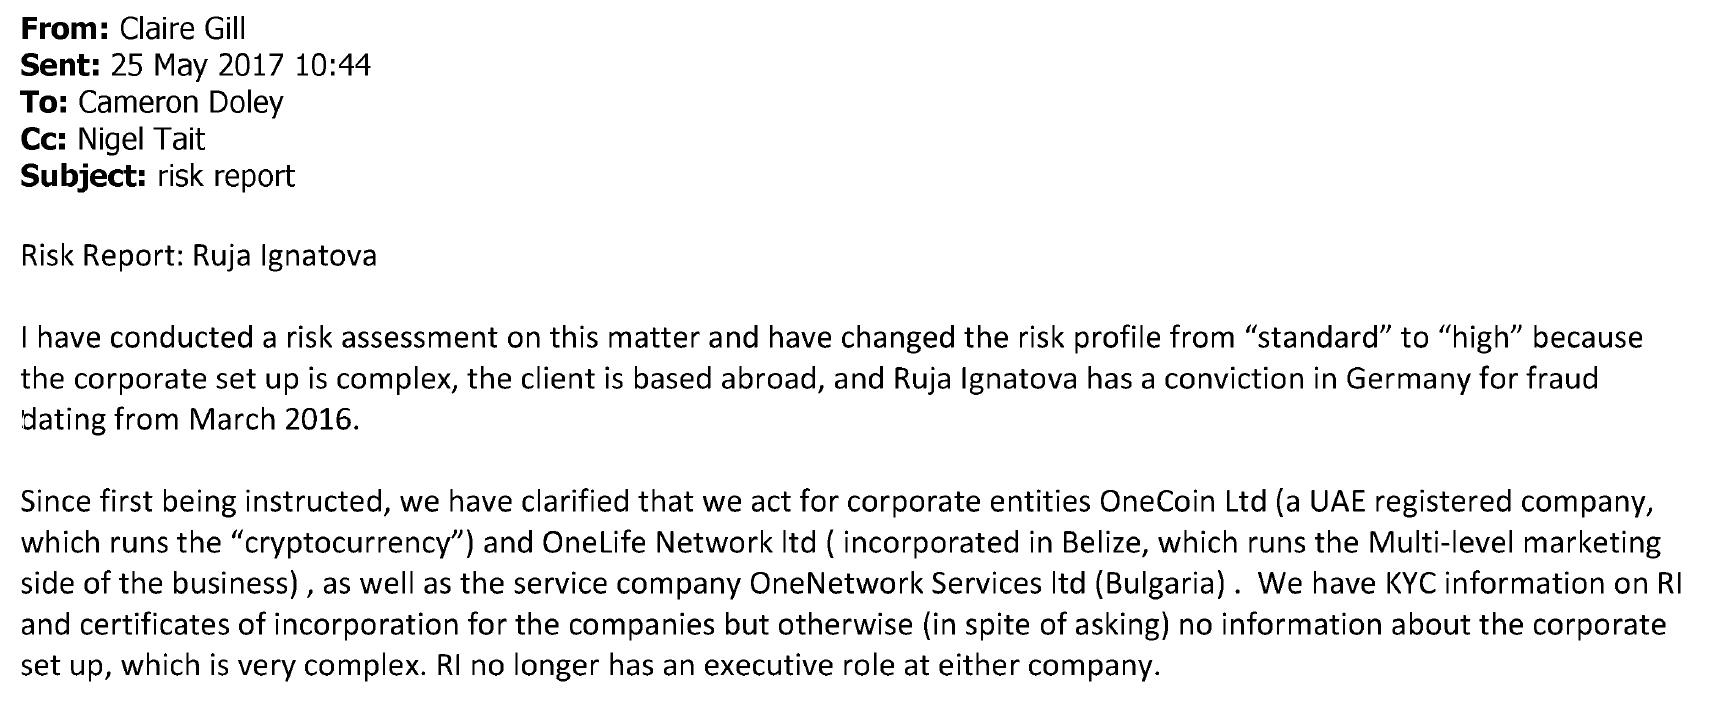
This is from an internal “risk report” prepared by Carter-Ruck on 25 May 2017; until this point, the risk profile had been “standard”.
We should add that we only have the documents disclosed to the SRA. There may be other documents which show that Carter-Ruck did investigate the Belize company and Panama shareholders, and did know who ultimately controlled the business. However that would beg the question: why wasn’t this mentioned in the 25 May 2017 risk report?
Carter-Ruck didn’t know who was paying them
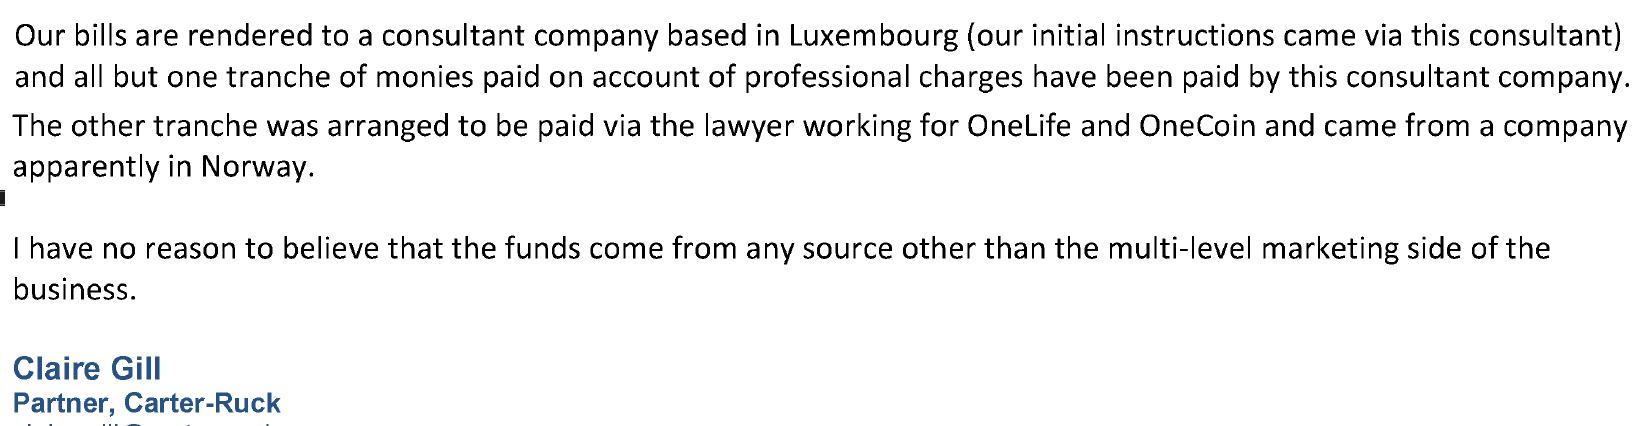
That same risk report concludes by saying that Carter-Ruck didn’t know which company was actually paying them, and didn’t know what the ultimate source of the payments was:
Most firms would regard it as a red flag to have their bills settled by a consultant. At a minimum, Carter-Ruck should have checked which company was paying Mr Schneider, and what that company’s source of funds was.
Mr Schneider is now himself a fugitive.
Again it may be that other documents showed that Carter-Ruck did know who paid them; and again it is then hard to understand why that wasn’t mentioned in the 25 May 2017 risk report.
Carter-Ruck either didn’t know Ruja Ignatova had a fraud conviction – or acted anyway
Sophisticated law firms usually conduct additional checks on their clients using private databases and/or the open internet.
If Carter-Ruck had conducted such a search in 2016, it would likely have revealed that their client, Ruja Ignatova, had been accused of fraud, and it would likely have found a reference in the trade press to her being prosecuted.
Ms Ignatova was convicted of fraud by a German court in April 2016, in her absence. It’s unclear when Carter-Ruck first became aware of this. The first mention in the Carter-Ruck files is on 9 May 2017, in advice from Matthew Nicklin KC to Carter-Ruck (he says the conviction means Ms Ignatova shouldn’t be the claimant in any libel action). It’s mentioned again in Ms Gill’s 25 May 2017 “risk report“.
It’s possible Carter-Ruck always knew about Ms Ignatova’s conviction. It’s possible they discovered it late. However there is no evidence that knowledge of the conviction changed the way Carter-Ruck acted – with one exception.
Carter-Ruck wrote to a Moldovan TV station on 20 October 2017, and said that there had been no criminal convictions of their clients anywhere in the world. This was arguably true; that letter said Carter-Ruck’s clients were two OneCoin companies. However Carter-Ruck were also acting for Ruja Ignatova – it may be that her name was absent from this letter because Carter-Ruck now knew she had a criminal conviction for fraud.
Carter-Ruck kept OneCoin alive
In any Ponzi scheme, survival depends on two things: a steady stream of incoming cash to stay afloat, and limiting the numbers of existing investors cashing out.
It’s all about confidence. When that ends, and participants begin demanding their money back en masse, the scheme collapses because there is no genuine underlying revenue.
So it was critical to OneCoin’s survival that its investors (in reality, victims) didn’t withdraw too much money. In Internal OneCoin documents provided to Carter-Ruck in 2016 showed that over 50% of amounts paid out by OneCoin to its investors were “reinvested” in OneCoin. At some point this became insufficient to sustain the Ponzi, so on 1 January 2017, OneCoin blocked withdrawals.
The blocking of withdrawals is often a sign of a Ponzi scheme reaching its end. At that point all that was sustaining OneCoin was faith – and the criticisms of one whistleblower, Jen McAdam, and a cryptocurrency expert, Bjørn Bjercke, became a particular threat.
We can see this in communications from a OneCoin investor/marketer called Lynn, who was desperately worried about Mr Bjercke’s criticisms. She wrote to OneCoin, in an email forward to Carter-Ruck, that “A statement or press release or company video or anything from the legal department or from Dr Ruja would definitely go a long way to stop the fear from affecting my business and the businesses of my team members”.
Lynn wrote in another email that OneCoin had to take action to help her fellow investors/victims “gain belief and trust in the company again”, and that Jen McAdam was “destroying” the business by telling people that OneCoin was a scam and was under investigation by the City of London police (which it was). Lynn’s emails became increasingly nervous – and that prompted an immediate reaction from OneCoin.
Investor anxiety was immediately channelled into legal and PR strategy – Carter-Ruck received these emails within hours.
Ms Gill wrote in response that she understood that the publicity was making the OneCoin business “difficult to operate”. Or, as we now know (and Ms Gill should have suspected) that it was risking the unravelling of the fraud.
Carter-Ruck therefore planned to commence legal action against Ms McAdam to (in Ms Gill’s words) “reassure members” and send a “strong PR message”.
The first part of Carter-Ruck’s work was investor reassurance; the second was suppressing official warnings. In September 2016 they wrote to the Financial Conduct Authority challenging the risk warning it had published on OneCoin. In April 2017, Carter-Ruck wrote to the City of London Police after a senior officer publicly warned people about OneCoin, with Carter-Ruck saying that his statements were “causing damage” to the reputation of OneCoin and to its business. A few months later Carter-Ruck escalated matters, writing to the Chairman of the City of London’s Police Committee to complain that the police were taking “active steps” to “disrupt our clients” business”, calling this “unacceptable”.
So this was Carter-Ruck’s role – in its own words, to “silence the critics and the ultimately the police”.
By silencing critics and challenging police warnings, Carter-Ruck’s actions helped OneCoin sustain the appearance of legitimacy – and with it, the flow and retention of investors’ money.
Did Carter-Ruck break the law?
We believe Carter-Ruck acted unprofessionally, indeed recklessly. The key question is whether any laws were broken.
Money laundering rules
The SRA conducted a lengthy investigation and eventually made three formal allegations against the Carter-Ruck partner, Claire Gill. One of those included undertaking insufficient client due diligence.
The allegations were considered by the SRA’s “Authorised Decision Maker” who issued a Decision Notice which determined to proceed with one allegation (improper conduct of litigation) but not the others. The allegation of undertaking insufficient due diligence was rejected because the SRA had not identified a specific obligation which Ms Gill had breached. A full copy of the Decision Notice is here – see paragraphs 20 and 21.
The reason is simple: Carter-Ruck was not AML-regulated.
A regulated firm has to conduct extensive checks to establish the bona fides of its client, and is required to report any suspicion of money laundering. An unregulated firm is subject to much weaker standards.
AML rules apply only to firms that undertake certain types of legal work: work that, broadly speaking, involves tax, finance, property or the creation/management of trusts and companies. A firm, like Carter-Ruck, that only conducts media law and related litigation is not normally required to be regulated.
Proceeds of Crime Act offences
There are, however, two important anti-money laundering rules that apply even to unregulated firms: sections 328 and 329 of the Proceeds of Crime Act 2002:
The offence in section 328 applies if (1) a person enters into or becomes concerned in an “arrangement”, (2) they know or suspect, (3) that the arrangement facilitates, by whatever means, the acquisition, retention, use or control, (4) of criminal property by or on behalf of another person.
Carter-Ruck’s instruction and activities for OneCoin were likely an “arrangement”.
Whilst not intended by Carter-Ruck, objectively their involvement likely “facilitated” the retention of criminal property (cash) by OneCoin, by silencing OneCoin’s critics, preventing its “investors” from demanding their money back, and enabling its fraud to continue. We anticipate Carter-Ruck may argue that “facilitation” only covers direct dealing in criminal property – but the words “whatever means” make this a difficult argument to sustain. The Solicitors Disciplinary Tribunal has already ruled that Carter-Ruck was instructed to further a fraud.
The Court of Appeal held in Bowman v Fels that section 328 does not apply to the “ordinary conduct of legal proceedings”, even if a lawyer suspects that a litigation settlement may be paid from criminal property. This case is different. On the evidence, Carter-Ruck’s threats and takedowns went beyond the incidental disposition of criminal proceeds: they were used to takedown YouTube videos and suppress warnings from journalists, whistleblowers, regulators and the police, and therefore prolong the fraud. That was not an incidental consequence of Carter-Ruck’s actions, but (from OneCoin’s perspective) their purpose. Claire Gill herself said, “The goal of legal action is to reassure members and to send a strong PR message”. These were not “ordinary” legal proceedings.
There is a further point: the SRA are prosecuting Carter-Ruck for engaging in abusive litigation: if the SRA’s case is proven then this was not “ordinary conduct” by Carter-Ruck.
There have been no POCA cases on facts of this kind – but few law firms have found themselves in the position Carter-Ruck did. It’s our view, based on discussions with POCA specialists, that it’s likely the section 328 offence was committed if Carter-Ruck did suspect that it was facilitating the retention or control of criminal property by its clients.
The offence in section 329 is committed where a person acquires, uses, or has possession of “criminal property” and knows or suspects that it is criminal property.
We expect Carter-Ruck were (unknowingly) receiving criminal property – their fees were presumably the proceeds of OneCoin’s fraud (given that OneCoin appears to have had no legitimate business).
Many lawyers act for criminal clients and, therefore, must suspect that the fees they are receiving are criminal property. However, ordinarily, a lawyer in this position can say that they provided “adequate consideration” for the fees (by providing legal services) and so qualify for the defence in section 329(2)(c). However, section 329(3)(c) says that “provision by a person of goods or services which he knows or suspects may help another to carry out criminal conduct is not consideration”.
As a factual matter, Carter-Ruck were helping OneCoin to carry out criminal conduct: they were (unwittingly) enabling OneCoin to keep the fraud going, and retain their existing criminal property. It’s therefore our view, again based on discussions with POCA specialists, that if Carter-Ruck did suspect that this was happening, then the section 329 offence may have been committed. Even if some receipts by Carter-Ruck were shielded by the “adequate consideration” defence then others may not be. We believe that the legal analysis for section 329 is clearer than for section 328.
The critical point is therefore that both criminal offences will only apply if Claire Gill or others at Carter-Ruck suspected that OneCoin was a fraud, and suspected that Carter-Ruck’s actions were facilitating/helping a fraud.
It is important to be clear: the POCA offences will never normally apply to a lawyer acting for somebody who may be a criminal, even if the lawyer suspects the person is a criminal. In most circumstances – and in particular if the lawyer is defending the person in criminal proceedings – the lawyer is never “facilitating” or “helping” ongoing criminality. Carter-Ruck’s actions, however, were unusual. As a factual matter, they likely did help and facilitate the continuation of fraud by OneCoin. That will surely not have been Carter-Ruck’s intention – but “intention” is not the test here. “Suspicion” is the test.
Carter-Ruck appear to disagree, although they have not said why. Possibly their view is that s329 applies to a lawyer if their action is an intrinsic part of the crime itself – for example a lawyer structuring a fraudulent transaction. The problem with this is that a Ponzi fraud is all about deception and ensuring that the “investors” continue to believe their investment is real. Carter-Ruck’s actions were a critical part of that – as Claire Gill said, “The goal of legal action is to reassure members and to send a strong PR message”. Deception and reputation management were not side issues; they were the core mechanics of the crime itself – and that required Carter-Ruck’s legal threats.
Carter-Ruck may also claim that any prosecution sets a dangerous precedent – a “chilling effect” that would prevent lawyers acting in the best interest of controversial clients. It would not, for the simple reason that a lawyer in this position could simply file a DAML SAR. That is what lawyers in much less suspicious cases do frequently.
Was there a SAR?
There is a defence to sections 328 and 329 for a person who becomes suspicious that they may be dealing/facilitating dealing in criminal property – an “authorised disclosure” to the National Crime Agency – a “Defence Against Money Laundering Suspicious Activity Report“, or “DAML SAR“.
(Note this is different from an “ordinary” SAR where a firm is reporting a suspicion of money-laundering by a client or other party. A DAML SAR is where the firm suspects it may itself facilitate criminality, or receive criminal proceeds. Ordinary SARs are generally relevant only to firms undertaking AML-regulated work. Carter-Ruck was not AML-regulated – but DAML SARs are relevant to everyone.)
The NCA then has seven days in which it decides whether to grant the DAML – meaning that the person then has a defence against any accusation they have committed an offence under sections 328 and 329. Consent is deemed to be given if the NCA doesn’t respond within the seven days.
We spoke to lawyers with decades of expertise in KYC/AML/compliance roles at a variety of large and small law firms, regulated and unregulated. Their consistent view was that, on these facts, they would have filed a DAML SAR as soon as any suspicion arose, and would have considered further reports each time a new potential offence might arise (for example, before sending a letter threatening proceedings or raising an invoice).
From a risk perspective there is no reason not to file a DAML SAR if there is the slightest doubt (as, under section 338(4A) POCA, legal privilege generally does not prevent filing a DAML SAR). There are, on the other hand, very adverse consequences if one does not file a DAML SAR and an offence is in fact committed. Our contacts therefore all recalled filing DAML SARs in much less suspicious circumstances than those surrounding OneCoin. This is reflected in the high number of DAML SARs filed by law firms (of which around 5% were refused).
If Carter-Ruck did file appropriate DAML SARs, and received consent or deemed consent, then any potential criminal liability under POCA would be extinguished.
However we infer that Carter-Ruck did not file a DAML SAR, for three reasons:
- It seems unlikely that any disclosure was made before May 2017, or that would surely have been mentioned in the risk report.
- No reference to a SAR appears in Carter-Ruck’s correspondence with the SRA, even when the SRA was investigating due-diligence failures.
- When we wrote to Carter-Ruck identifying the possible offences under sections 328 and 329, their response did not mention any DAML SAR. Instead, it asserted in general terms that our legal analysis was “misguided”. It would be perverse for them not to mention a DAML SAR, had one been filed.
The evidence for “suspicion” under POCA
The threshold for “suspicion” under POCA is low. The NCA says there does not need to be anything amounting to evidence.
The leading case holds that a person:
“must think that there is a possibility, which is more than fanciful, that the relevant facts exist. A vague feeling of unease would not suffice. But the statute does not require the suspicion to be “clear” or “firmly grounded and targeted on specific facts”, or based upon “reasonable grounds”.
…
the suspicion must be of a settled nature; a case might, for example, arise in which a defendant did entertain a suspicion in the above sense but, on further thought, honestly dismissed it from his or her mind as being unworthy or as
contrary to such evidence as existed or as being outweighed by other considerations”
It is a question of fact whether Ms Gill suspected that her client was in fact engaged in fraud, and whether she would be helping/facilitating that fraud.
While this legal test is subjective (what Ms Gill actually suspected), courts can infer this suspicion from the surrounding facts.
Looking at the facts in question:
- In 2016 and 2017 many people believed that OneCoin was fraudulent.
- In June 2016, an executive at Apex Fund Services acting on a fundraising saw a OneCoin email address on a document and, after seeing the results of a series of internet searches, he called an emergency meeting with his risk and compliance teams, and filed a “suspicious activity report” with Apex’s anti-money laundering regulator.
- In December 2016, the Bank of New York’s compliance team determined, on the basis of internet searches, that OneCoin was a Ponzi scheme.
- On 1 January 2017, OneCoin blocked its “investors” from withdrawing their money – a classic sign of a Ponzi scheme.
- The evidence continued to accumulate through the course of 2017.
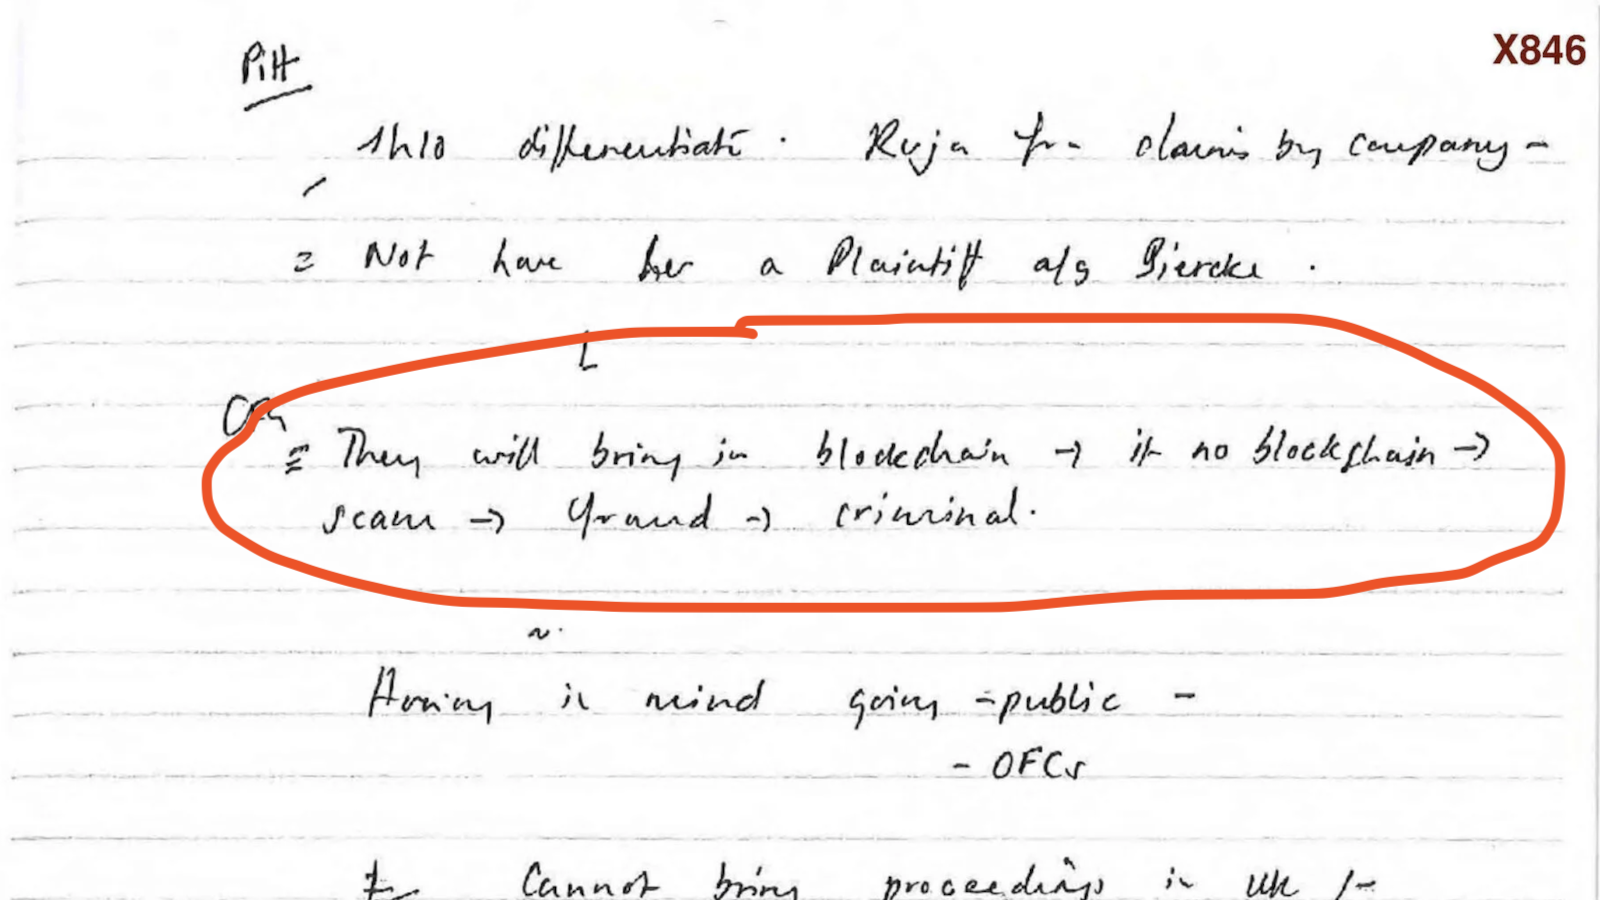
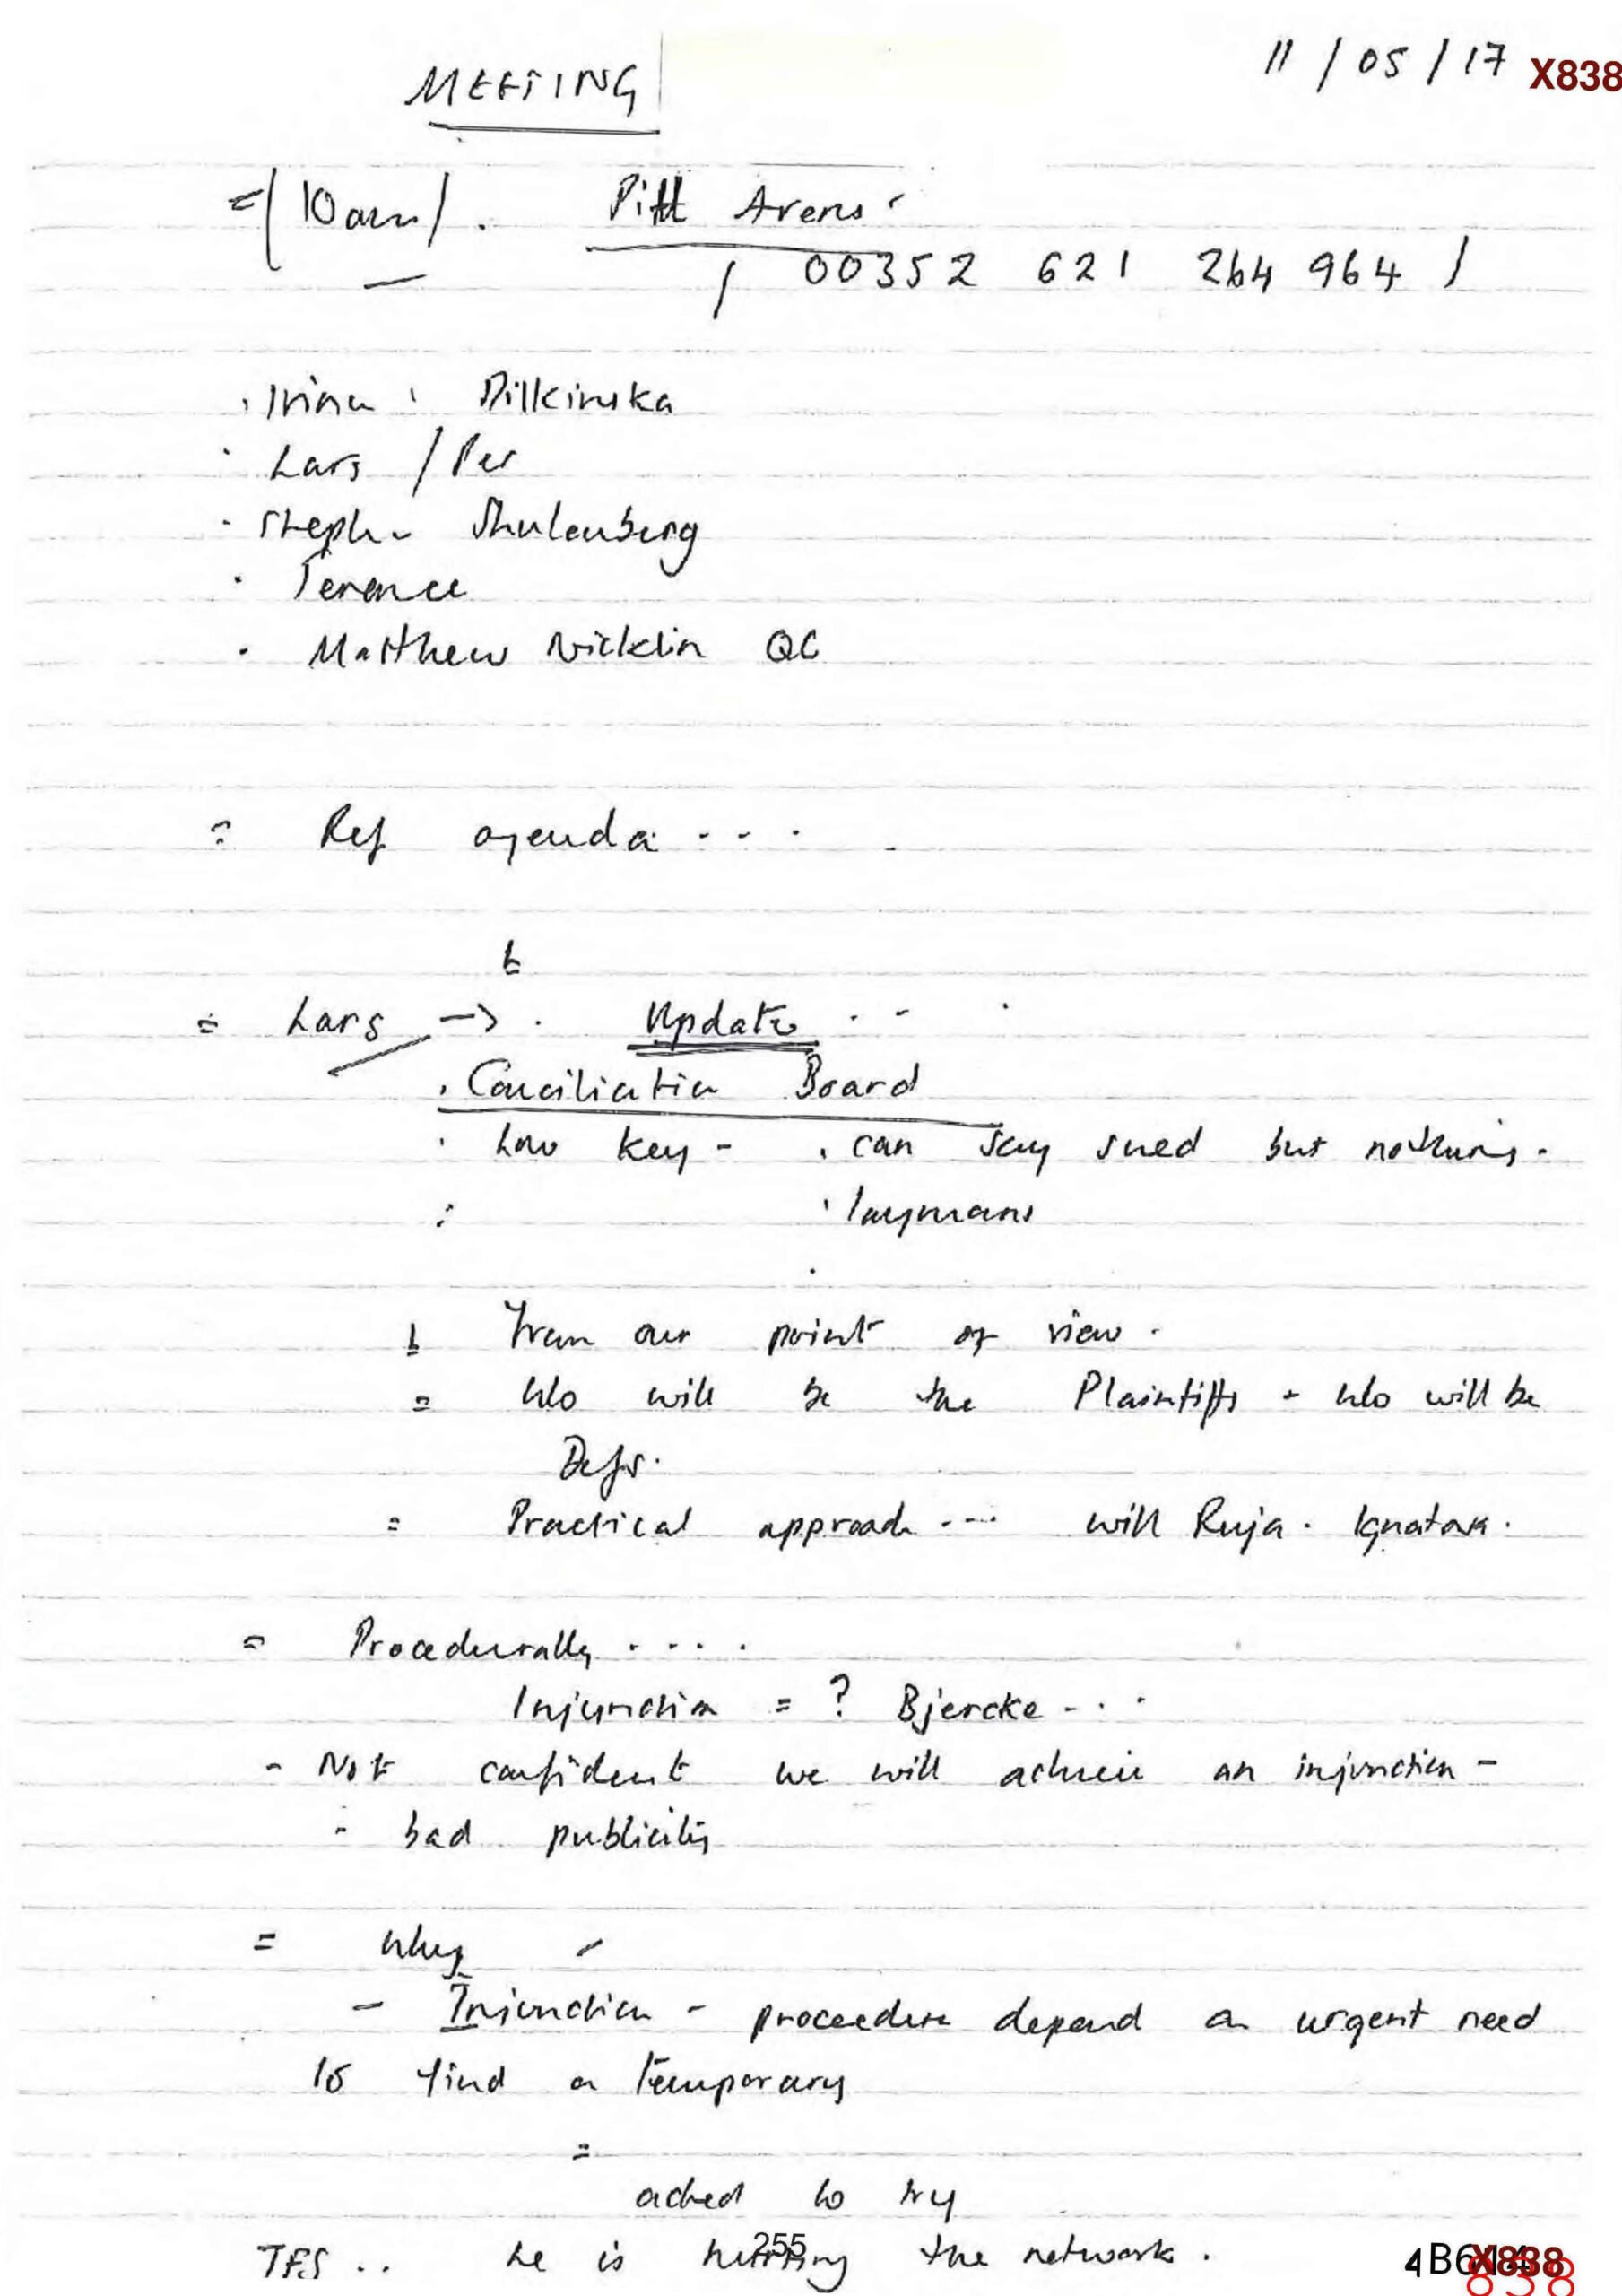
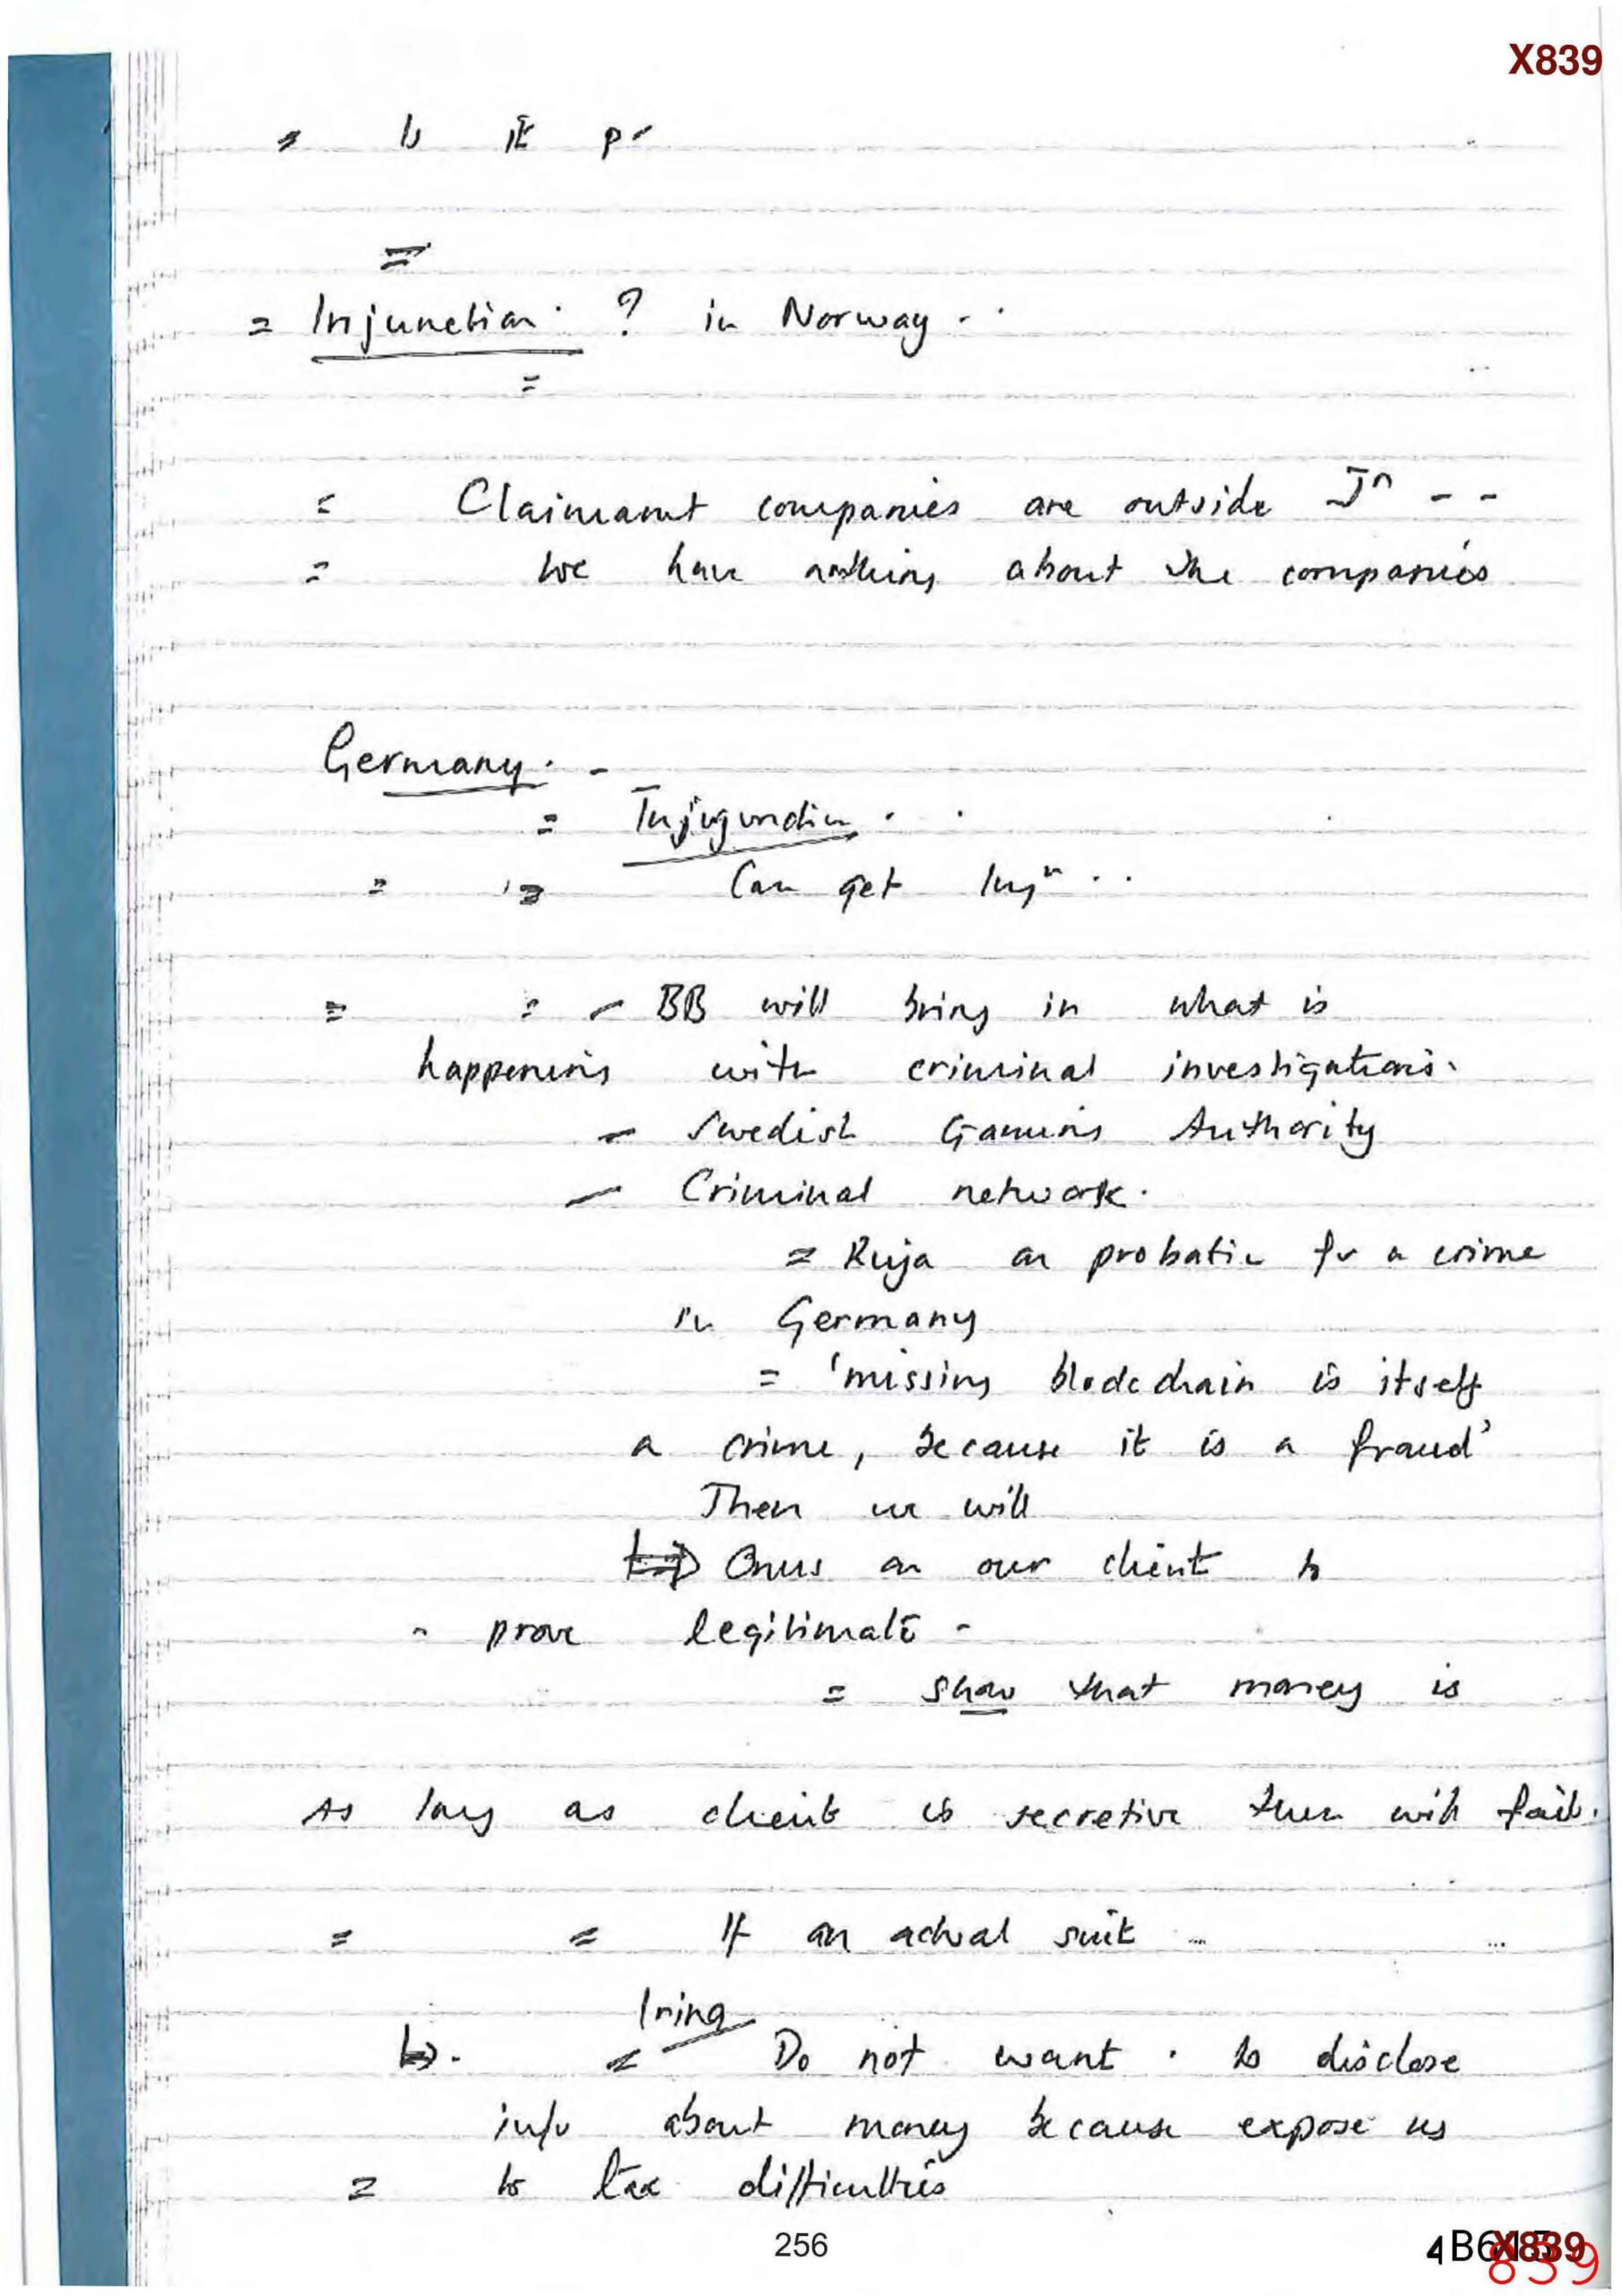
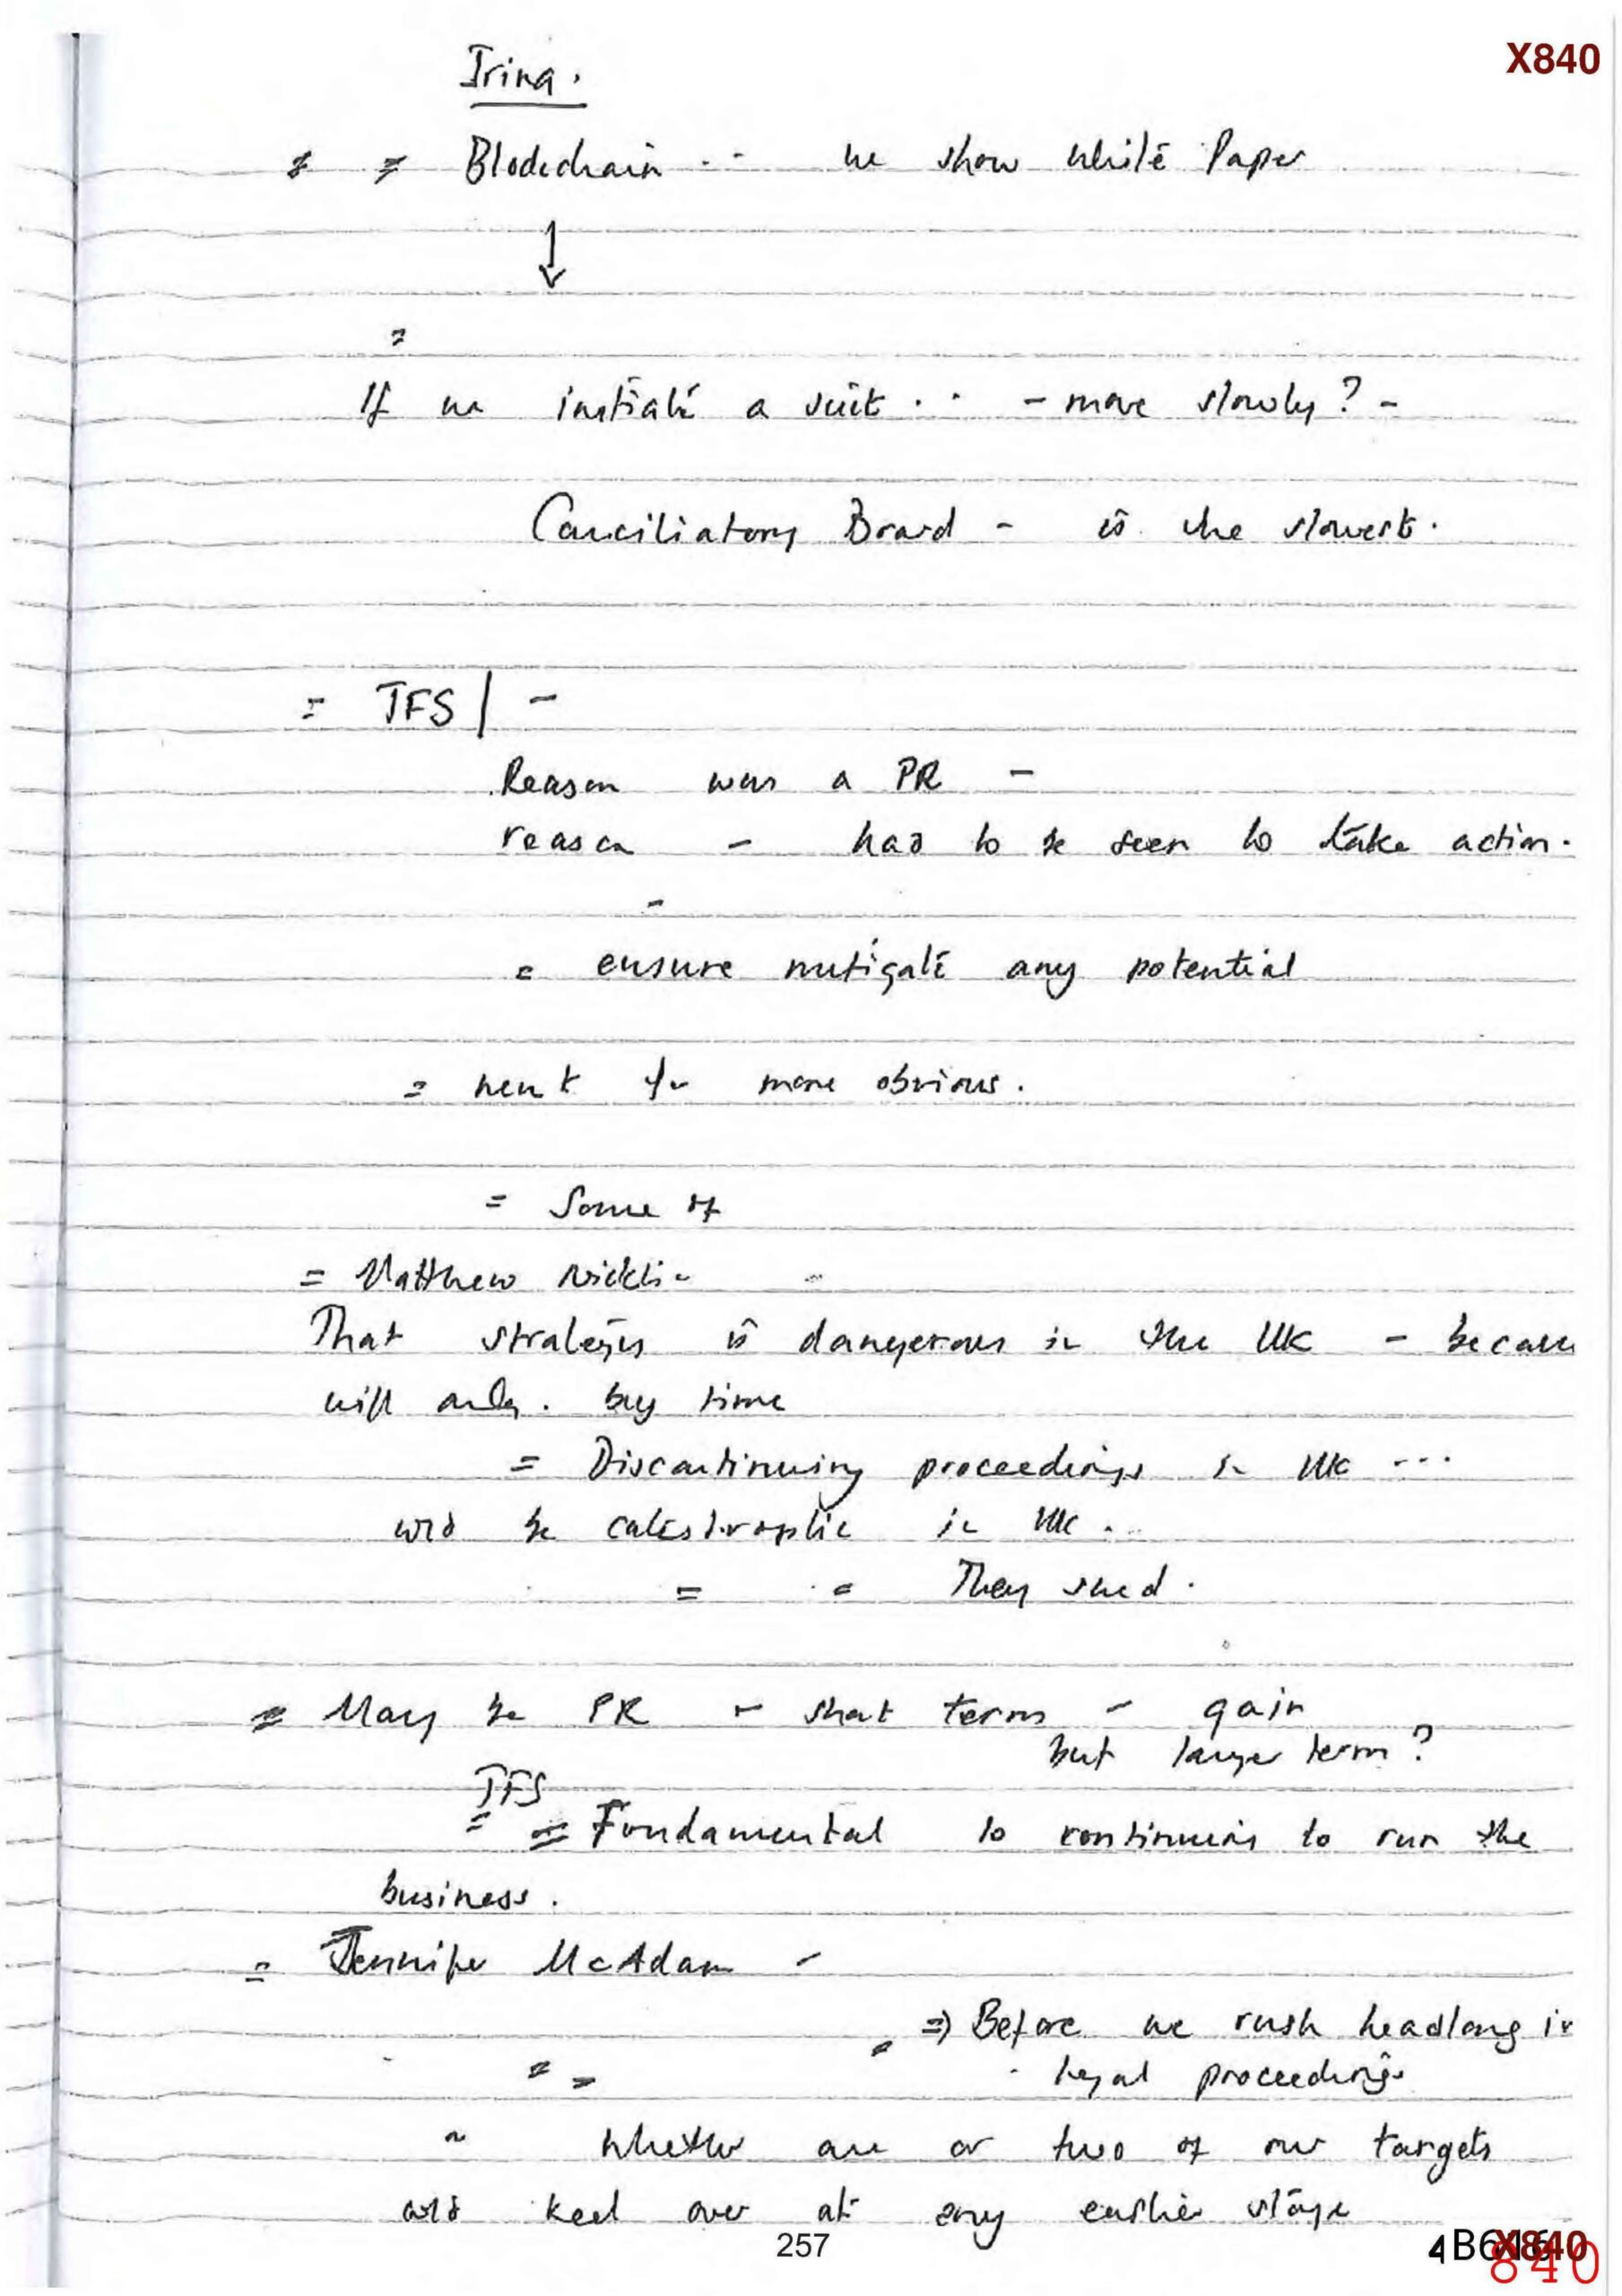
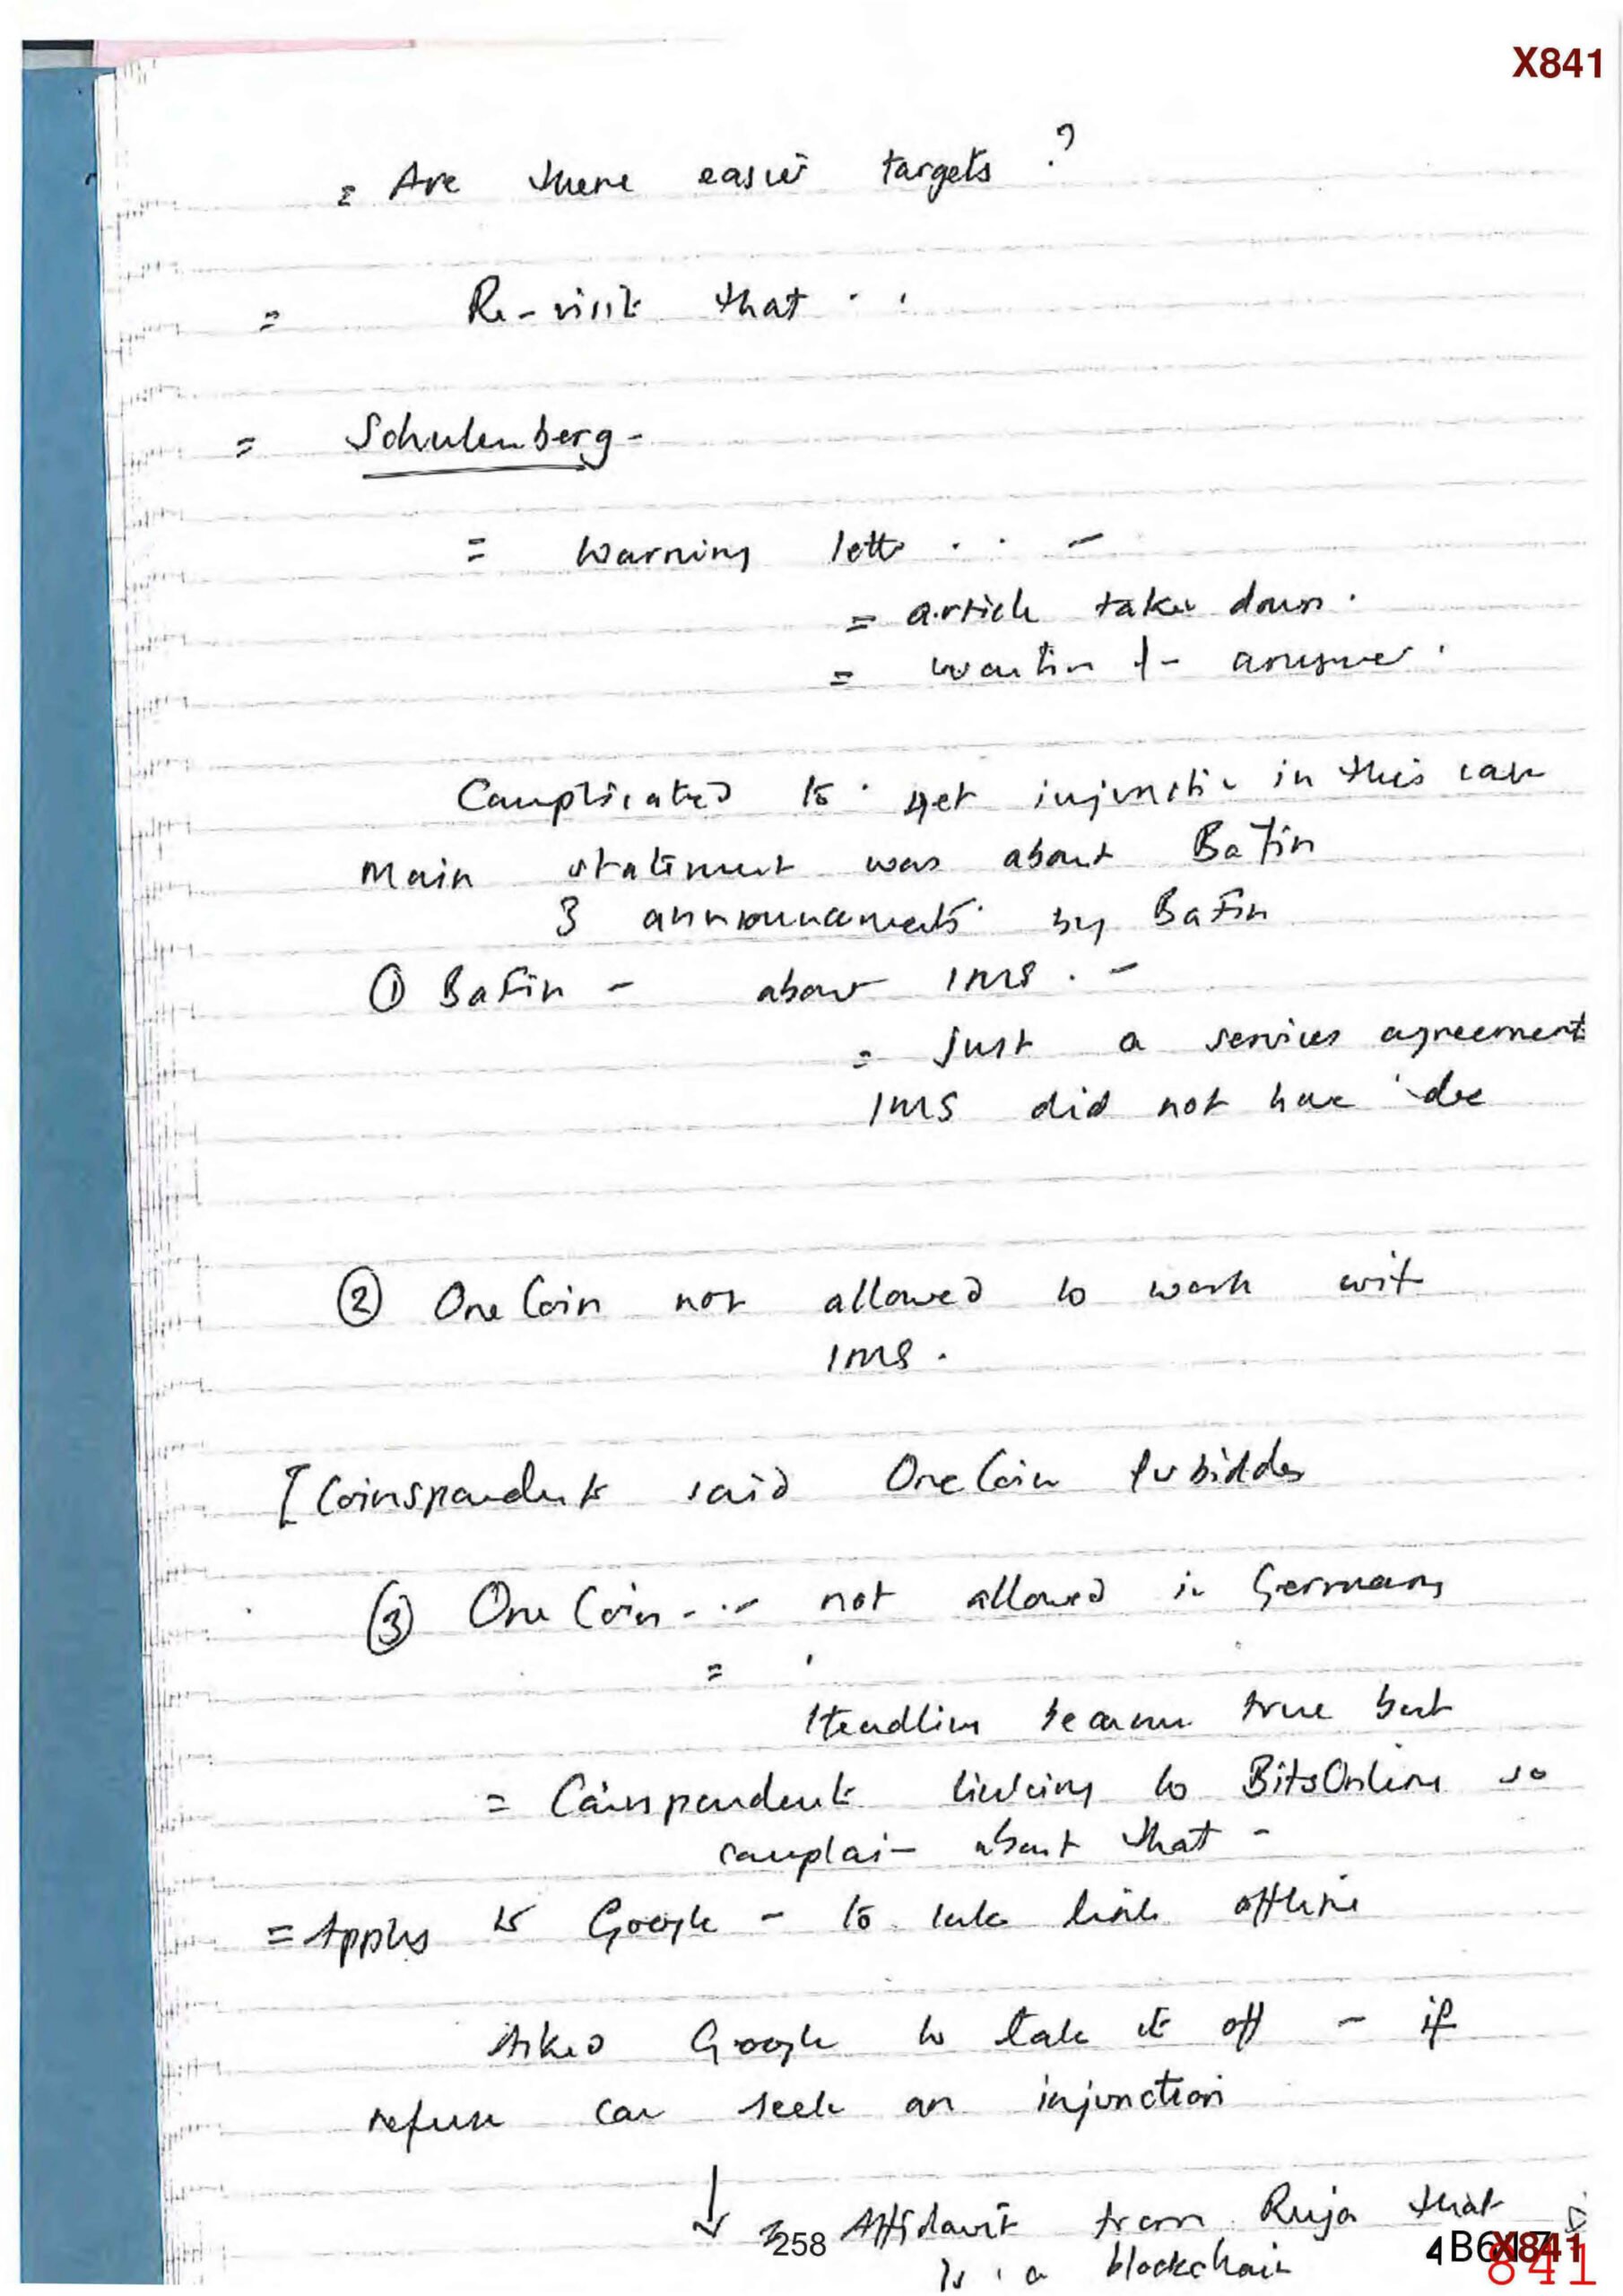
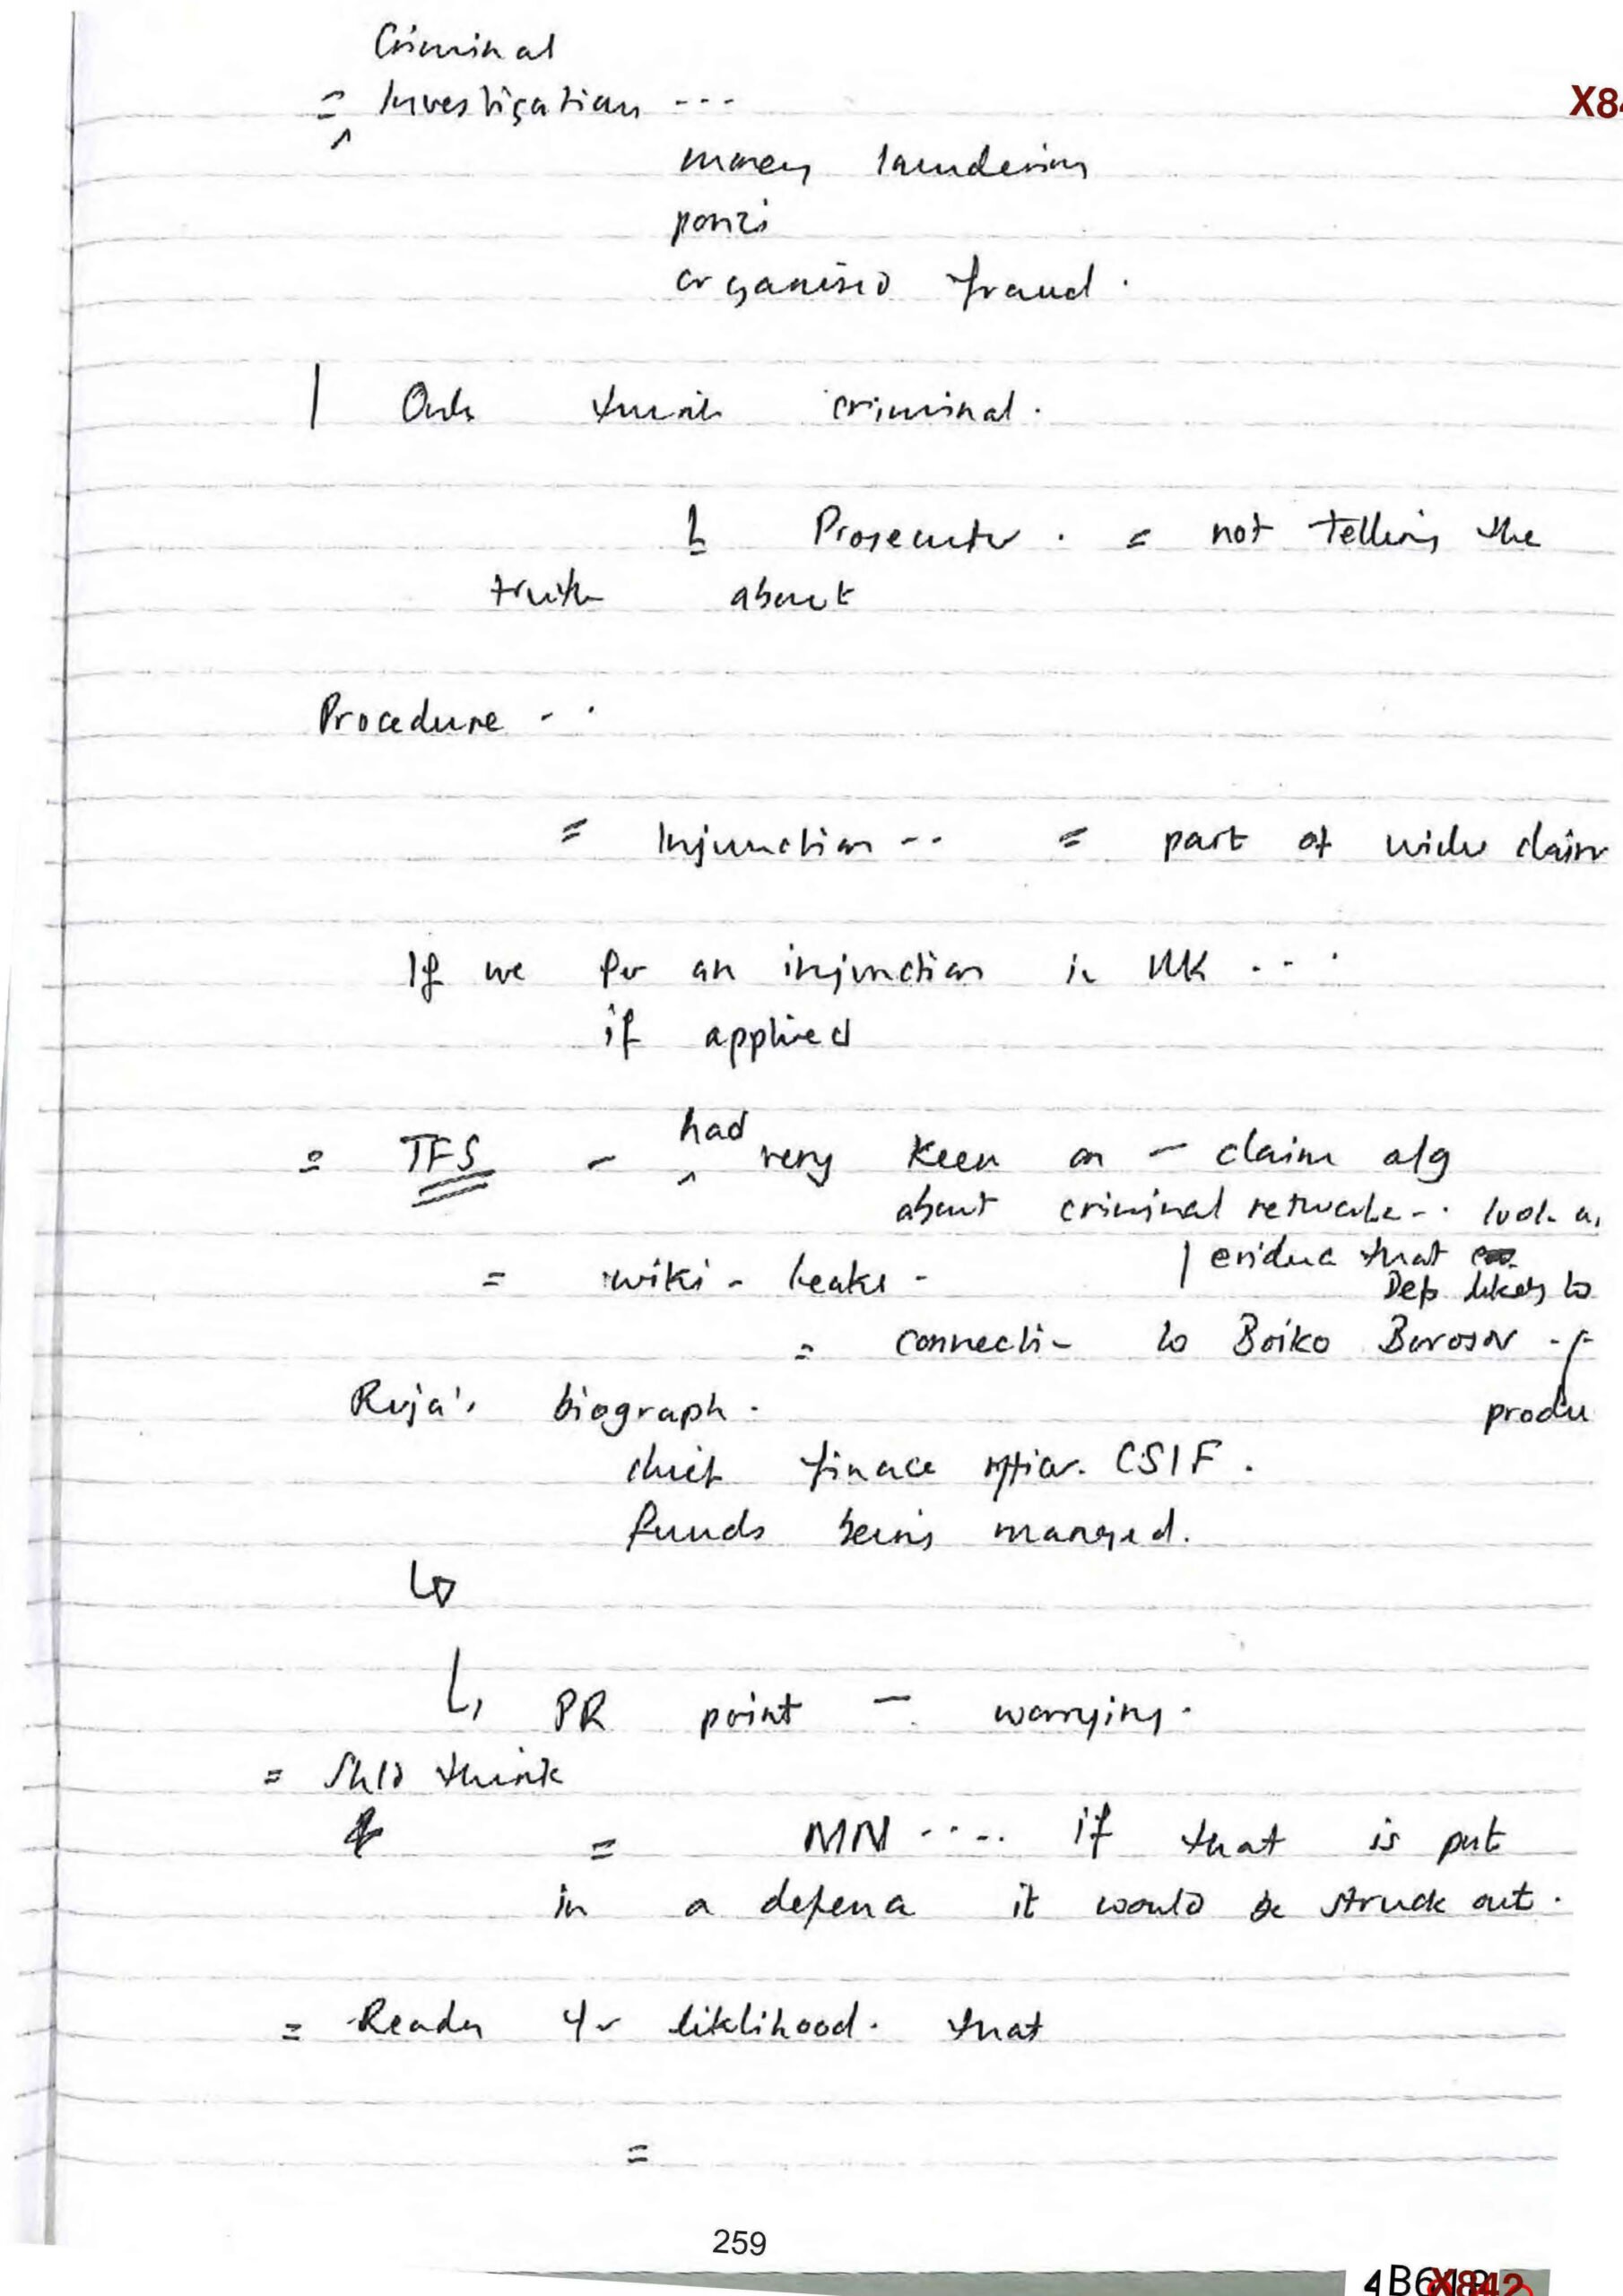
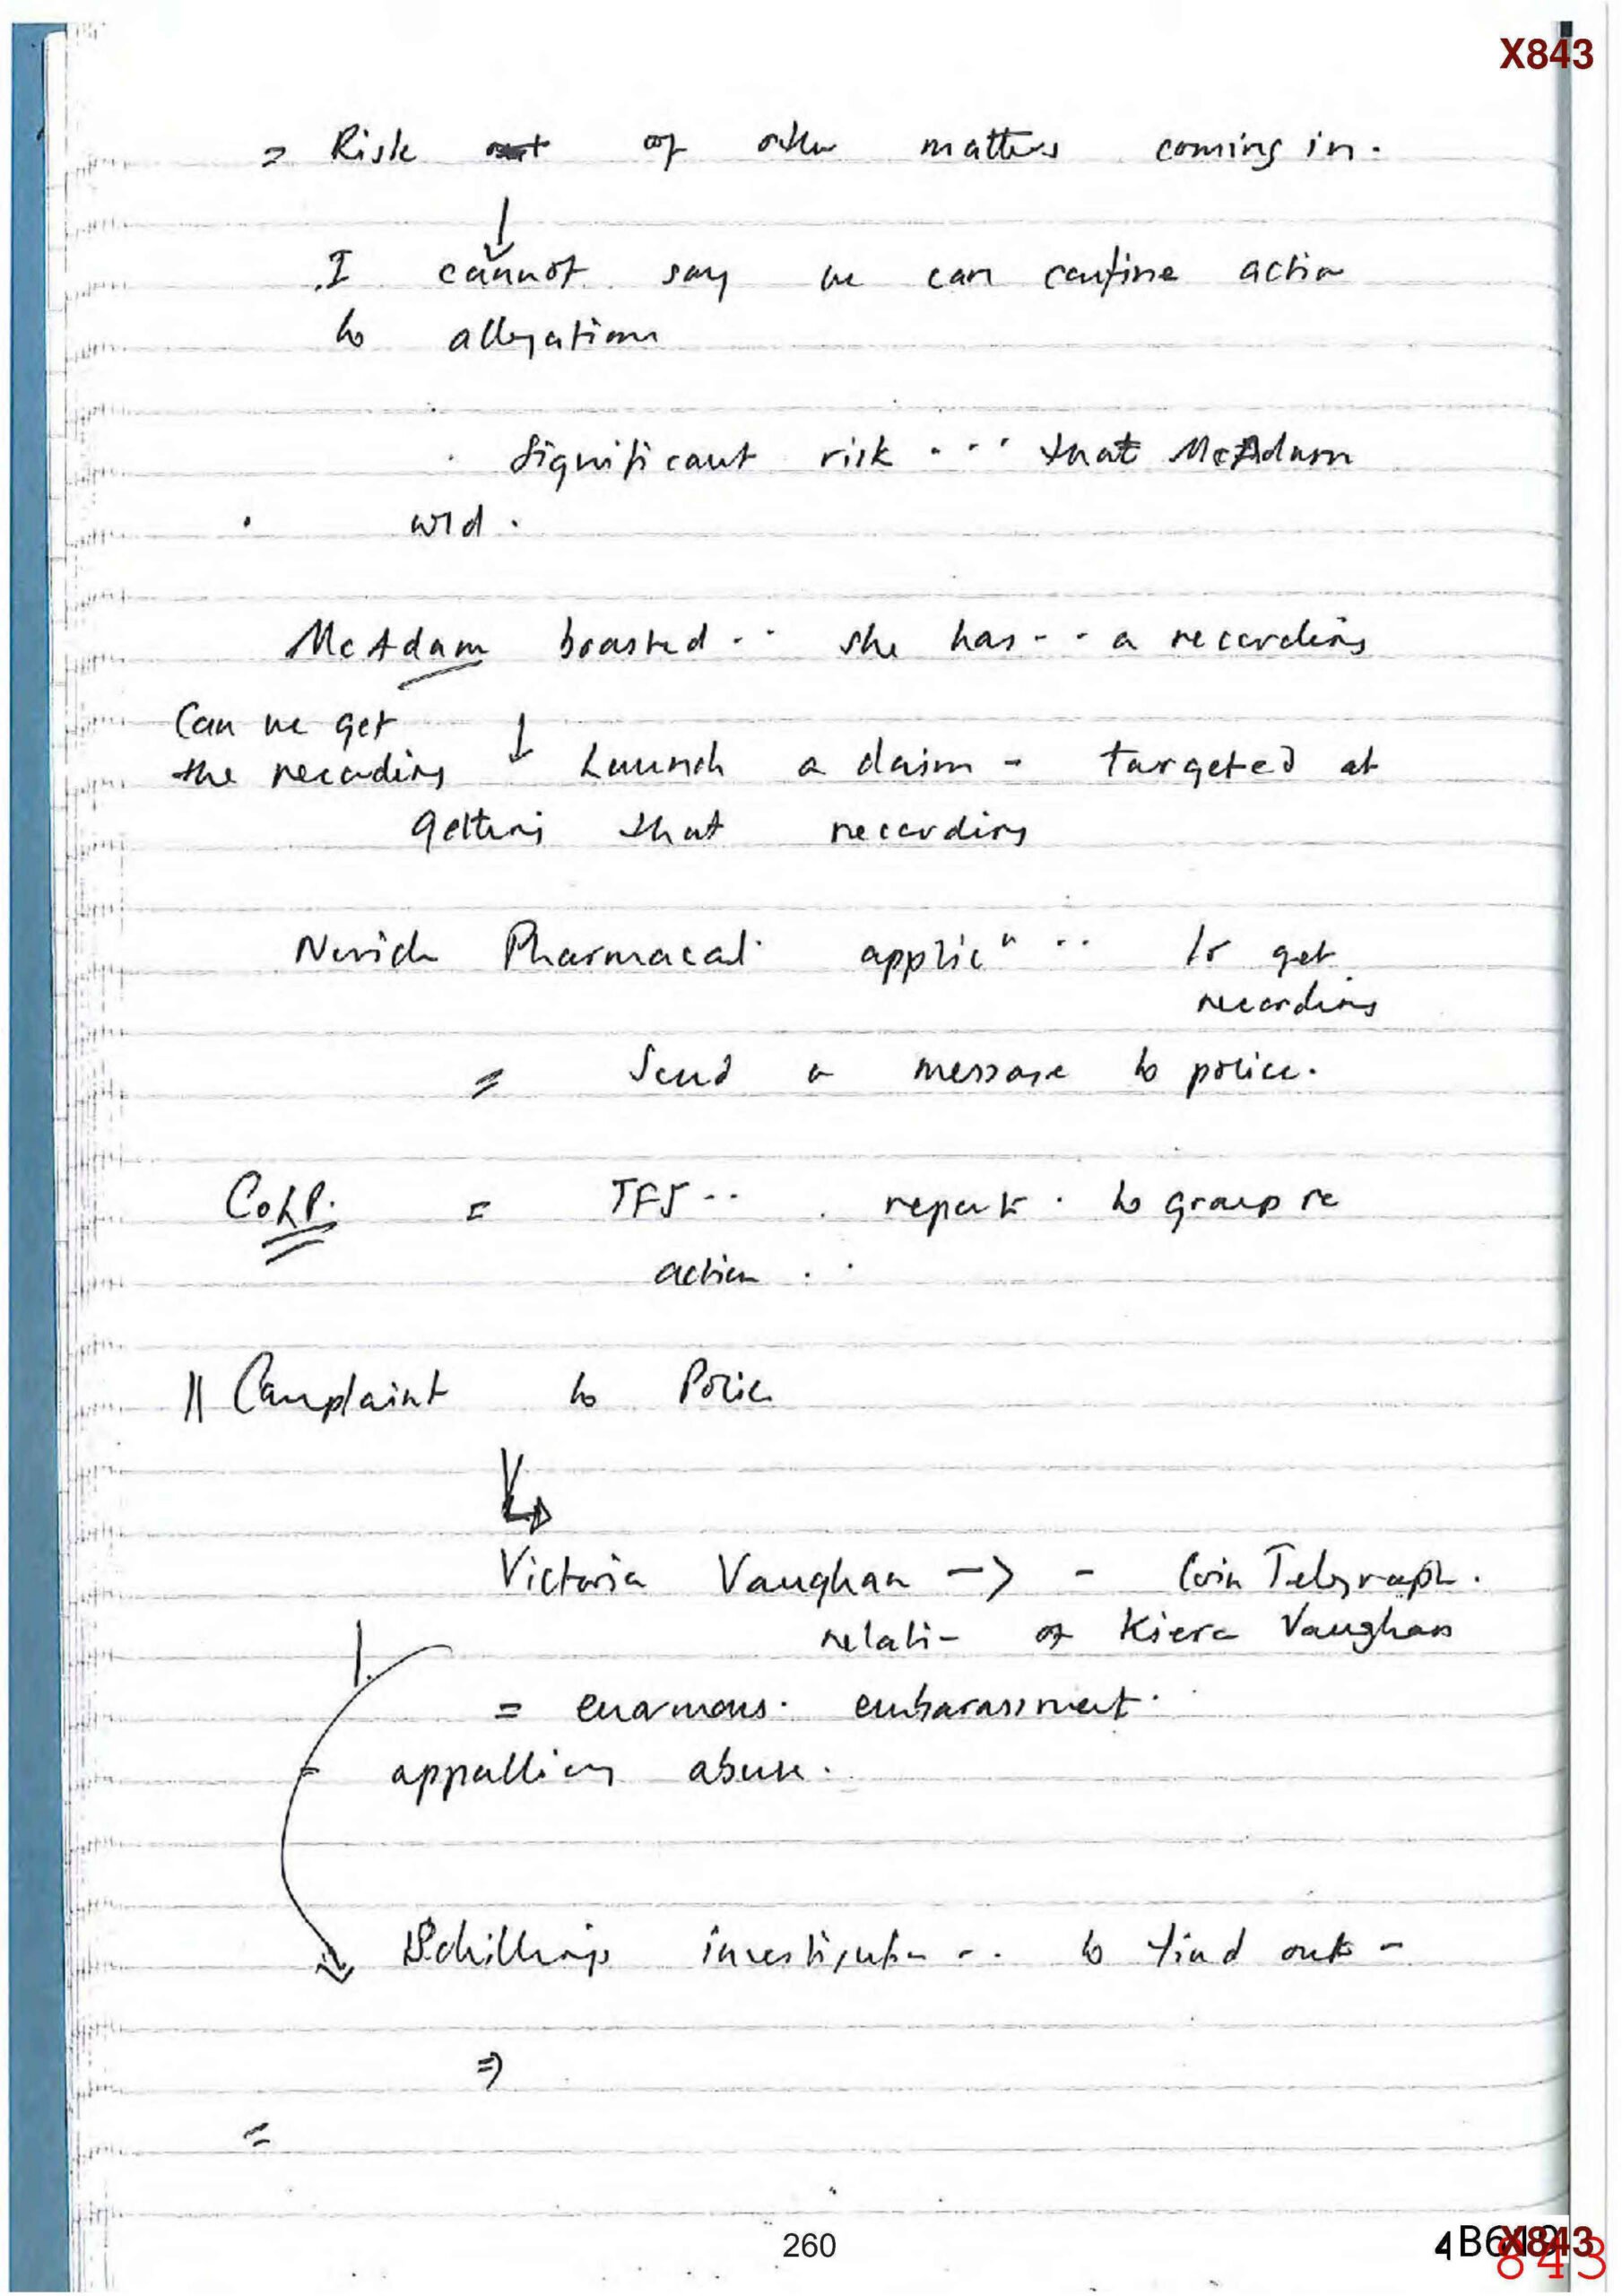
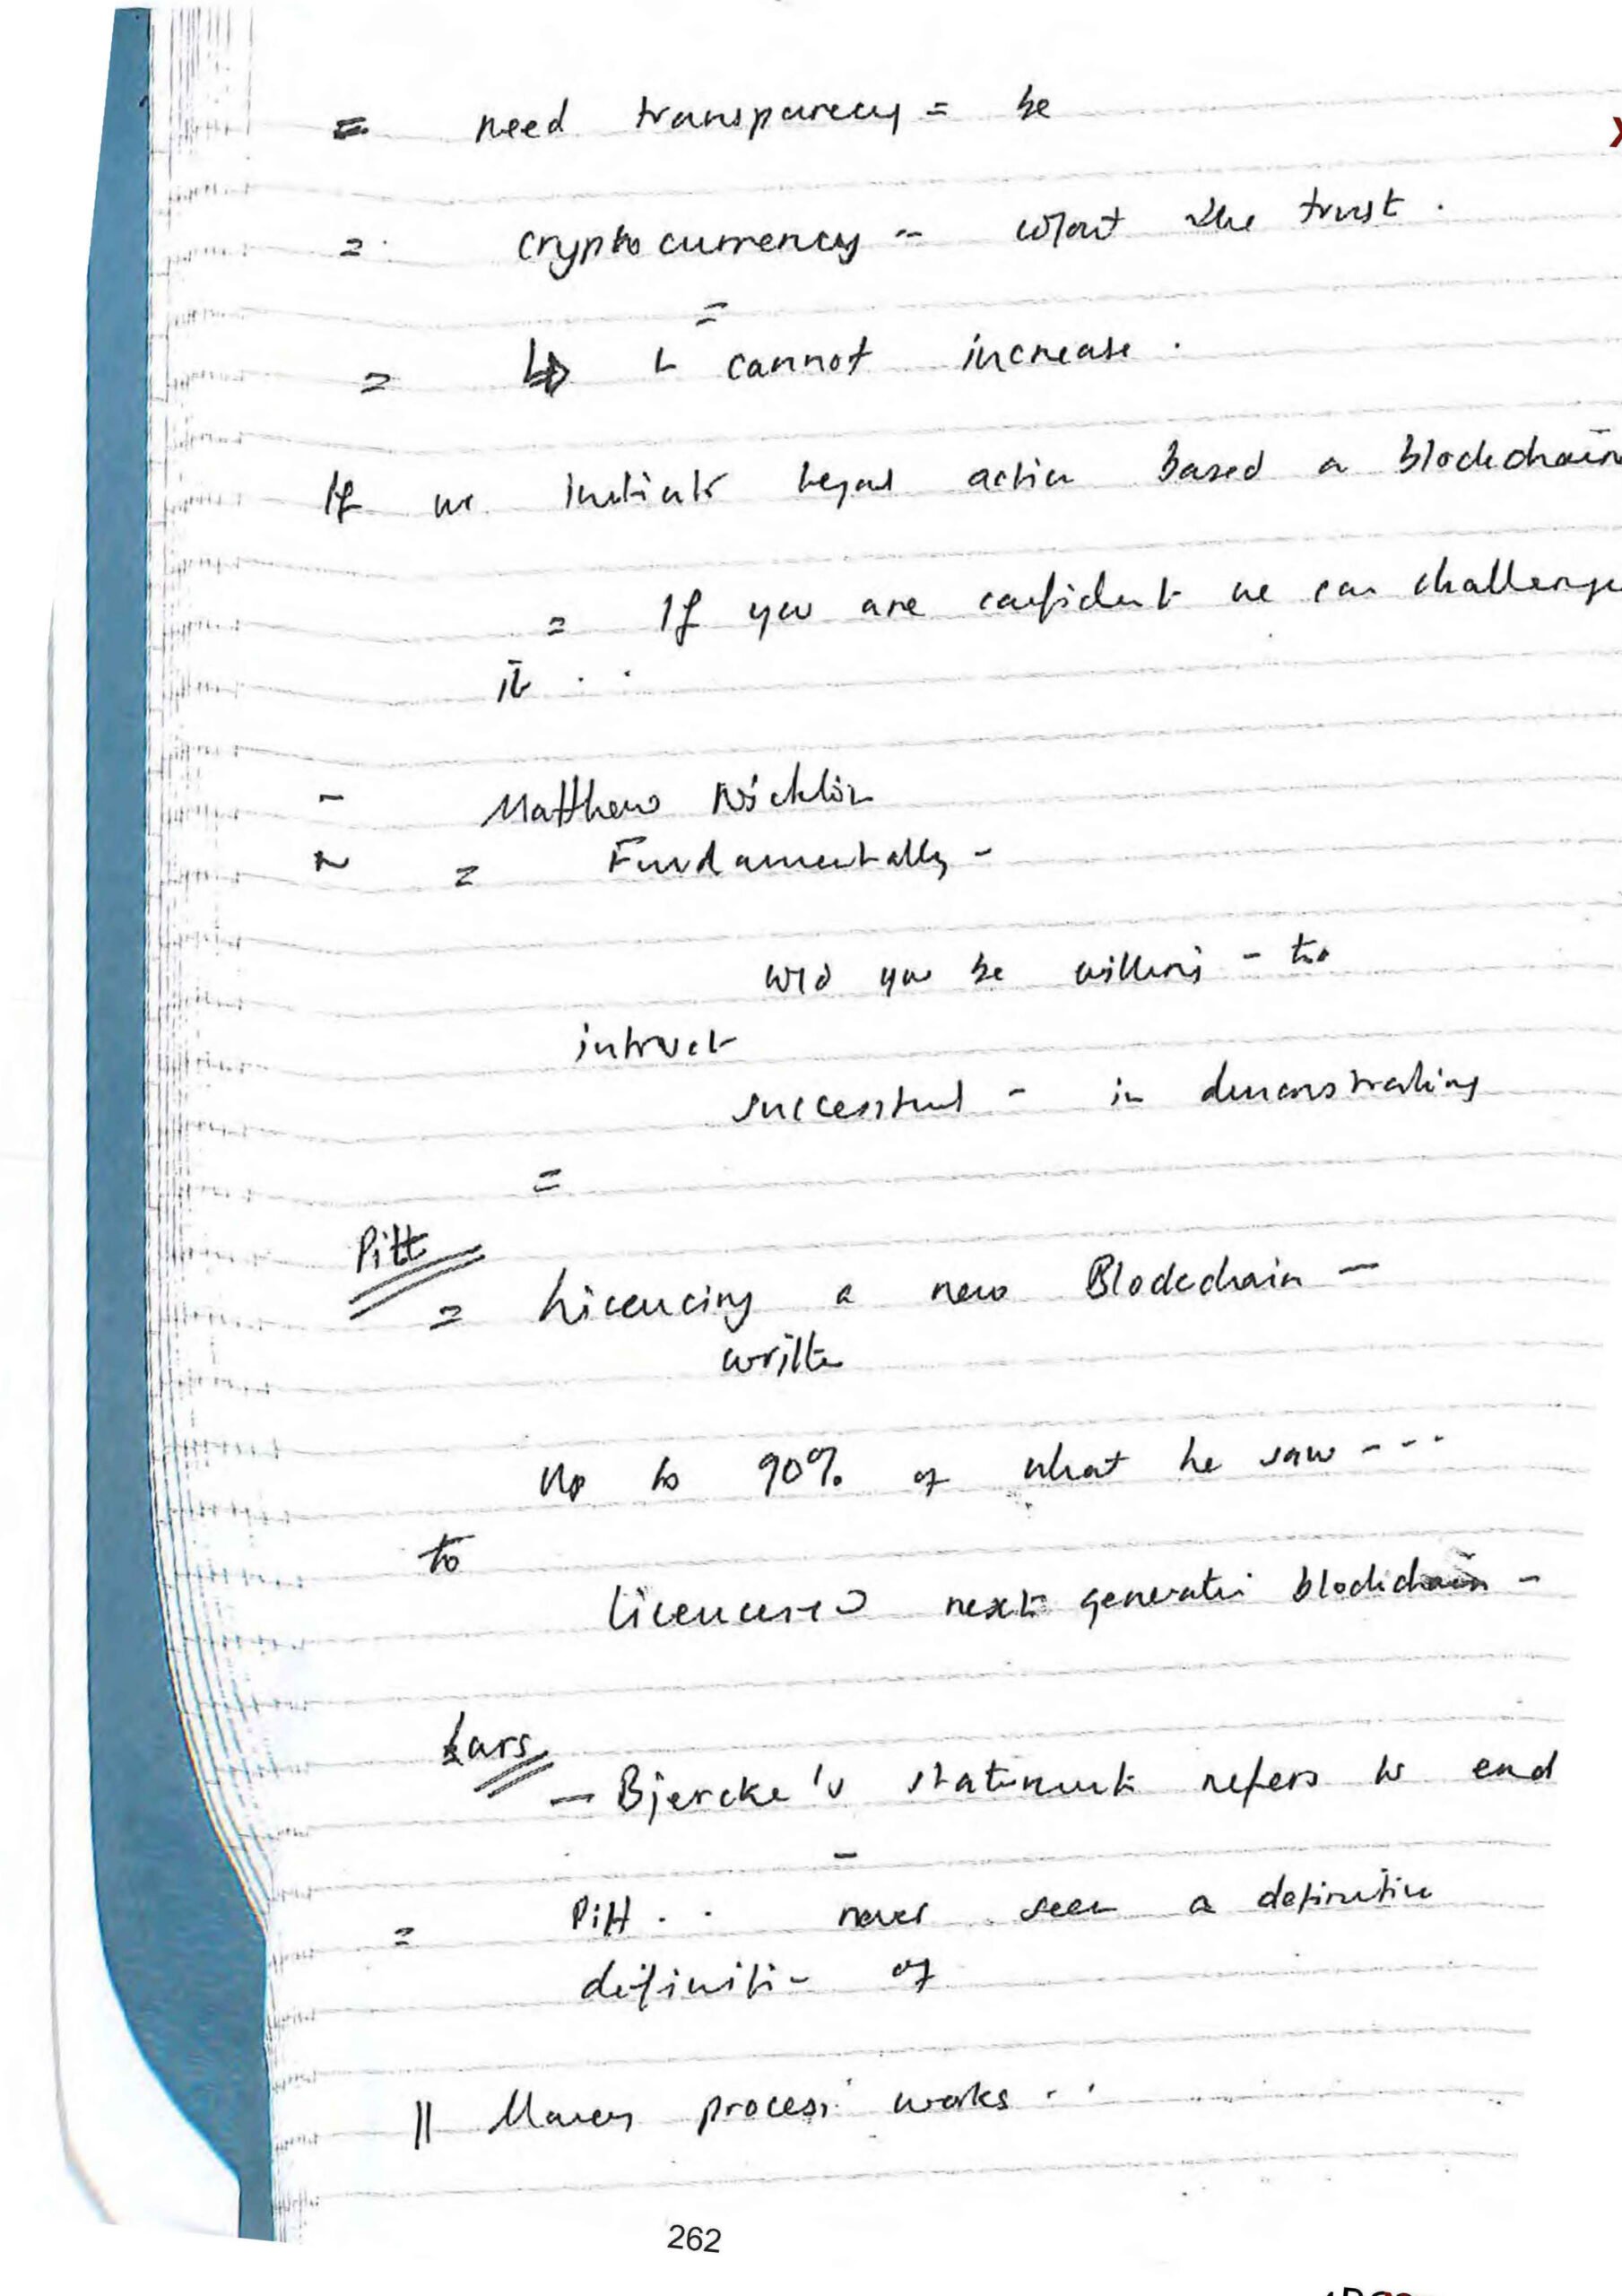
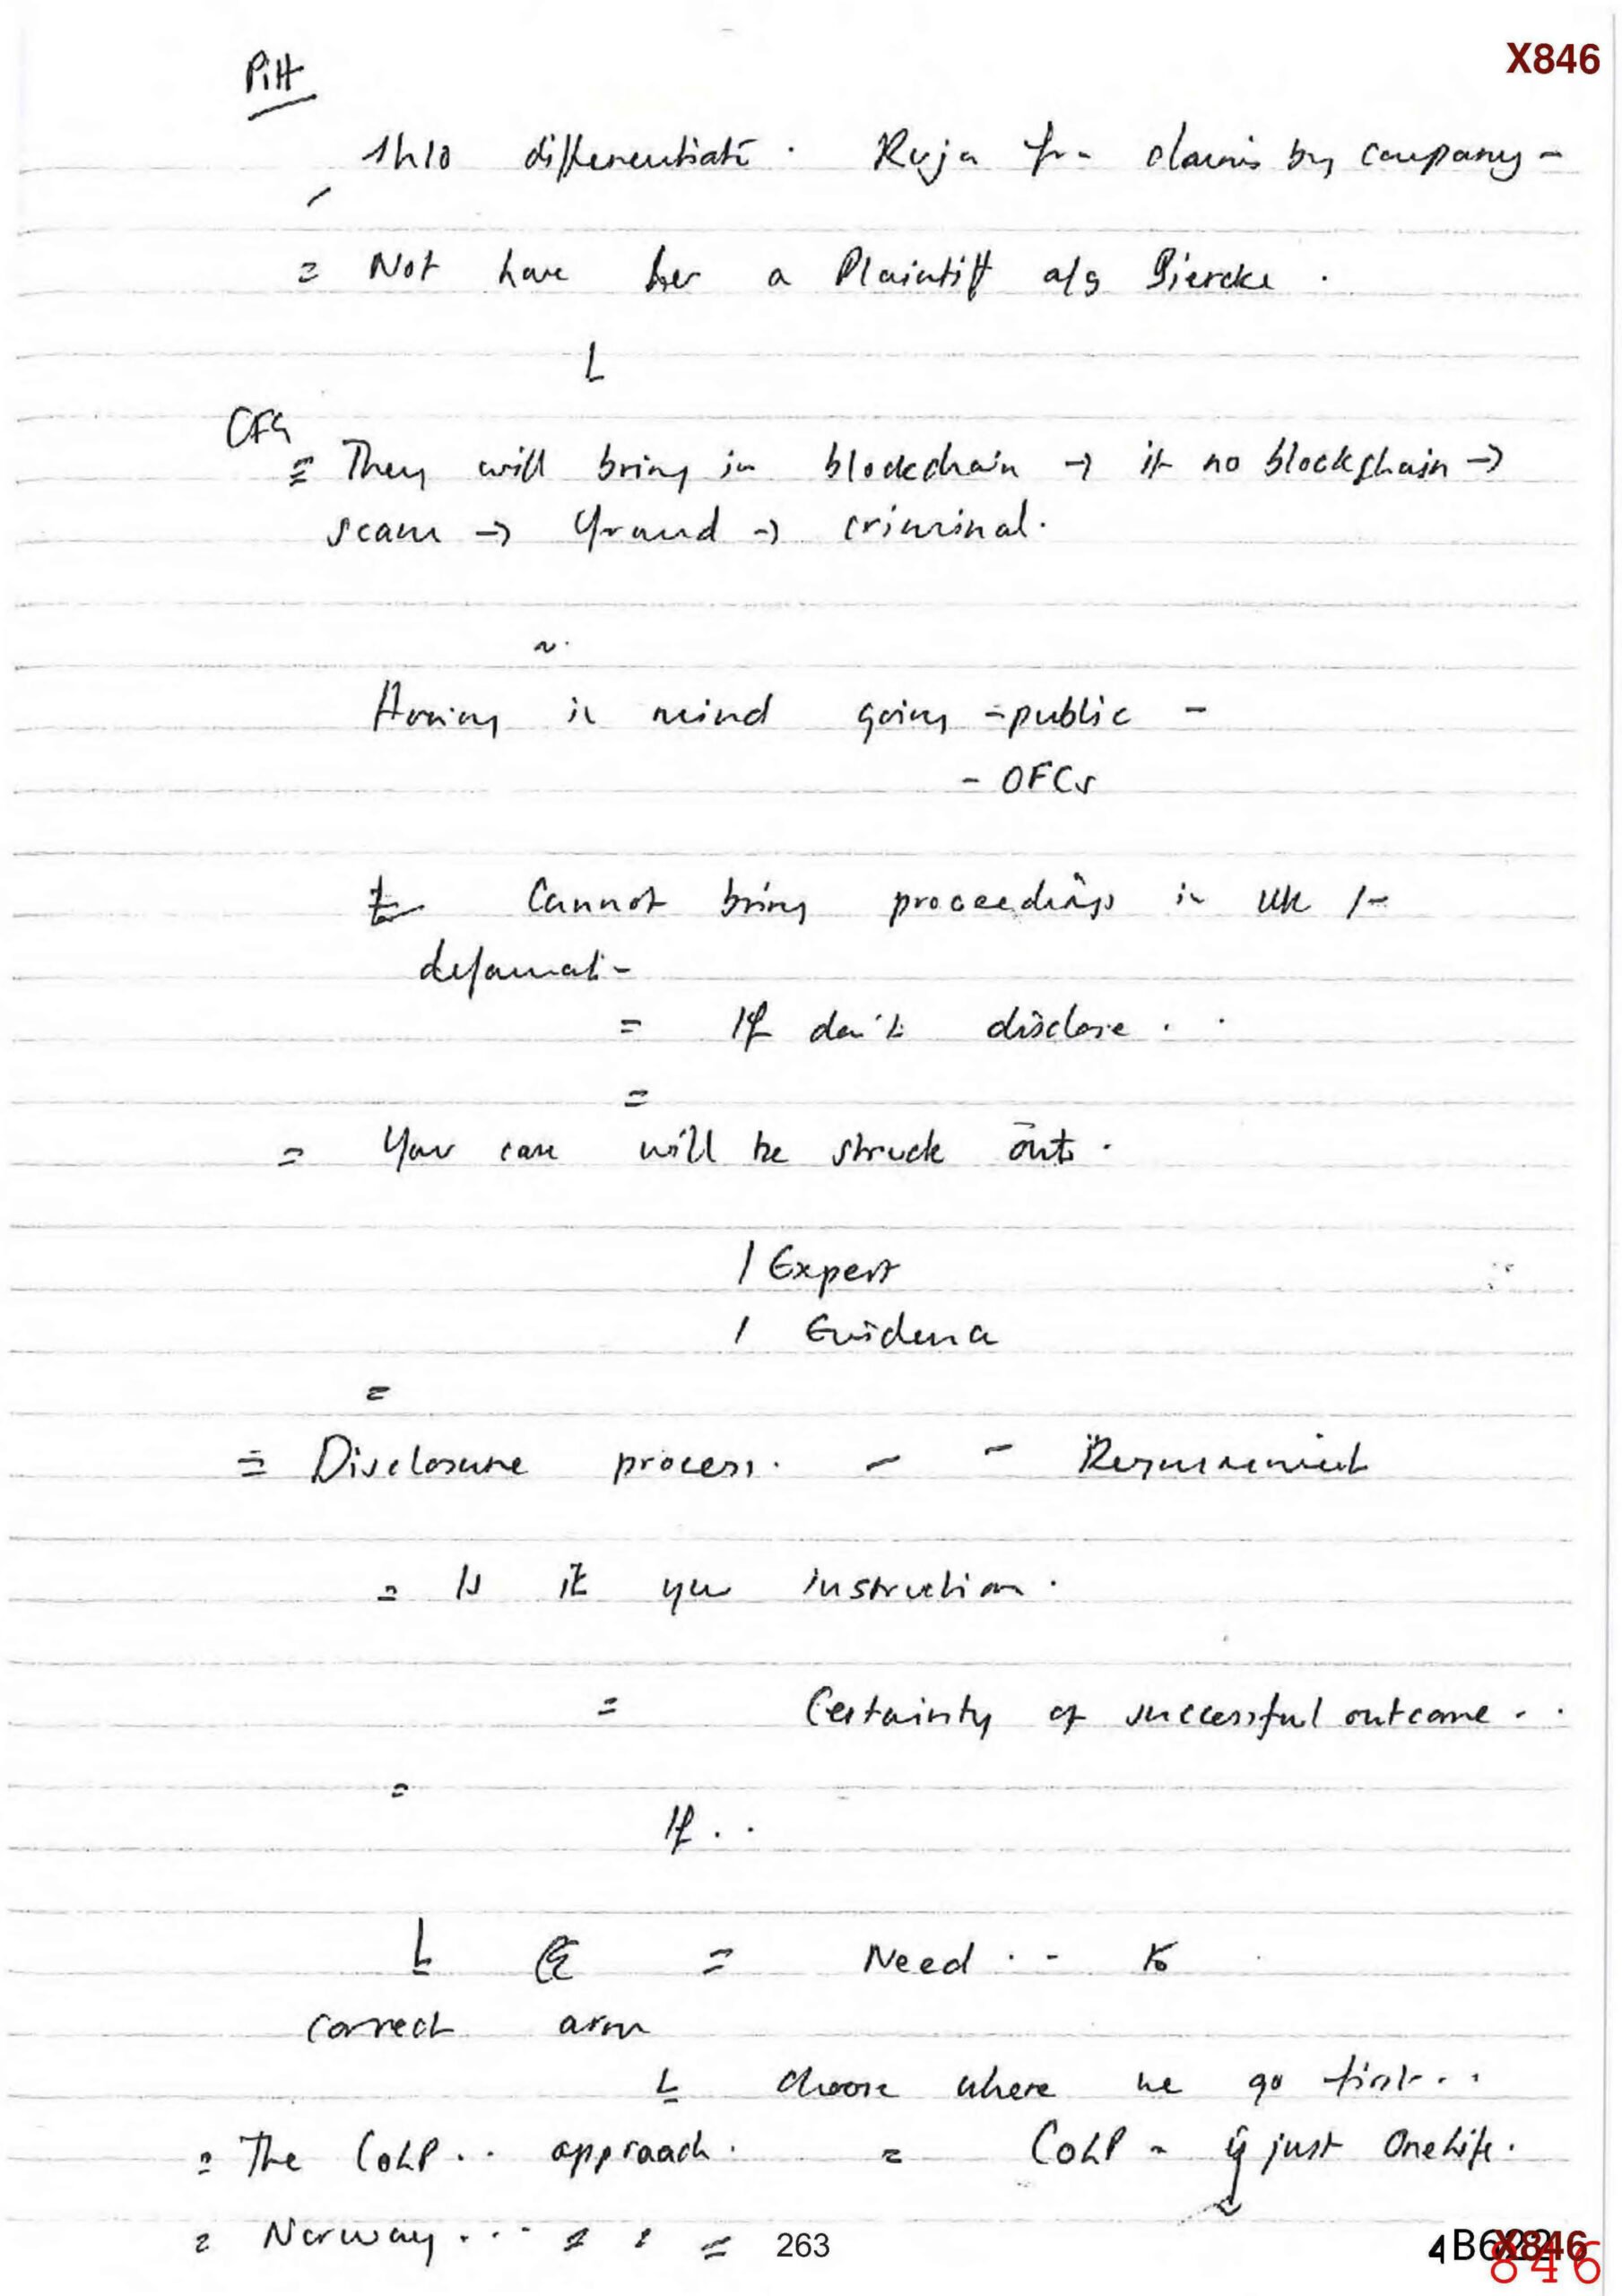
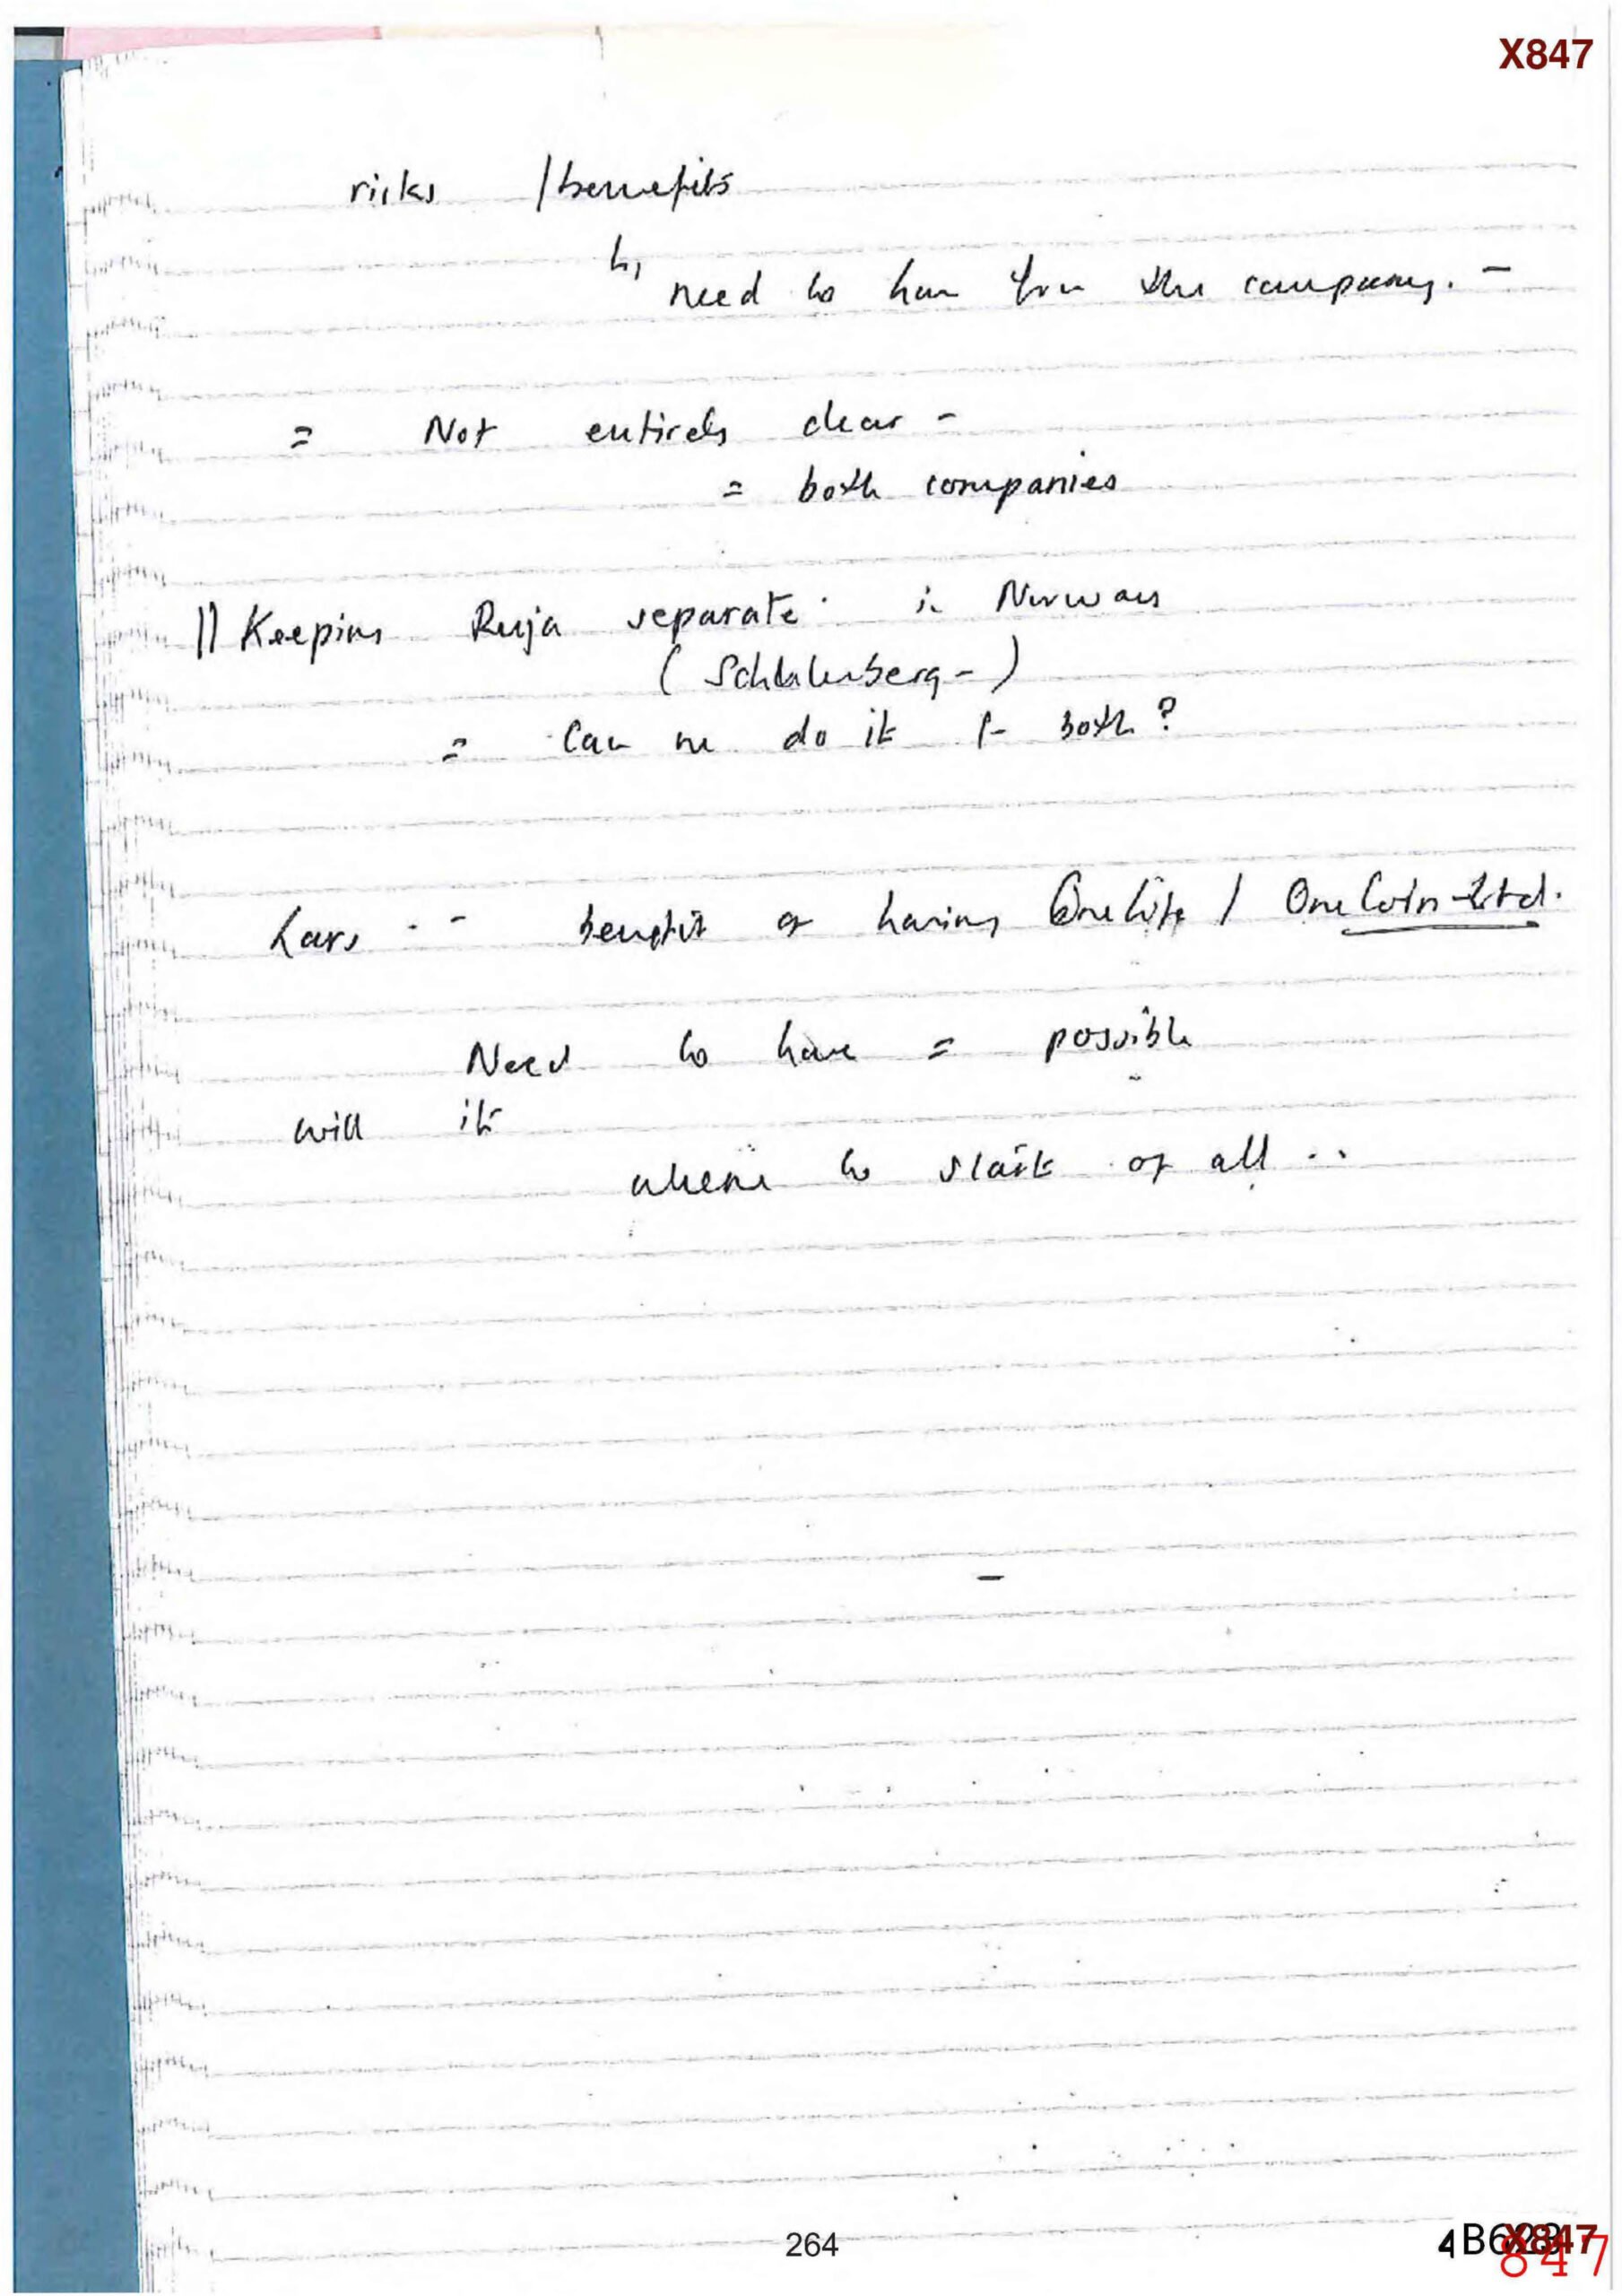
- Here are Ms Gill’s notes of an 11 May 2017 meeting:
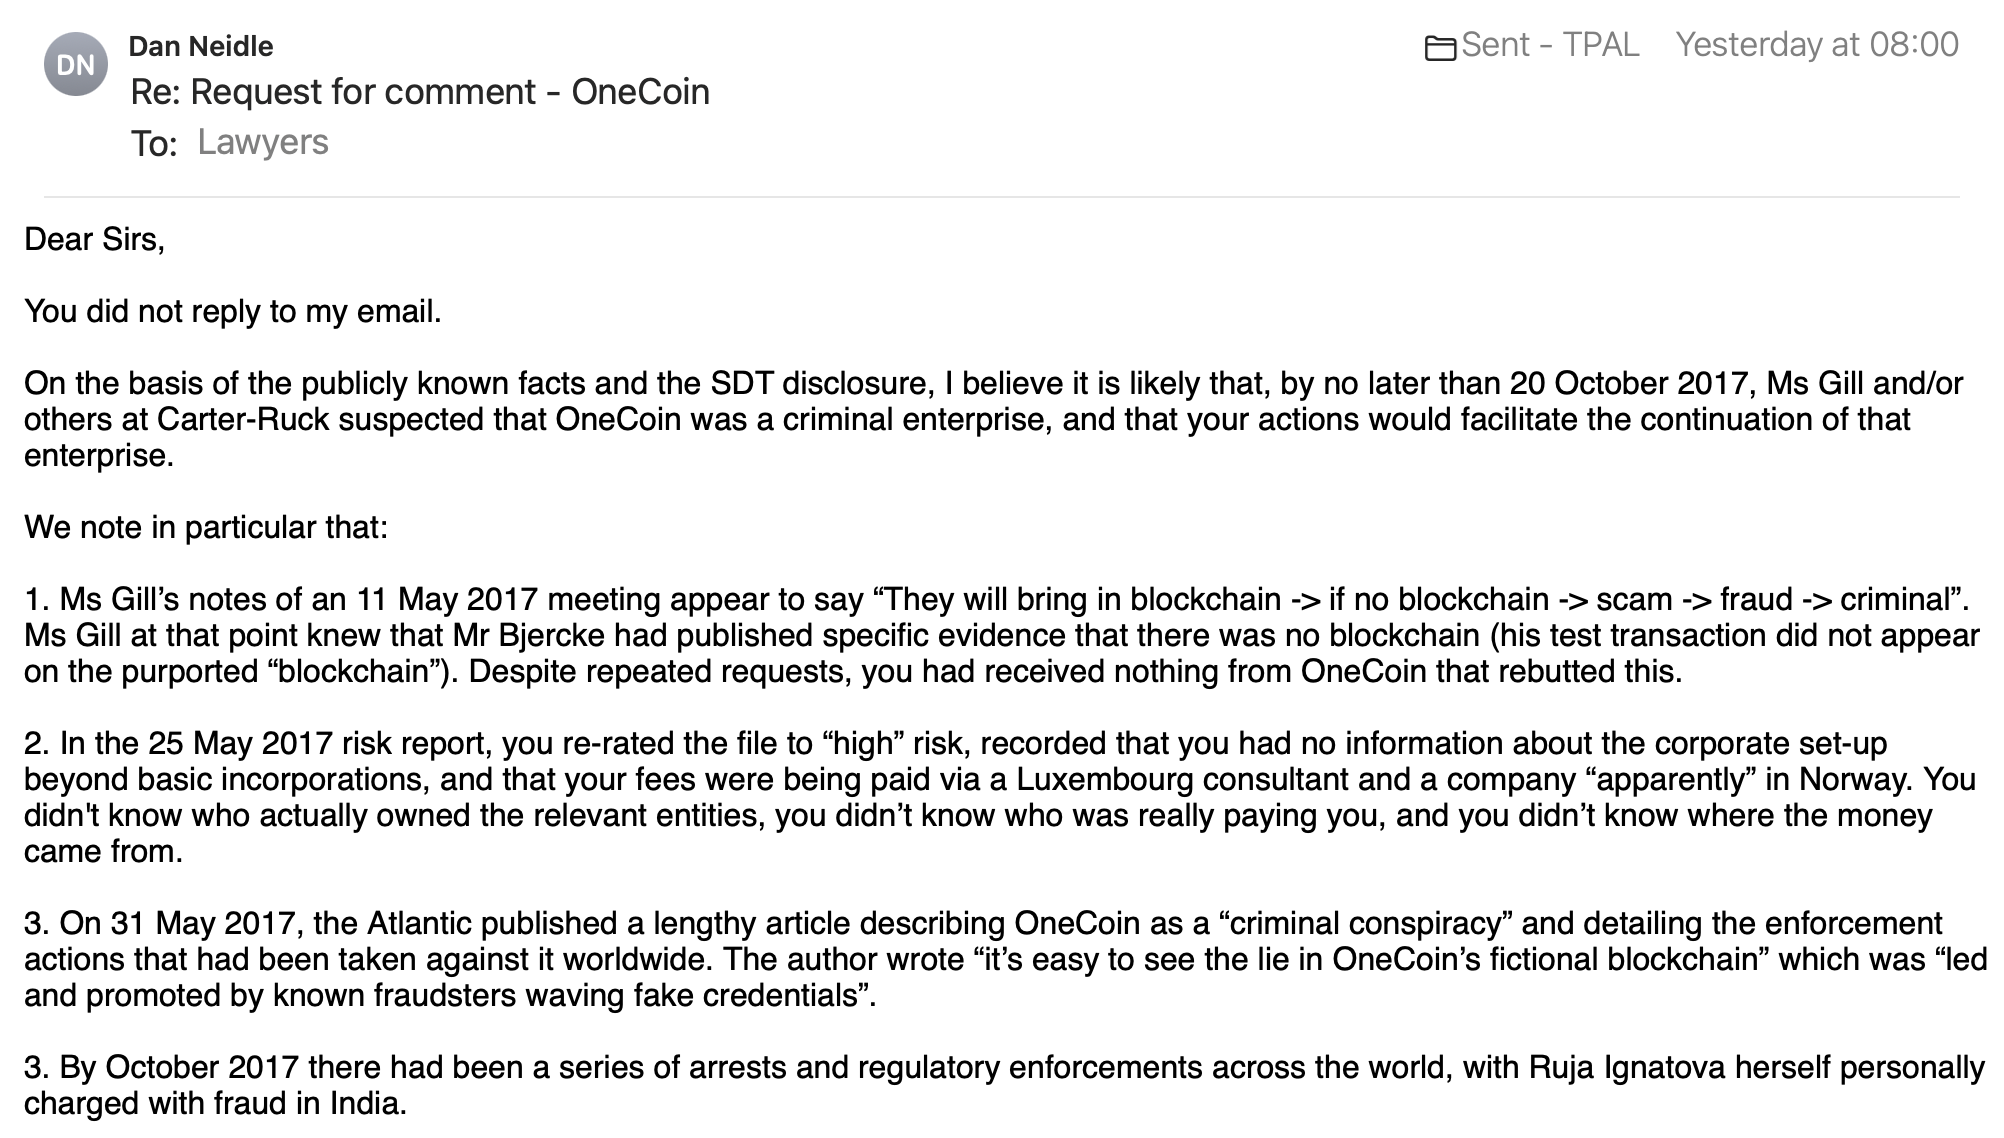
- The notes suggest (on page 2) that a missing blockchain is itself a crime, because it is a fraud. Then, on page 8, the notes appear to record Ms Gill saying “They will bring in blockchain -> if no blockchain -> scam -> fraud -> criminal”.
- Ms Gill at that point knew that the Norwegian blockchain expert, Bjørn Bjercke had published specific evidence that there was no blockchain (his test transaction did not appear on the purported “blockchain”). Despite repeated requests, Ms Gill had received nothing from OneCoin that rebutted this.
- So Ms Gill wrote (well after Mr Bjerke and Ms McAdam had been threatened with defamation claims) “We are not able to say what is false about the blockchain claims”.
- Soon after that meeting, on 31 May 2017, The Atlantic published a lengthy article describing OneCoin as a “criminal conspiracy” and detailing the enforcement actions that had been taken against it worldwide. The author wrote “it’s easy to see the lie in OneCoin’s fictional blockchain” which was “led and promoted by known fraudsters waving fake credentials”.
- By October 2017 there had been a series of arrests and regulatory enforcements across the world, with Ruja Ignatova herself personally charged with fraud in India.
- We now know that the City of London police had been investigating OneCoin for some time. In 2016, they warned a website not to promote OneCoin and advised a London venue not to host a OneCoin event. Carter-Ruck were certainly aware of this, because they wrote to the City of London police threatening libel proceedings and making a complaint to the Professional Standards Directorate. The police responded on 27 October 2017 in this very detailed letter from their solicitors, BLM. The letter says explicitly that police believed OneCoin to be fraudulent – that seems to be mainly based on information that was in the public domain, and that was available to Carter-Ruck.
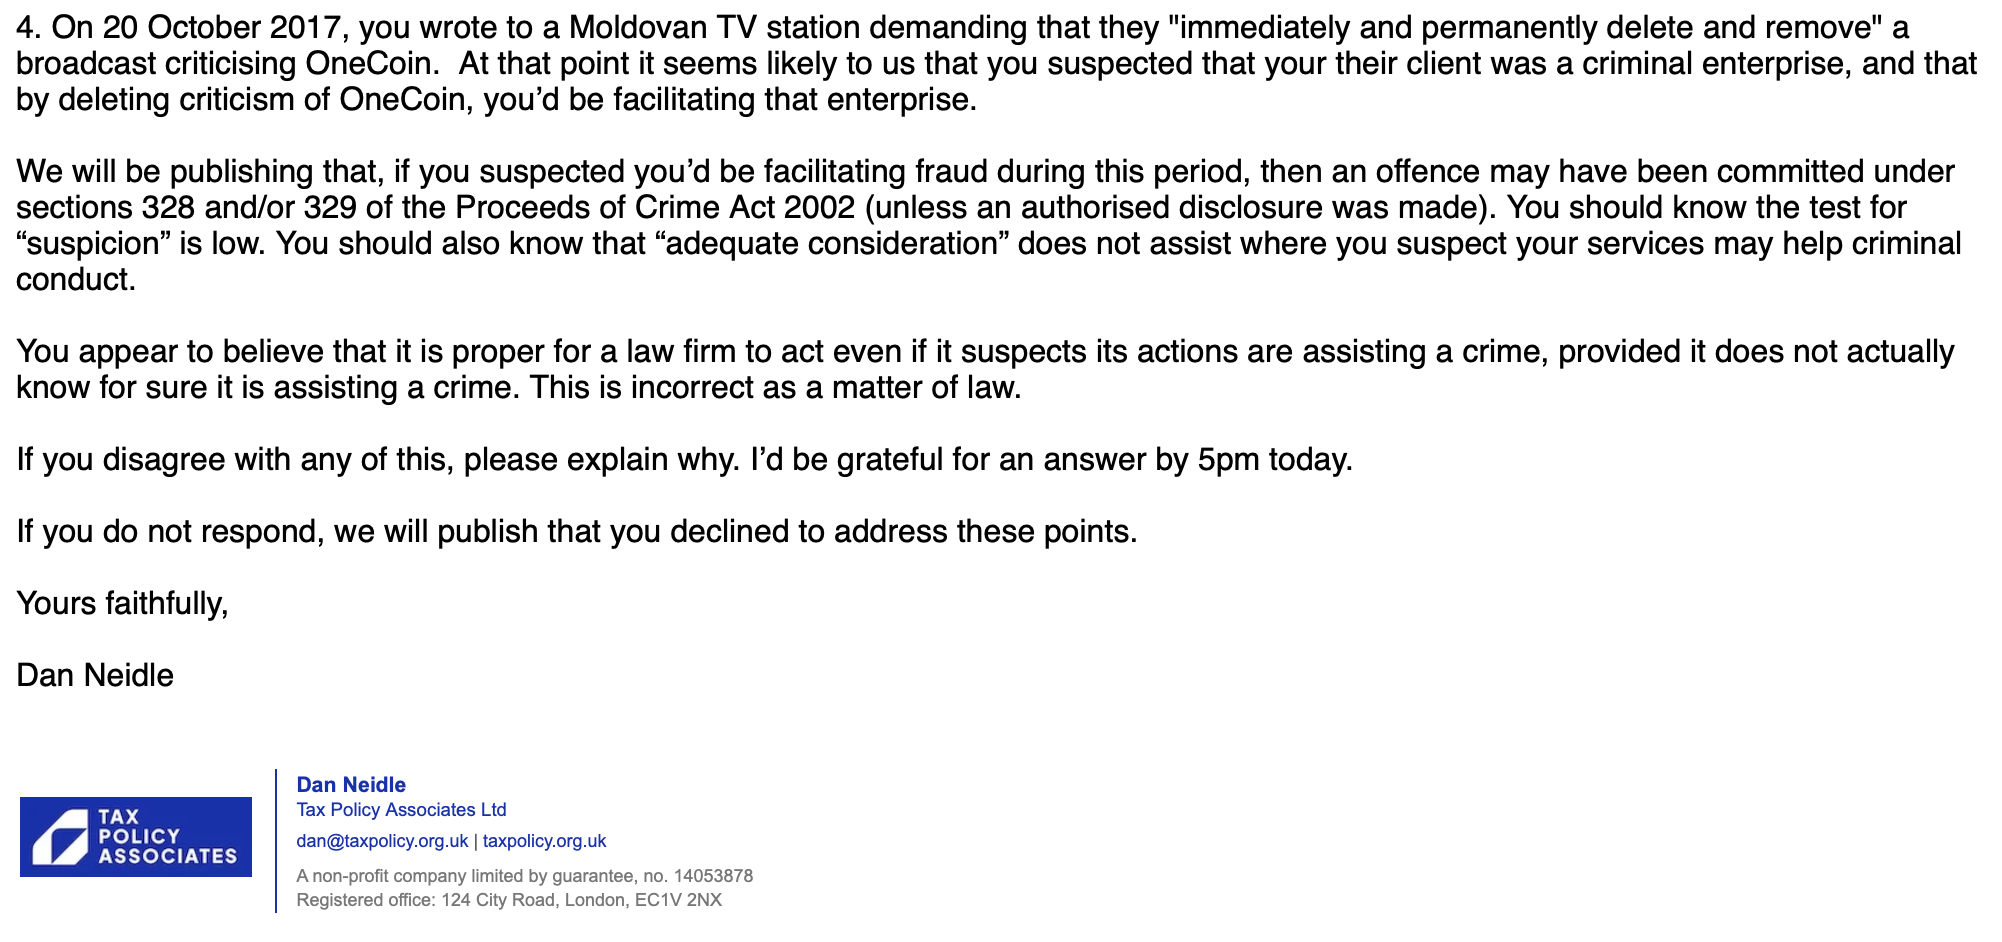
Carter-Ruck’s last material act for OneCoin was when, on 20 October 2017, they wrote to a Moldovan TV station demanding that they “immediately and permanently delete and remove” a broadcast criticising OneCoin. They were successful – the broadcast was deleted.
The critical question is, therefore: at 20 October 2017 did Carter-Ruck “suspect” that their client was a criminal enterprise, and that by deleting criticism of OneCoin, they’d be helping/facilitating that enterprise?
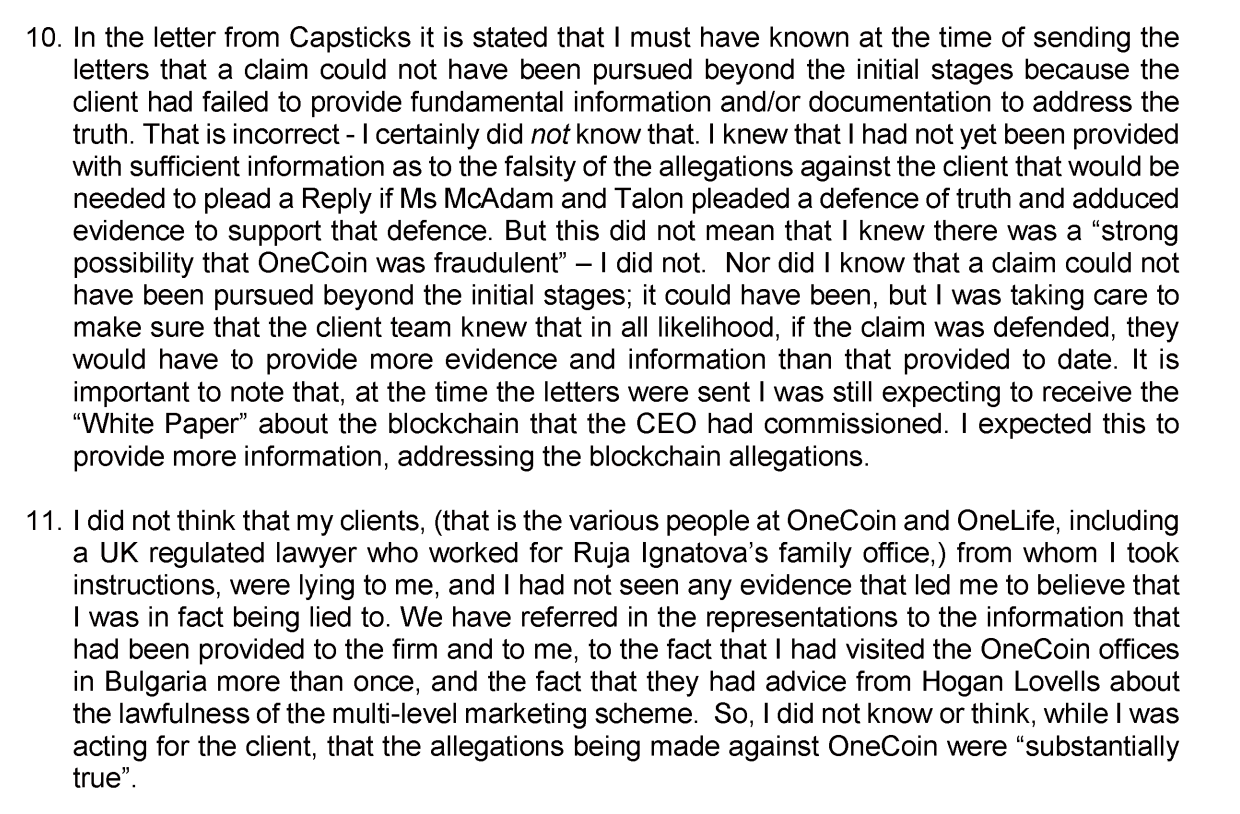
The SRA themselves appear to believe that Ms Gill suspected OneCoin was fraudulent – their lawyers, Capsticks, wrote on 11 April 2025 that Ms Gill “must have known there was a strong possibility that OneCoin was fraudulent”.
Claire Gill denies she knew there was a strong possibility that OneCoin was fraudulent – this is from a response to the SRA:
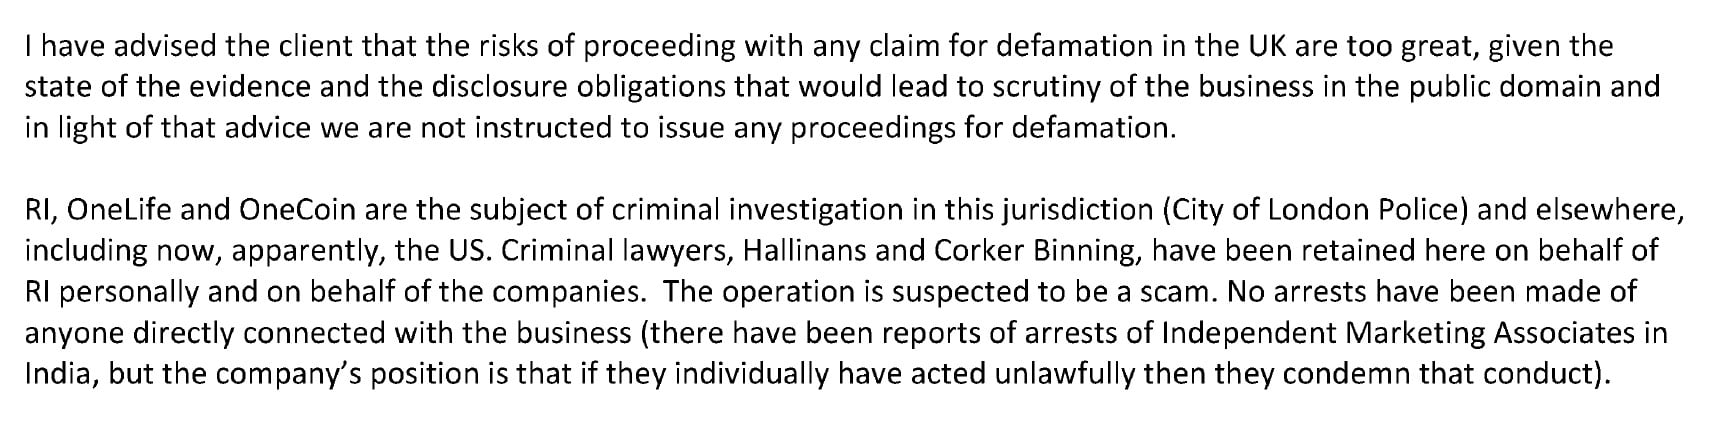
However, looking at Ms Gill’s 25 May 2017 risk report, it is hard see how she could not have suspected:
It is not clear to us from this whether Ms Gill suspected her client was fraudulent or not.
Carter-Ruck say in their SDT defence that Ms Gill didn’t believe that OneCoin was fraudulent, and that “even if she had any suspicion” that her client was a fraud, she was entitled (and indeed under a duty) to continue to act for them.
These responses, and Carter-Ruck’s own contemporaneous risk report, miss the critical point: that if Ms Gill did suspect OneCoin was a fraud, and that she was helping/facilitating that fraud, then she may have committed a criminal offence.
In our view, a competent lawyer would have suspected that OneCoin was carrying out a fraud.
Holding Carter-Ruck to account
Defamation lawyers should be subject to AML regulation
There is a gap in the law. Defamation solicitors frequently act for people suspected of criminality, and their actions (if successful) will often assist that criminality, but defamation solicitors aren’t subject to anti-money laundering rules.
That should change.
Everyone accused of a crime is entitled to legal representation in their defence. But someone accused of an ongoing crime is not entitled to instruct lawyers to facilitate the continuation of that crime. Most law firms (regulated or not) screen their clients carefully so they don’t ever find themselves in that position. Carter-Ruck apparently do not – and they’re not alone. Self-regulation has failed.
And it’s also unacceptable that defamation solicitors can act for a company without knowing who owns it. In our view there is a material risk that Carter-Ruck’s clients could be controlled by criminals, sanctioned individuals, money-launderers or terrorists. On the evidence of the OneCoin documents we reviewed, Carter-Ruck makes no attempt to check, and the firm appears to believe they have no obligation to check.
There is an obvious solution: the money laundering regulations should be amended to include advising in relation to and conducting defamation litigation. This doesn’t require primary legislation – the relevant Minister is empowered to make regulations amending the rules.
The potential breach of POCA should be investigated
The National Crime Agency should consider whether the evidence justifies prosecuting Carter-Ruck for a breach of the Proceeds of Crime Act (unless in fact appropriate DAML SARs were filed). POCA offences are often hard to prosecute against lawyers because of legal privilege; however (as the SDT has already ruled) few or none of the key documents are privileged.
Any such prosecution would set a new precedent on the scope of a solicitor’s duties under POCA when representing clients involved in an ongoing fraud. That would be a good thing.
Alternatively, or in addition, the NCA should consider whether the evidence justifies bringing civil recovery proceedings against Carter-Ruck under Part 5 of the Proceeds of Crime Act. Those provisions apply to property derived from “unlawful conduct” – a definition that may capture Carter-Ruck’s fees. The court could order recovery unless the firm can demonstrate it acted in good faith and without notice that the money was criminal. If Carter-Ruck suspected OneCoin was a fraud, that could prove a challenging case for Carter-Ruck to make.
Whether or not the NCA act, a breach of POCA is a breach of the SRA Code of Conduct (as is any criminal offence committed by a solicitor). The SRA should considering adding an additional charge to their prosecution of Ms Gill.
Carter-Ruck’s response
Carter-Ruck’s defence relies heavily on an opinion by Timothy Dutton KC obtained by Carter-Ruck which says that AML-unregulated solicitors have no due diligence obligations, and are required to act even if a client’s position is factually not credible.
Mr Dutton is unable to identify (in paragraph 44.1) a difference in principle between a solicitor in a SLAPP case and a criminal defence solicitor. This shows a remarkable failure of imagination. The correct comparison is not with someone defending a bank robber after the event – it’s with a solicitor threatening witnesses with defamation claims if they report that a robbery is happening. A criminal defence solicitor is not facilitating an ongoing crime, but a solicitor in Carter-Ruck’s position is (and was).
Mr Dutton’s opinion also fails to address the Proceeds of Crime Act. A breach of POCA, as with any other criminal offence, is a breach of the SRA Code of Conduct. That is the case regardless of whether or not the breach is prosecuted.
We expect Mr Dutton’s opinion reflects his instructions from Carter-Ruck. The document illustrates a familiar truth – that a KC’s opinion commissioned by a party with a particular interest is valuable chiefly as advocacy, not as analysis.
Carter-Ruck’s position seems to be that a lawyer can facilitate conduct they suspect is illegal, as long as they don’t know it’s illegal. That is an extreme position, and one that’s contrary to accepted legal norms.
Carter-Ruck also claim to have relied on advice from Hogan Lovells that OneCoin was not a pyramid scheme. That is no defence at all. OneCoin was a fraud, and that is not something which the Hogan Lovells opinion considers (or could have considered). As Richard Moorhead has written, the stated reliance is merely a way of avoiding responsibility. We will be writing further about the Hogan Lovell opinion.
Our correspondence with Carter-Ruck
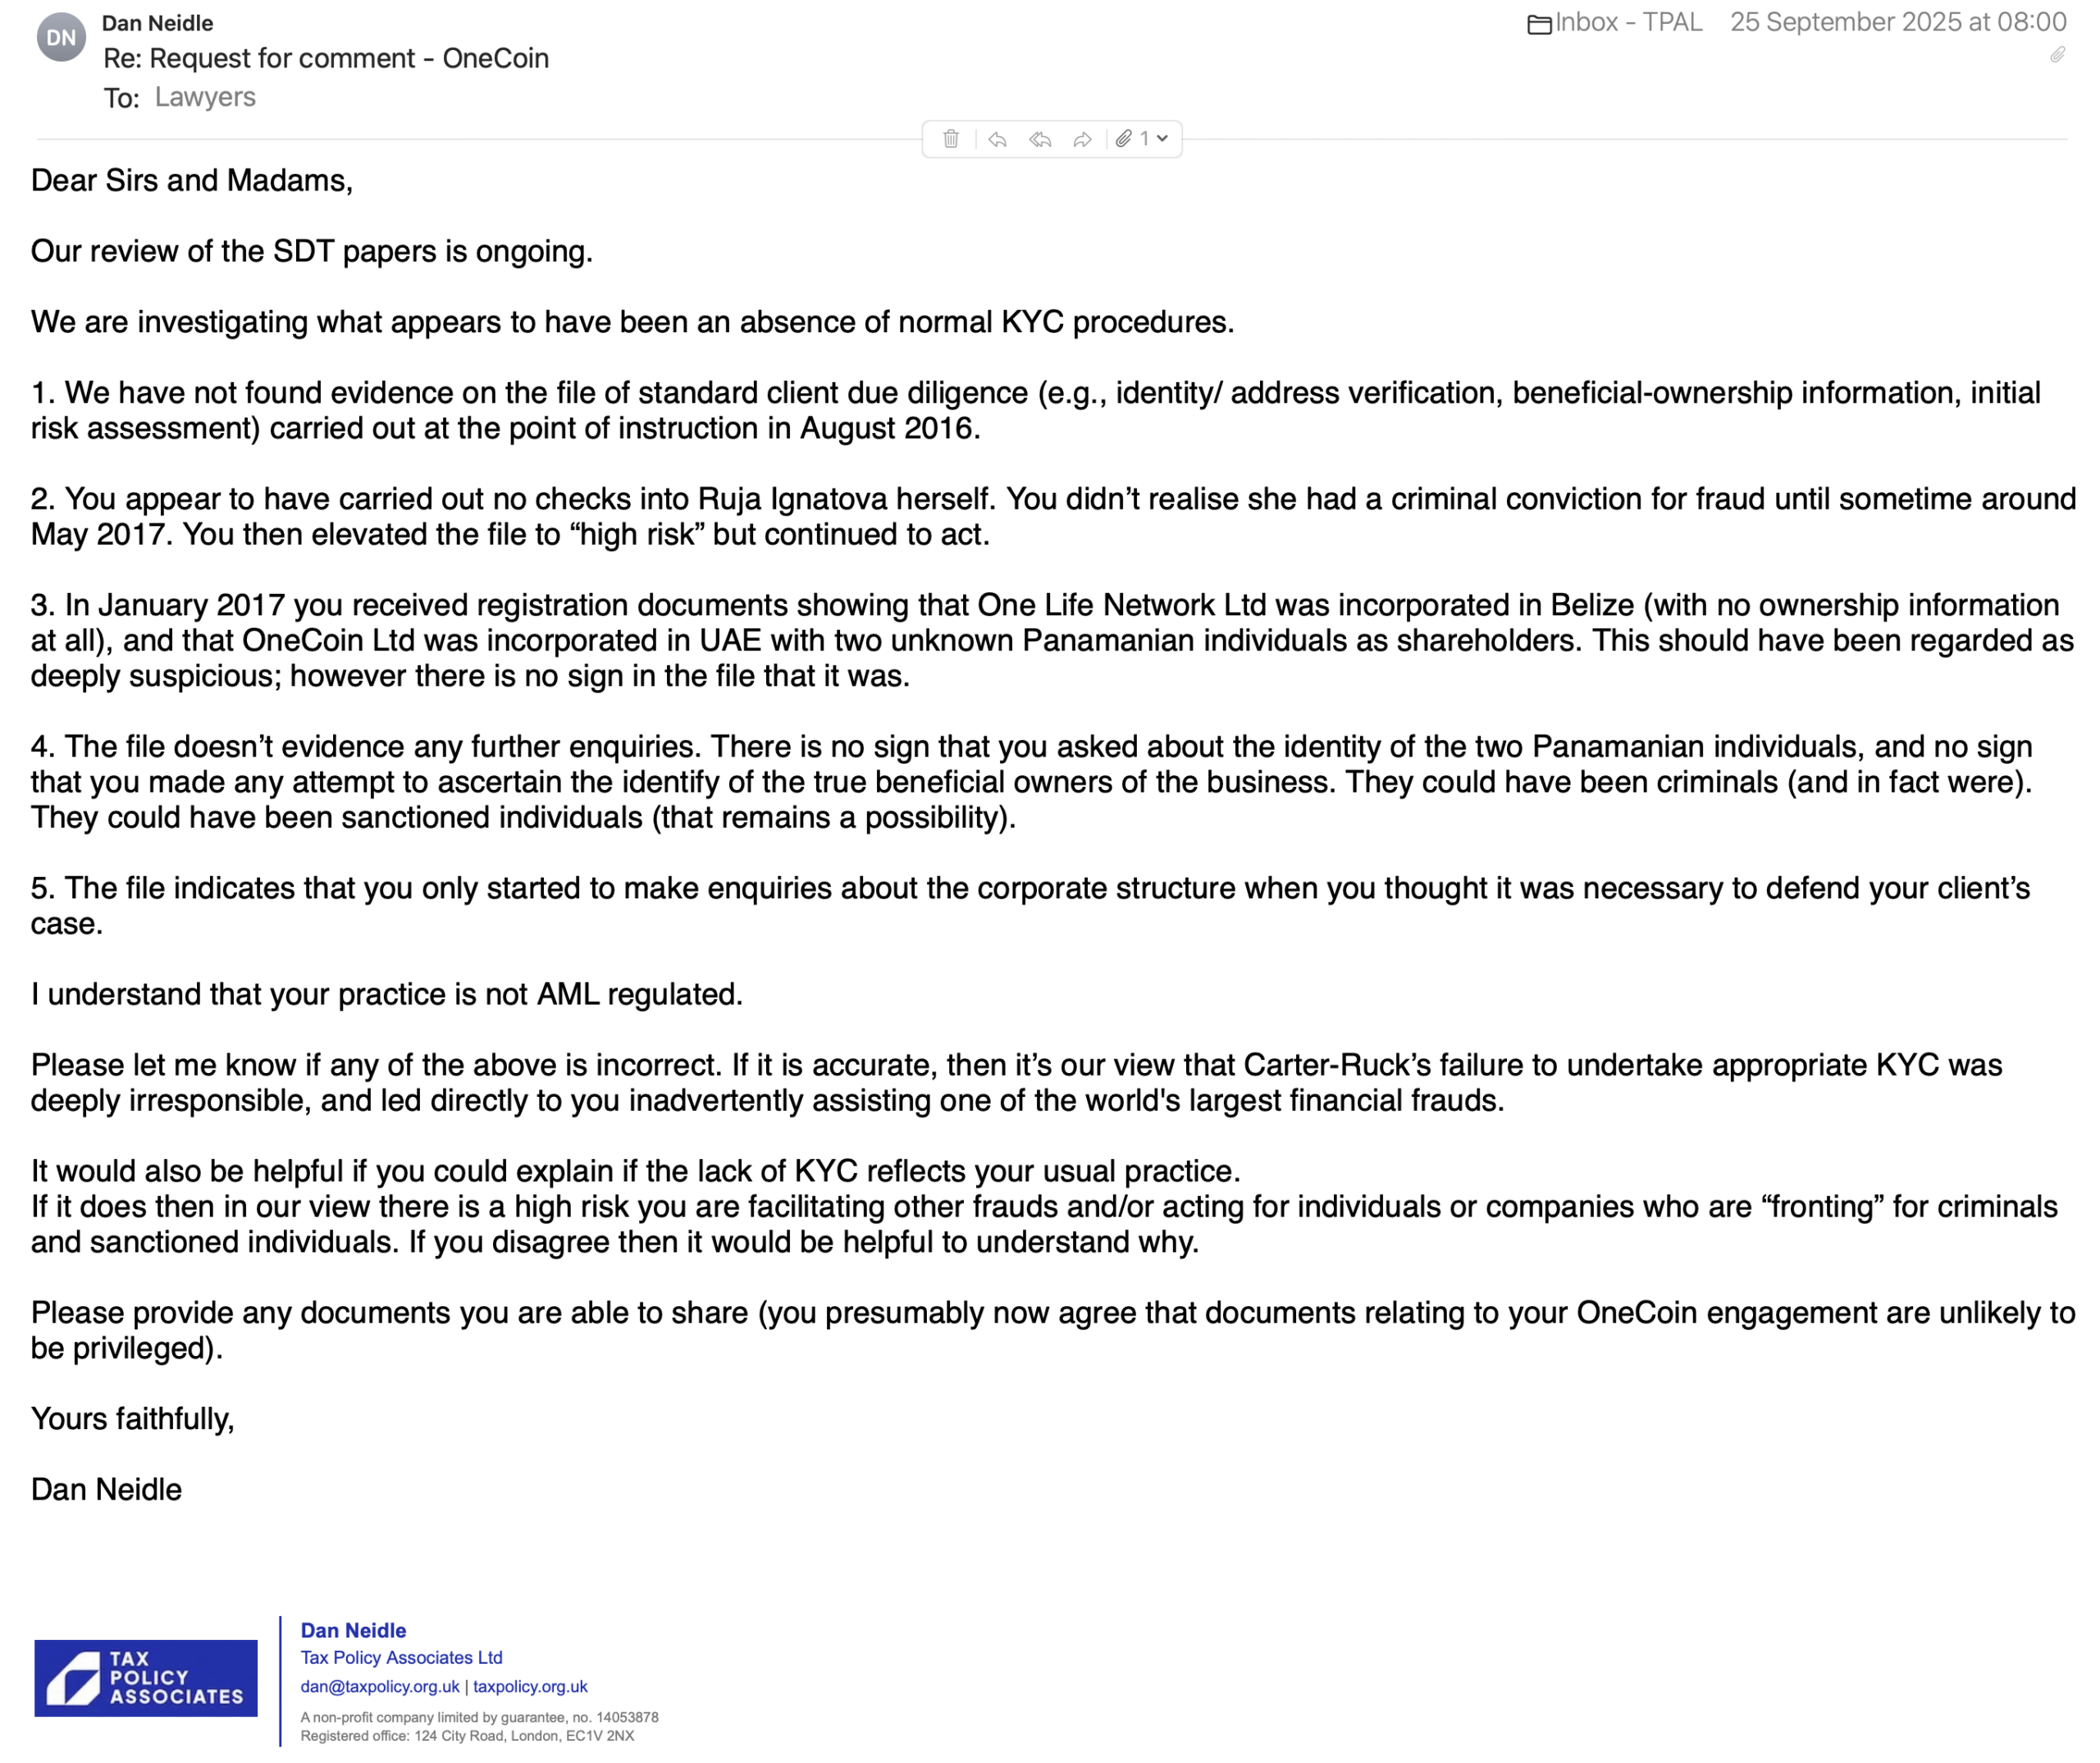
We wrote to Carter-Ruck saying that the documents appeared to show an absence of KYC procedures and, if that was correct, there was a high risk Carter-Ruck were facilitating other frauds and/or acting for companies controlled by criminals or sanctioned individuals.
Here is Carter-Ruck’s reply:
Carter-Ruck say that the absence of adequate due diligence has never formed part of the SRA’s case. That’s correct, because whilst the SRA initially alleged a due diligence failure, it was unable to identify a professional obligation Carter-Ruck had breached. That in no sense prevents us from conducting an independent analysis.
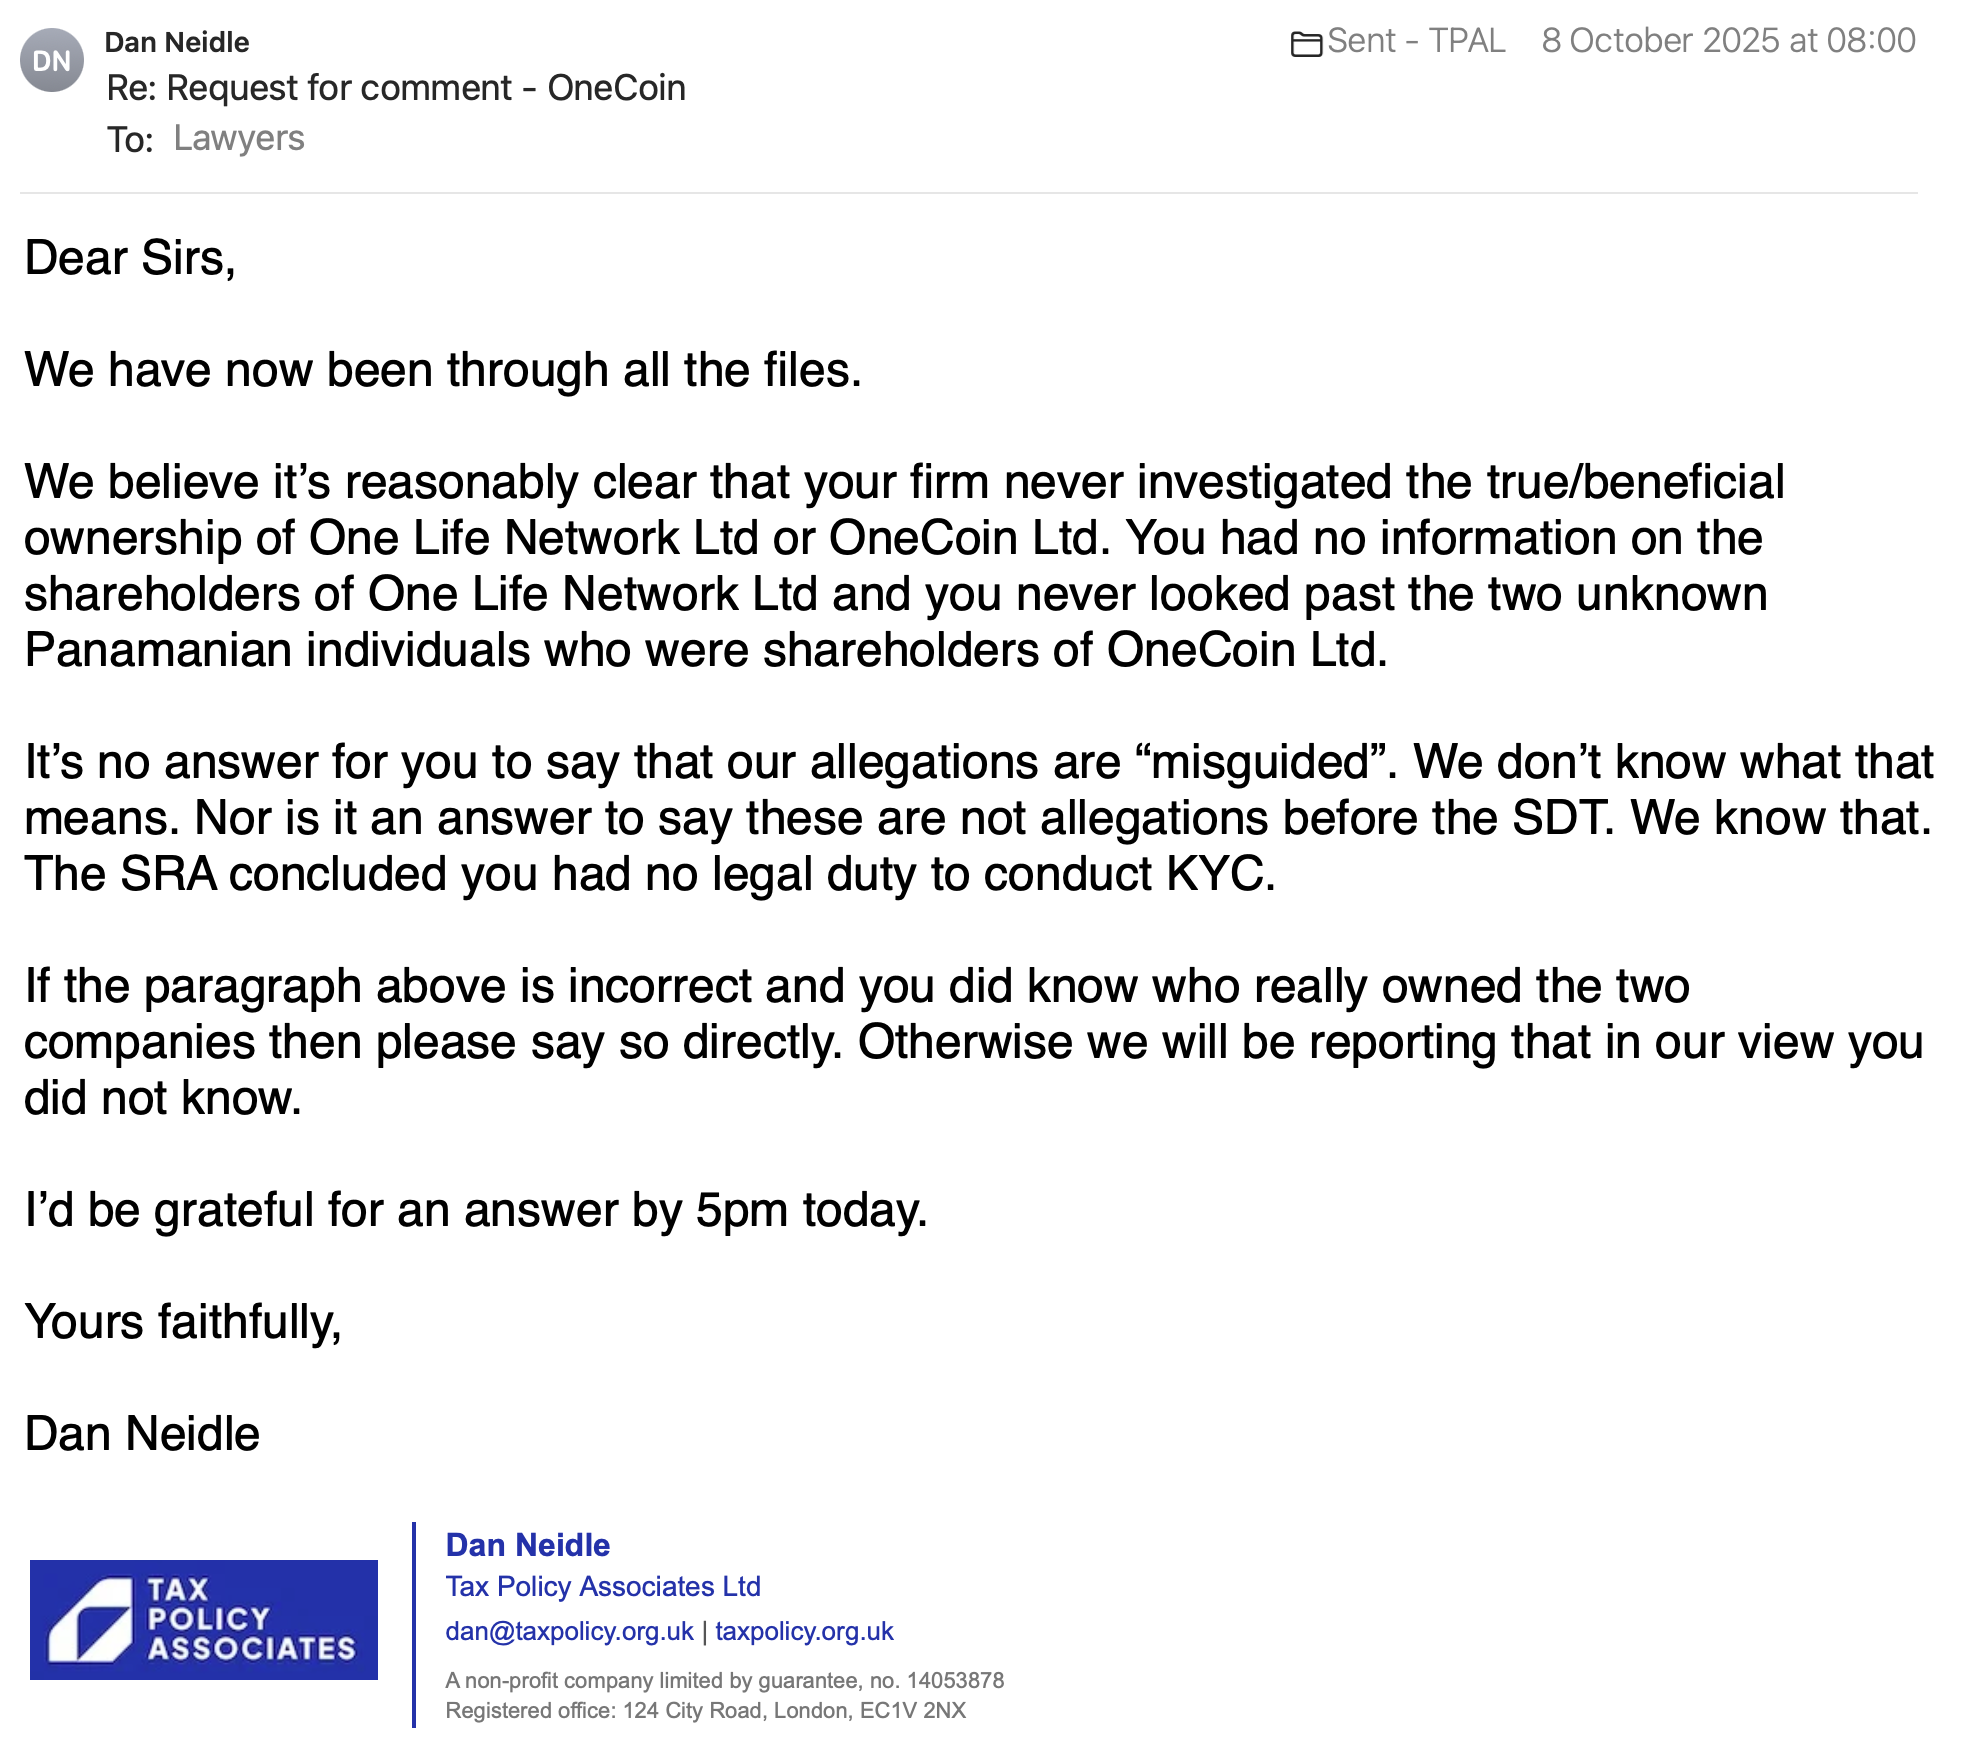
Carter-Ruck claimed in their reply that our “misguided” assertions were made because the documents available to us were only a partial record of what happened. We reviewed the documents exhaustively. We acknowledge that this is only part of Carter-Ruck’s client file, and there may be other documents that contain relevant information. It is, however, reasonably clear that Carter-Ruck never knew who their client was – the 25 May 2017 risk report says so.
We therefore asked Carter-Ruck to respond directly to the accusation they never investigated the true ownership of OneCoin:
Carter-Ruck didn’t reply.
We wrote again, identifying the potential offences under POCA.:
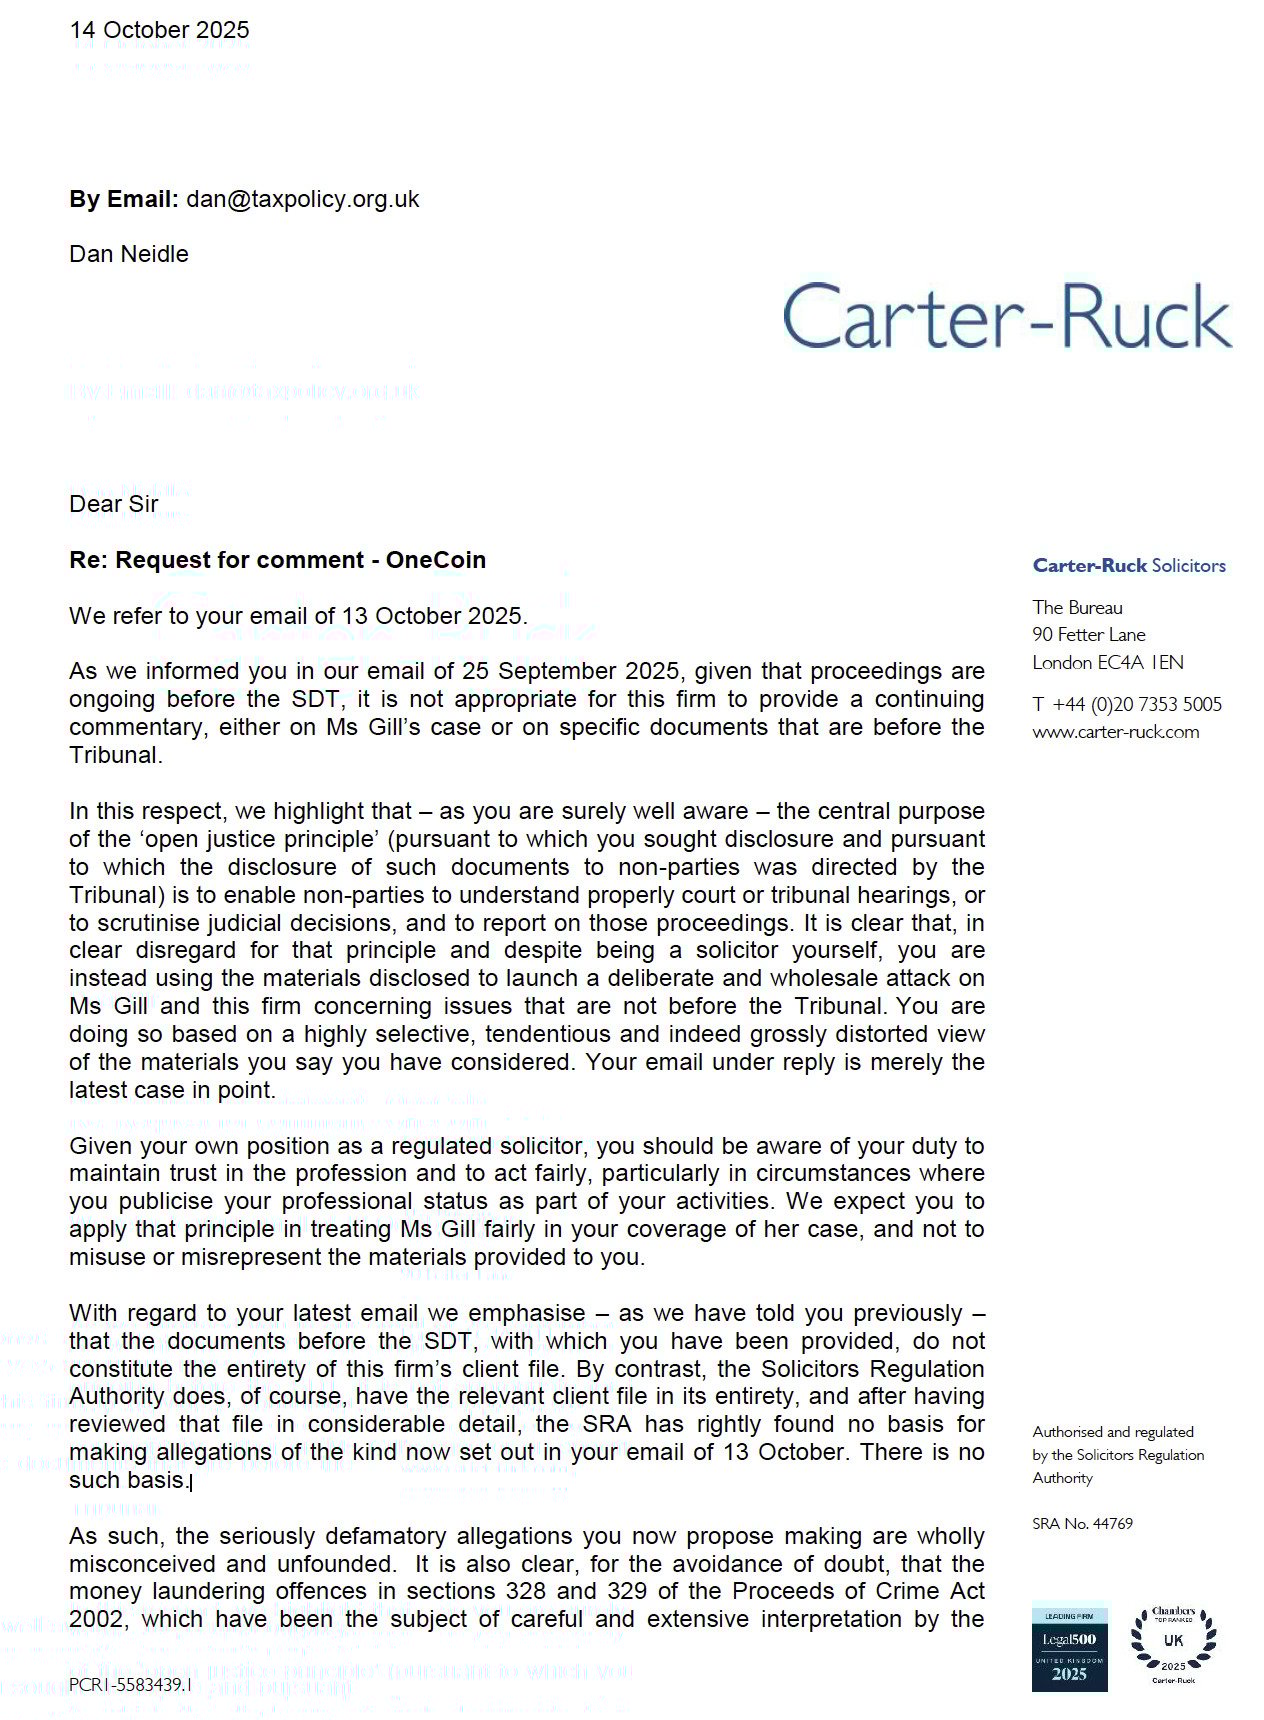
Carter-Ruck responded with a letter that had failed to specifically address any of the points we had made, and instead threatened us with legal and professional consequences for reporting this story. The letter says we are making “baseless” and “seriously defamatory” accusations, and that we are “launching a wholesale attack on Ms Gill and this firm” based on a “highly selective, tendentious and indeed grossly distorted view of the materials”:
Carter-Ruck add that “the money laundering offences in sections 328 and 329 of the Proceeds of Crime Act 2002, which have been the subject of careful and extensive interpretation by the courts, do not have the application here that you apparently suggest, for reasons that ought to be clear to you”. We do not know what those reasons are; neither do the POCA specialists we spoke to.
We pointed out that Carter-Ruck’s letter failed to identify any specific factual or legal error, and gave them another opportunity to reply. They did not take it:
Carter-Ruck helped facilitate a major crime. They didn’t know that’s what was happening, but they should have suspected it. That has to have consequences.
Thanks to T and C for the POCA and AML analysis, B, K and C for additional research, Q, A, J and L for giving the benefit of their experience in law firm AML/POCA compliance. Thanks to Helen Taylor of Spotlight on Corruption, E and N for reviewing a late draft.
Thanks to The Bureau of Investigative Journalism, The Foreign Policy Centre, The Free Speech Union and Spotlight On Corruption for working with us on the application that resulted in the publication of the full SDT document suite.
And, most of all, thanks to Jen McAdam and Bjørn Bjercke, who spoke out against OneCoin at a critical moment, in the face of intimidation and threats.
All published documents are the copyright of whoever owns them, and are published in the public interest.


![328 Arrangements
(1) Aperson commits an offence if he enters into or becomes concerned in an arrangement which he knows or suspects
facilitates (by whatever means) the acquisition, retention, use or control of criminal property by or on behalf of another
person.
(2) Buta person does not commit such an offence if—
(a) he makes an authorised disclosure under section 338 and (if the disclosure is made before he does the act
mentioned in subsection (1)) he has the appropriate consent;
(b) he intended to make such a disclosure but had a reasonable excuse for not doing so;
(c) the act he does is done in carrying out a function he has relating to the enforcement of any provision of this
Act or of any other enactment relating to criminal conduct or benefit from criminal conduct.
[Fi (3) Nor does a person commit an offence under subsection (1) if—
(a) he knows, or believes on reasonable grounds, that the relevant criminal conduct occurred in a particular
country or territory outside the United Kingdom, and
(b) the relevant criminal conduct—
(i) was not, at the time it occurred, unlawful under the criminal law then applying in that country or
territory, and
(ii) is not of a description prescribed by an order made by the Secretary of State.
(4) In subsection (3) “the relevant criminal conduct” is the criminal conduct by reference to which the property concerned is
criminal property. ]](https://taxpolicy.org.uk/wp-content/uploads/2025/10/Screenshot-2025-10-11-at-19.58.50.png)
![329Acquisition, use and possession (1)A person commits an offence if he— (a)acquires criminal property; (b)uses criminal property; (c)has possession of criminal property. (2)But a person does not commit such an offence if— (a)he makes an authorised disclosure under section 338 and (if the disclosure is made before he does the act mentioned in subsection (1)) he has the appropriate consent; (b)he intended to make such a disclosure but had a reasonable excuse for not doing so; (c)he acquired or used or had possession of the property for adequate consideration; (d)the act he does is done in carrying out a function he has relating to the enforcement of any provision of this Act or of any other enactment relating to criminal conduct or benefit from criminal conduct. [F1(2A)Nor does a person commit an offence under subsection (1) if— (a)he knows, or believes on reasonable grounds, that the relevant criminal conduct occurred in a particular country or territory outside the United Kingdom, and (b)the relevant criminal conduct— (i)was not, at the time it occurred, unlawful under the criminal law then applying in that country or territory, and (ii)is not of a description prescribed by an order made by the Secretary of State. (2B)In subsection (2A) “the relevant criminal conduct” is the criminal conduct by reference to which the property concerned is criminal property.]](https://taxpolicy.org.uk/wp-content/uploads/2025/10/Screenshot-2025-10-11-at-22.25.45.png)


![By this application, the Respondent seeks disclosure of the content of the initial recommendation of Dr Sam Jones, the Senior Investigation Officer who was assigned the Respondent’s case and who produced the notice referring the Respondent to the Tribunal. Dr Jones had previously indicated to the Respondent and her firm, by an email dated 12 July 2023, that she had made a recommendation on the outcome of the investigation, and intended to provide an update the following month “to bring this matter to a conclusion” [X1037]. An apparent intervention by senior management prevented the notification of any decision by Dr Jones until 8 February 2024, when she served a very wide-ranging notice of referral [X4-X32], most of the allegations in which have since been abandoned by the Applicant.
5.
The Respondent has inferred that Dr Jones’ original recommendation was to close the investigation and has asked the Applicant to disclose it. The Applicant has refused disclosure and otherwise refused to confirm or deny the inference drawn by the Respondent. Accordingly, the Respondent seeks an order for disclosure.](https://taxpolicy.org.uk/wp-content/uploads/2025/09/Untitled-1.jpg)

![In light of the reputational harm caused, which easily passes the threshold of “serious harm” under Lachaux v Independent Print Ltd [2019] UKSC 27, I require the following steps to be taken within 7 days:
Publication of a clear and public confirmation of your sincere belief that I am the leading barrister in the field of taxation in the country, as previously stated, and a sincere apology for your misleading and disparaging remarks;
Retraction or substantial amendment of the headline and body of the article so as to remove the defamatory implications it currently conveys;
Publication in full of my letter to the Information Commissioner, together with acknowledgment of the outcome of the BSB investigation;
Written confirmation that you shall apply higher editorial standards in the future, and that no further false or misleading references to any persons will be made in your publications;
Undertaking to make the following payment: you shall undertake to pay 80% of any amounts which my regular or historic clients represent to you, in writing, as amounts they would have paid to me under an engagement with me, but did not do so because of your publications.
Should you fail to take these steps, I will proceed without further notice to pursue all remedies available to me, including injunctive relief, damages, and costs.
Yours sincerely,
Setu Kamal](https://taxpolicy.org.uk/wp-content/uploads/2025/09/image-2-2000x1102.png)


