
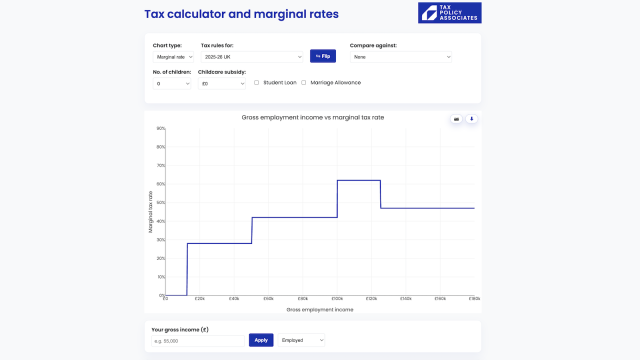
This tax calculator shows you your take-home pay after tax and National Insurance. It works for Scotland and the rest of the UK. It takes pensions, child benefit, student loans and childcare into account.
Other tax calculators will do all that. Ours also shows you your marginal tax rate – the tax you’ll pay on the next pound you earn. That can be important in deciding whether to accept a promotion or work more hours.
And our calculator lets you compare your current tax position with other scenarios: Scotland vs the rest of the UK, or current tax vs proposals from various political parties.
We are currently testing this in advance of the Budget – if you have any problems, or have any comments, please do drop us a line. We hope to update it after the Budget with the position for next year.
We explain how it works, and its assumptions and limitations, below.
You can open the calculator full screen if that’s easier.
How do I use the calculator?
It starts on 2026/27 rates for England, Wales and Northern Ireland. You can change the options: switch to Scotland, and add child benefit, childcare subsidies, a student loan or pension contributions. The results update and the chart redraws.
You can use the “Compare with” dropdown next to the chart to compare the current UK/Scotland result with various other proposals made by political parties.
The camera and table icons next to the chart download an image of the chart or the full data.
We cannot give legal or tax advice. We’ve done our best to make this correct, but it’s not guaranteed. There could be errors. More importantly, you may have circumstances outside the basic case that the calculator expects. HMRC’s Self Assessment system will calculate your tax precisely, as will many available commercial packages.
Frequently asked questions
Can I use the calculator without giving away my personal data?
Yes. Nothing you enter is sent to us, or to anyone else. Every calculation runs in your own browser and stays on your device.1 Nothing is saved even there2 – close the browser/tab and it will be gone forever.
The exception is if you download the chart image or data (which you can do with the icons at the top right of the chart). Then, if it contains your actual income, you should of course be careful where you store or send it.
Why doesn’t this match my payslip?
Usually for one of three reasons.
First, the calculator works over a whole year, and your payslip covers a month. National insurance and student loan repayments are worked out separately for each pay period, so if your pay goes up and down, twelve payslips won’t add up to the annual figure.3
Second, it assumes the standard tax code. If yours has been adjusted, perhaps because you underpaid in an earlier year or have a company car or medical insurance, then your deductions will be different.4
Third, it doesn’t know everything about you. Perhaps your employer takes other items off your pay, like a season ticket loan. Perhaps you use payroll giving? Perhaps you are a self-employed farmer employing the “herd basis“. There are many weird and wonderful ways our tax system works, and our calculator is happily ignorant of most of them.5
What else does the calculator leave out?
Most importantly: we leave out Universal Credit and almost everything else in the benefit system. We have no expertise in benefits, and income for benefit purposes is not the same as income for tax purposes, so putting it in one calculator is not very workable. But there are certainly serious marginal rate problems in the benefit system – Universal Credit has a 55% taper rate, and that’s on top of income tax. The carer’s allowance has a harsh cliff edge.
We do include child benefit, because that’s the one benefit tied directly to taxable income and recouped through a special tax: the High Income Child Benefit Charge.
So the calculator models one income for a whole tax year, using the standard tax code and 2026/27 rates. It doesn’t look at a partner’s income, and it doesn’t include Universal Credit.
The pension figures leave out employer contributions (other than salary sacrifice), defined benefit accrual, carry-forward of unused annual allowance, the money purchase annual allowance and age-related limits on relief. They also leave out the top-up HMRC pays low earners in net pay schemes after the end of the tax year.
What is a marginal tax rate, and why should I care?
Your effective rate is the share of your income that goes in tax. An employee outside Scotland earning £50,000 in 2026/27, with no pension contributions, student loan or children, takes home £39,520: about 21% has gone in tax. That’s their marginal rate.
Your marginal rate is what you lose from your next £1. It’s the number that decides whether overtime is worth it, whether to take a promotion and whether a second earner goes back to work. Nobody ever sees it: it isn’t on your payslip, and it isn’t in any table of tax rates. But it’s one of the most important things about any tax system.6
This is the official chart of German tax rates – the blue line shows the marginal rate and the red line the effective rate. Both sensibly smooth:
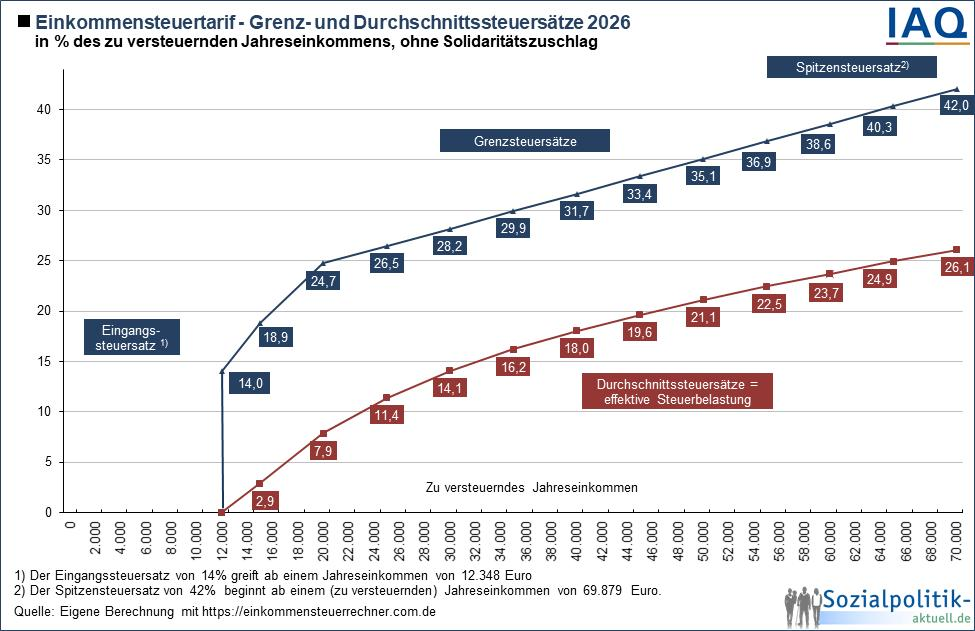
Ours lurches about, particularly at £60,000 (where child benefit is withdrawn) and £100k (where the personal allowance is withdrawn). These withdrawals (or “tapers”) are tax by another name.But because they never appear in official lists of tax rates, and aren’t understood by many non-specialists, people often don’t know they’re paying them. That makes them attractive tricks for politicians keen to raise a bit more revenue with the minimum political fuss.
Do people respond? Salaried employees mostly don’t fine-tune their pay around tax thresholds, because most people can’t choose their salary to the pound.7 But people who can control their income do, and the traps are now more than big enough to be worth the effort. There’s a visible bump of around 32,000 taxpayers holding their income at £100,000.8
What is the 60% tax trap?
It’s the effect of that personal allowance taper. Between £100,000 and £125,140 of income, your £12,570 personal allowance is withdrawn by £1 for every £2 that you earn.
For an employee outside Scotland, each extra £1 is taxed at 40p and also costs you 50p of allowance, which is itself taxed at 40p: another 20p. That’s 60p gone from every pound. Add 2% national insurance and the real rate is 62%.
There’s no policy rationale for any of this. The personal allowance taper was introduced in 2010, and the £100,000 threshold has never been uprated – so it catches more people every year.9 We think the distortions around £100,000 are the worst feature of the income tax system.
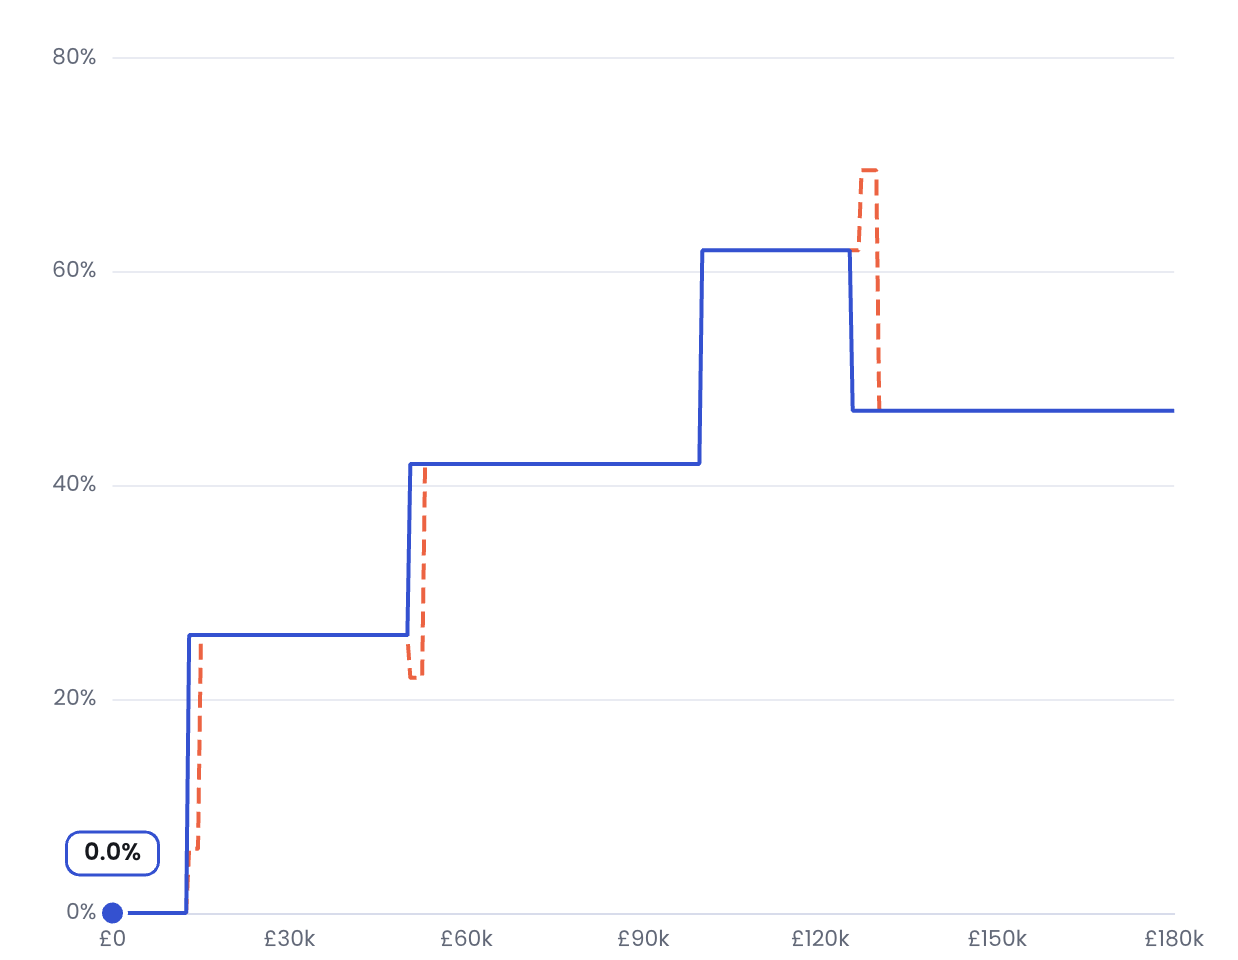
The personal allowance taper creates surprising results. Reform UK propose increasing the personal allowance to £15,000. That means the taper operates over a larger range of incomes, and hits the 47% additional rate. That would increase the top marginal rate to 69.5% in England:
Why does the marginal rate fall above £125,140?
Because by then there’s no allowance left to take away. Once the allowance hits zero at £125,140, the extra 20p stops, and you drop back to the additional rate of 45%, plus 2% national insurance.
So someone on £110,000 pays a higher rate on their next pound than someone on £200,000. That is weird, but not a mistake in the chart: it’s a mistake in our tax system.
How much do I need to put into a pension to escape the 60% trap?
Lots of people choose to pay more into their pension, so they’re not paying that 60% marginal tax on income above £100,000.
Whether you do this or not is a choice. If you are approaching retirement, it can often make sense. If you are, say, in your 20s, then it’s far from clear that saving a bit of tax now is worth building up savings you won’t be able to touch until you’re at least 57. Sometimes people are so keen to save tax that they take decisions that aren’t entirely rational – so this is a point to think about carefully.
But if you want to do this, the calculator will show you how much you need to contribute. This is absolutely not legal or tax advice, and you need to make your own decision.
There are two ways to put money into your pension.
Put £10,000 into your pension by salary sacrifice and your take-home pay falls by just £3,800. You’re saving income tax, restoring some of your lost personal allowance, and saved 2% national insurance. From April 2029 that will be less generous, because only the first £2,000 sacrificed each year will escape national insurance.
By relief at source, the route for a personal pension or SIPP, the same £10,000 costs you £4,000 – because you don’t save national insurance.
Restoring childcare support or child benefit can make the cost lower still.
Does Gift Aid reduce my tax?
Yes, and it works much like a pension contribution. The charity reclaims basic rate tax on what you give, and the grossed-up donation comes off your adjusted net income.10
In the 60% band the effect is pretty impressive. You give £800 and the charity reclaims £200 (so receives a total of £1,000). Because your adjusted net income falls by £1,000 you get £400 back through your tax return.
It cost you £400 to give the charity £1,000.
How else can I legally reduce my tax?
For most employees the list is short: pension contributions, Gift Aid, and the marriage allowance if you’re eligible.
Our tax avoidance FAQ explains the difference between ordinary tax planning, avoidance and evasion. We can’t give anyone legal or tax advice but, for what it’s worth, our view as a legal and ethical matter is that making pension contributions, giving through Gift Aid or claiming the marriage allowance is not tax avoidance in any sense.11
GOV.UK’s guide to income tax allowances and reliefs is a good place to start.
How does the high income child benefit charge work?
If you or your partner have adjusted net income over £60,000, child benefit is clawed back at 1% for every complete £200 above the threshold, so it’s all gone by £80,000.12 This creates an anomalously high marginal rate between £60,000 and £80,000, if you have children qualifying for child benefit.
The more children you have, the higher that marginal rate, because there’s more benefit to take away.
An employee outside Scotland with three children, an undergraduate student loan and no pension contributions faces a marginal rate of about 67.3% within that band. Add a postgraduate loan and it becomes 73.3%.
An anomaly within the anomaly is that child benefit is assessed on the higher earner alone, not on household income. So a couple each earning £59,000 (£118,000 between them) keep all their child benefit, while a single parent on £80,000 loses the lot. The government promised in March 2024 to fix that by moving to a household basis, then dropped the idea in October 2024 because it would cost £1.4bn. Our 2023 investigation shows another problem: how easily the charge catches people unaware.
Things get really very complicated if households change over time. For example, a couple who live together might split up, move house, or move in with new partners. We’ve seen cases where someone on a fairly modest income has a highly complex and uncertain tax position.
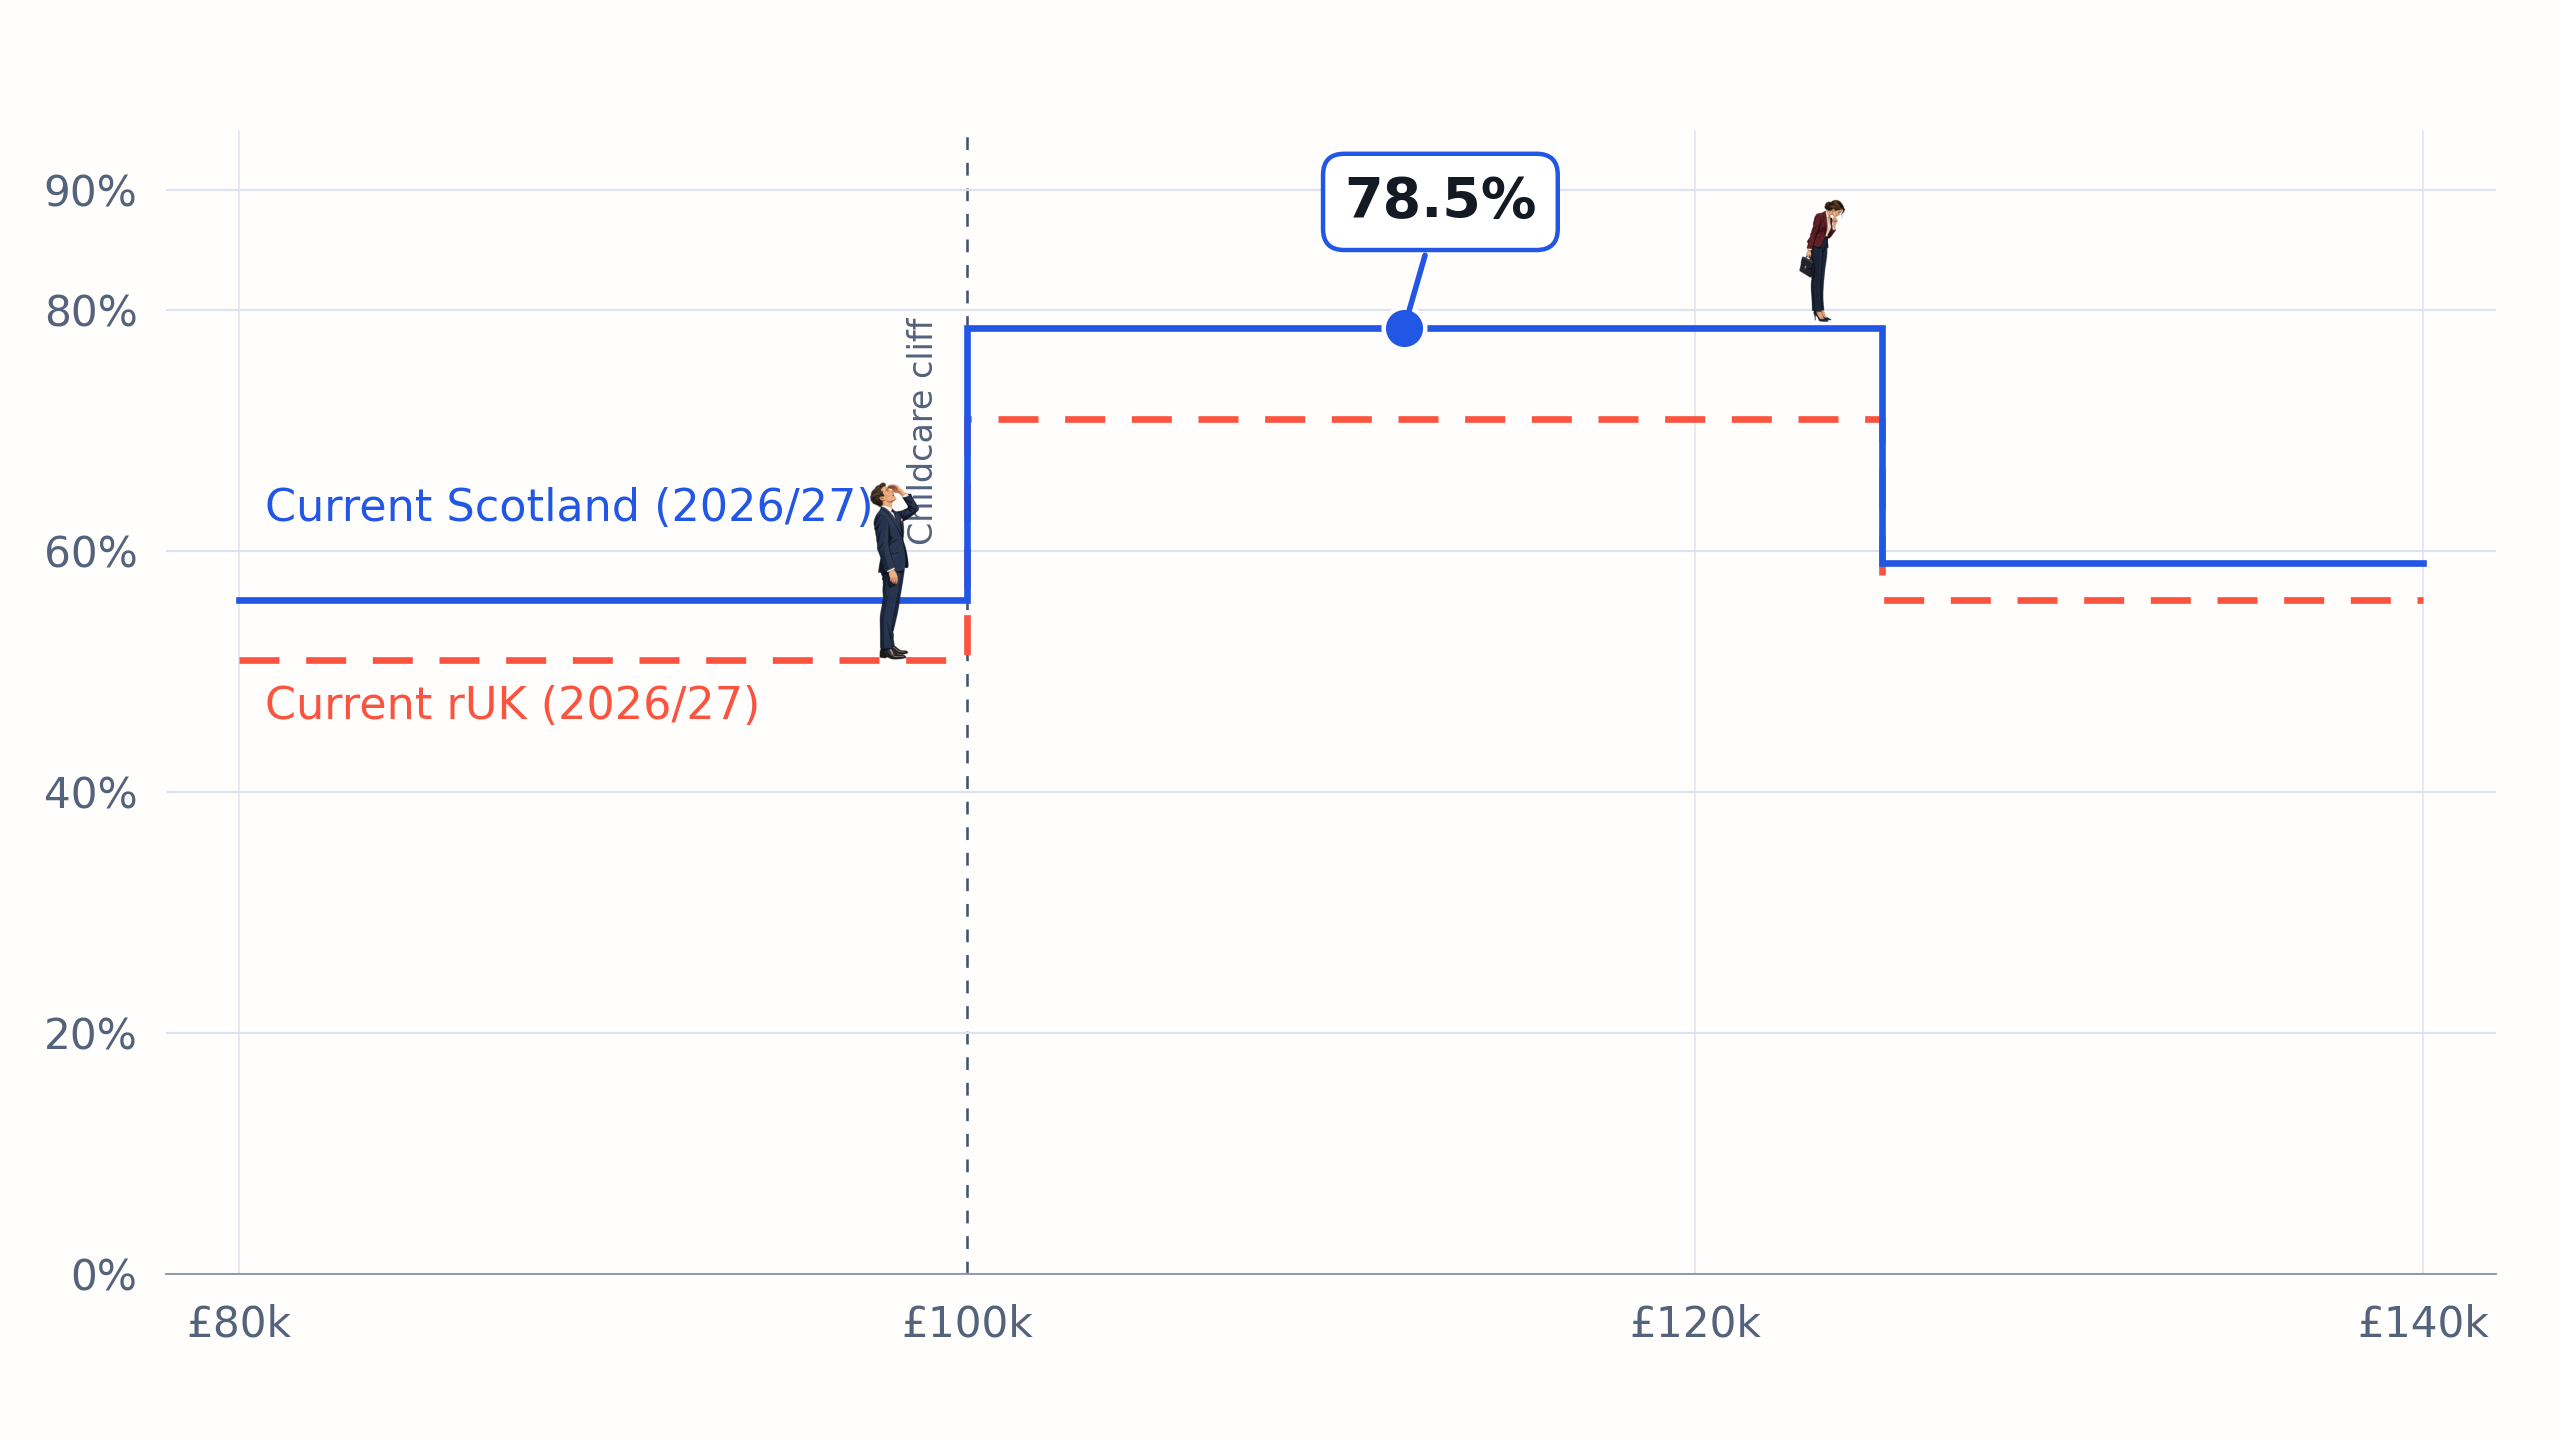
The £100,000 childcare cliff: the worst rate in the system
The oddities above are all from a taper: painful, but gradual.
Childcare support is a cliff. 13
There are two different childcare schemes. Tax-free childcare adds £2 for every £8 you pay a childcare provider, up to £2,000 a year for each child aged 11 or under (£4,000, and up to age 16, for a disabled child). And in England, working parents get 30 hours a week of funded childcare for children from nine months to four years old, for 38 weeks of the year.
But earning a penny more than £100,000 can take away all the tax-free childcare, and (in England) 15 of the 30 funded hours.14
The calculator shows all this. It lets you choose the support your household would lose, from £0 to £20,000 a year in £2,500 steps. The information icon beside the input explains how to work out the amount.
For a household losing £20,000 of support, a £1 pay rise over £100k costs £20,000: a marginal rate of 2,000,000%, before tax. A pay rise can leave parents thousands of pounds worse off, and it can take a much larger one to recover. The “net v gross” chart shows this dramatically:
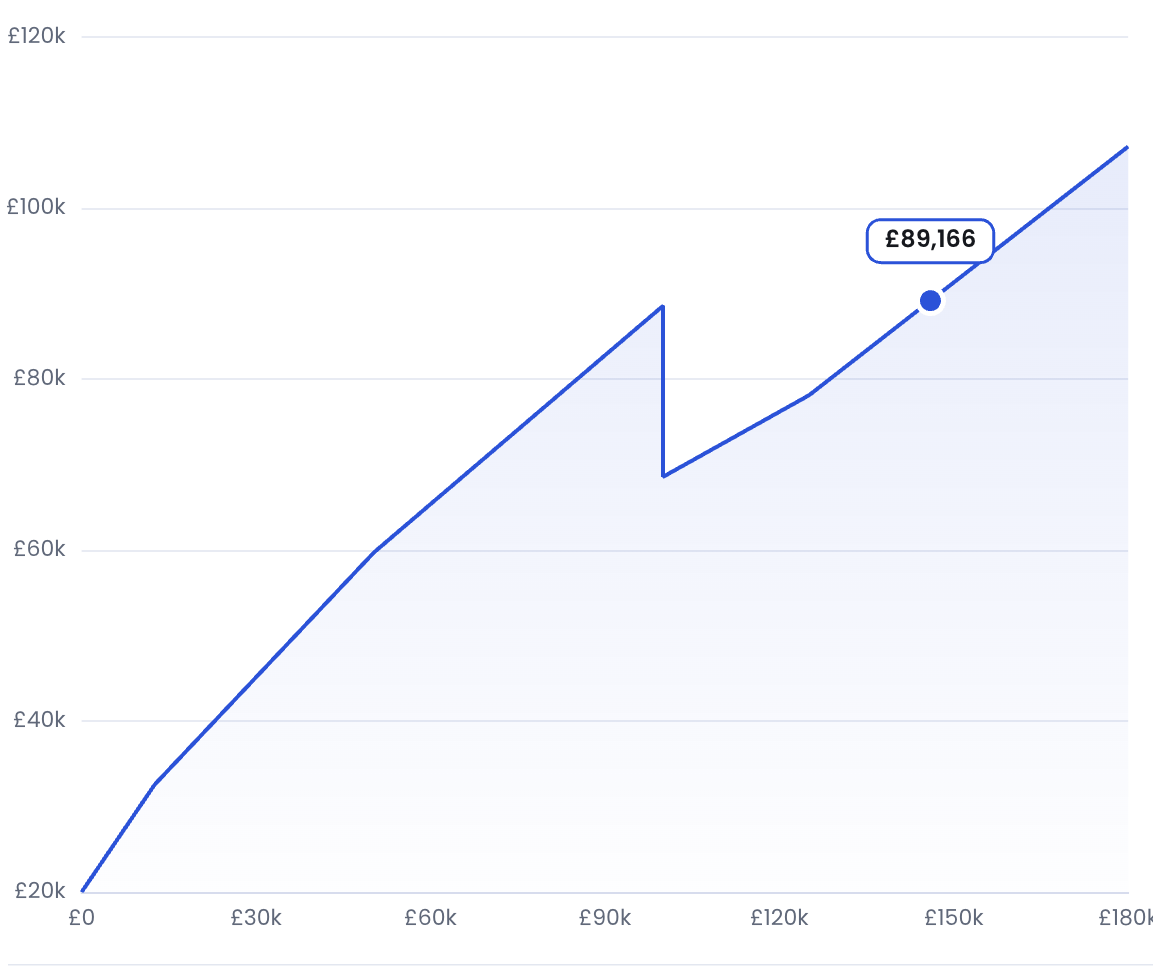
This creates a powerful incentive for some people to hold their income below £100k – and new research from CenTax finds evidence of exactly that. They estimate that removing England’s funded childcare cutoff would cost around £640m a year by 2029/30.15
So far the response is modest: fewer than one in ten employees with eligible children held their income down in 2022. CenTax expects that to grow sharply as the funded hours expand. The more generous the scheme becomes, and the more people take it up, the worse the marginal tax effect is, and the more deleterious effects we should expect to see.
Do student loans count as tax?
Legally, no. Practically, yes.
While you’re repaying a student loan, they behave exactly like a tax: another deduction from every extra pound you earn. Undergraduate repayments are 9% of income above your plan’s threshold, and a postgraduate loan adds 6% above £21,000.16 It’s just a a complicated, hidden graduate tax.
Repayments stop when the balance is cleared or the loan is written off – and about two-thirds of graduates will never pay off their loan. The write-off date depends on the plan and when you took the loan out.17 V
All of these rules compound. An employee outside Scotland paying 40% income tax, 2% NI and both undergraduate and postgraduate repayments faces a 57% marginal tax rate. With three children in the child benefit band, it’s about 73.3%. Later it jumps to 77%.18
What is the marriage allowance, and am I eligible?
If you’re married or in a civil partnership, one of you earns less than the personal allowance and the other is a basic rate taxpayer (or a starter, basic or intermediate rate taxpayer in Scotland), the lower earner can transfer £1,260 of their allowance to the other. It’s worth up to £252 a year, and you can claim for previous years as well. HMRC guidance also covers backdating and how to apply.
Turn on “Marriage allowance received” if you receive a transfer. It reduces your income tax by up to £252, but it can’t create a refund bigger than your income tax. It also creates a small cliff of its own: earn £1 over the basic rate limit and you lose the whole £252, as we charted in 2022. It’s a largely pointless piece of complication.
Is tax higher in Scotland?
Above £33,494 Scottish tax is always higher, and the traps are worse. Below that, Scottish income tax is slightly lower, by at most £40 a year.
Our analysis of the 2026 Scottish Budget explains the latest changes. Scotland has six income tax bands rather than three, topping out at 48%.19
Because the personal allowance taper interacts with a 45% rate rather than 40%, the Scottish version of the 60% trap is 67.5%. Add employee national insurance and it’s 69.5%, against 62% elsewhere.
You can switch “Where you live” to Scotland to see where the differences fall. We regard the high Scottish rates as political theatre.20
Does this work if I’m self-employed, a partner, or inside IR35?
Sure – just use the “Paid as” dropdown and select “self-employed”
For an ordinary partner or LLP member, enter your share of taxable trading profit: the calculator applies self-employed NI, and partners pay no employer NI. 21
For the IR35 option, enter the contract amount and the calculator will works backwards, because employer NI comes out of the £ before you receive your income.
Does this cover council tax, VAT or capital gains?
No – the calculator only covers income tax, national insurance, and the student loan and benefits that behave like taxes.
There are about 88 other UK taxes, and the calculator ignores them all.
What’s the highest marginal tax rate in the UK?
The highest published income tax rate is 45%, or 48% in Scotland. But a Scottish employee on £124,700 with undergraduate and postgraduate loans, and no pension contributions, faces a combined marginal rate of 84.5%. They don’t need children to get there. More than four fifths of each extra pound disappears.
That isn’t the ceiling. At £70,000, a Scottish employee with six children receiving child benefit, both loans and no pension contributions faces about 89.3%. There’s no limit to the number of children for child benefit, so there’s no single highest rate. The childcare cliff can produce much larger losses again, and lower down the income scale Universal Credit, which the calculator doesn’t model, adds a 55% taper of its own.
There’s a respectable case for high marginal rates on the very highest earners.22 There’s no case for the highest rates in the system to fall on people earning £60,000 or £100,000, and this happens only because of historical accident and political expediency. We believe they’re inequitable and hold back growth.
So whether you believe UK tax overall is too high or too low, we hope everyone will agree that at some incomes the rates are anomalous and damaging. Politicians looking for taxes to cut should be looking at this – and also focus on the high marginal rates that universal credit and the carer’s allowance create for low earners.
How does the calculator work?
We’ve published the code on our GitHub. It’s licensed under the MIT licence, so you can use it or adapt it however you like in any private or commercial project, as long as you credit Tax Policy Associates Limited.
We tried our best to make the calculations exactly right. The chart, however, is intentionally wrong: the real personal allowance taper, child benefit charge and annual allowance taper move in steps, and so can’t be smoothly plotted. We therefore cheat, and the chart approximates these as smooth functions. Cliff edges, such as losing childcare support, aren’t smoothed.
If you see any errors, or have any suggestions, do please get in touch.
Many thanks to K for help with coding, L for testing, and Matt for the image.
The Budget 2025 tax calculator
Banks say they’re overtaxed. The TUC says they’re undertaxed. Who’s right?
Capital gains tax reform was right. Now it’s dead.
A £2.6bn lobbyist fairytale: economic consultancy Cebr sold VAT-free shopping as a tax cut that pays for itself
37 ways Andy Burnham could raise £4.7bn

The Scottish Budget – four thoughts on a tiny tax cut
Footnotes
You don’t have to take our word for it. Open your browser’s developer tools (F12 on Chrome) and watch the network traffic while you use the calculator: nothing you enter is sent to us. ↩︎
Unless you have some weird browser or extension; we’ve done everything we can to keep the data temporary. ↩︎
Employee NI uses weekly or monthly thresholds. This is one of the many reasons that National Insurance isn’t fit for purpose. Student loan repayments also track weekly and monthly thresholds. ↩︎
Your tax code is on your payslip and your P60. GOV.UK explains what your tax code means and how to check the tax on your payslip. ↩︎
One particularly odd one we took the decision not to cover is this. Child benefit weeks start on a Monday and 2026/27 has 53 Mondays, so a family claiming all year can be entitled to 53 weeks this year. Our calculator, however, uses the conventional 52. That leaves out one week’s benefit (£27.05 for one child), and so understates the High Income Child Benefit Charge’s marginal rate between £60,000 and £80,000 by 0.14 percentage points for one child. ↩︎
Economists call it the effective marginal tax rate: “the proportion of a small increase in earnings taken in tax and withdrawn benefits”. See the Mirrlees Review, Tax by Design (2011), chapter 4. And note that half the public appears to think that crossing the higher rate threshold means 40% tax on all their income, which is another good reason to talk about marginal rates. ↩︎
Stuart Adam, James Browne, David Phillips and Barra Roantree looked at UK tax returns: “At kinks, where the marginal rate rises, we find bunching by company owner-managers and the self-employed, but not those with only employment income.” See Frictions and taxpayer responses, International Tax and Public Finance (2021). Emmanuel Saez found the same in the US, and Raj Chetty and others explain why: adjustment costs, and hours set by employers. ↩︎
See our 2025 Budget calculator. For the evidence on the childcare cliff, see below. ↩︎
The personal allowance and basic rate limit are currently frozen until April 2031. The OBR estimates that, as a result of the threshold freezes, “4.8 million more will have moved to the higher rate, and 600,000 more onto the additional rate”. In 2023 the additional rate threshold was cut from £150,000 to £125,140 to line up with the end of the taper: see the OBR on threshold freezes. ↩︎
See GOV.UK: Gift Aid. Higher and additional rate taxpayers claim the extra relief through Self Assessment, which works by extending the basic rate band: see section 414 of the Income Tax Act 2007. The charity claims the basic rate part directly. ↩︎
Or at least not normally. If you, say, set up your own fake charity, make Gift Aid contributions to that, and then use the charity to pay for a family holiday, then that is something entirely different. Very possibly criminal tax evasion rather than merely tax avoidance. This is not legal advice, but we would gently recommend against doing anything like that. ↩︎
See GOV.UK: high income child benefit charge. The charge is in Chapter 8 of Part 10 of the Income Tax (Earnings and Pensions) Act 2003; section 681C sets the rate and rounds the charge down to whole pounds. ↩︎
Economists sometimes use the term “notch”, I think because that’s harder to understand. The IFS Tax Law Review Committee’s report on thresholds in the tax system discusses both, with the £100,000 taper and the childcare cliff as examples. Henrik Kleven and Mazhar Waseem showed that notches “induce large behavioural responses even when structural elasticities are small” ↩︎
Rules differ across the UK: Scotland’s funded hours aren’t means-tested, although tax-free childcare is. ↩︎
Arun Advani, Josh Flew, Jack Pepin-Hall and Andy Summers, Removing the £100,000 childcare cliff-edge: Impacts and cost of reform (September 2026), pp. 3 to 6. Using HMRC data for 2021/22 and a comparison with Scottish parents, the researchers estimate that around 1,100 English parents of three- and four-year-olds held their adjusted net income below £100,000 specifically because of the childcare cutoff. Their central projection is nearly 12,000 parents by 2029/30, following the expansion of funded hours and growth in incomes. Note that the Centre for British Progress has proposed replacing the cliff with a taper – on their numbers, that could actually raise money. ↩︎
Thresholds for 2026/27: Plan 1 £26,900, Plan 2 £29,385, Plan 4 £33,795 and Plan 5 £25,000. See GOV.UK: student loan repayments. For employees, the calculator shows what payroll deducts. Self Assessment works out repayments after deducting personal pension contributions, so the calculator does that for the self-employed, and an employee who files a return and pays into a SIPP may end up repaying less. See regulation 29(4)(j) of the Education (Student Loans) (Repayment) Regulations 2009. ↩︎
For example, Plan 2 is normally written off 30 years after the April you were first due to repay, and Plan 5 after 40 years. There’s a summary here. ↩︎
These examples assume no pension contributions and income above both loan thresholds. ↩︎
Scottish rates for 2026/27: starter 19% to £16,537, basic 20% to £29,526, intermediate 21% to £43,662, higher 42% to £75,000, advanced 45% to £125,140, top 48% above. National insurance is not devolved and is the same across the UK. See Scottish income tax rates and bands. ↩︎
The Scottish Government’s evaluation of the 2018/19 changes estimated that raising the top rate to 46p “raised limited additional revenues, and might even have resulted in a small loss of receipts.” More recently, we’ve found some indications that Scotland’s 48% top rate may have lost money. ↩︎
An LLP member taxed as a salaried member should use the employed option. ↩︎
See Peter Diamond and Emmanuel Saez, The Case for a Progressive Tax, Journal of Economic Perspectives (2011). ↩︎
Leave a Reply