
People often talk about the Laffer curve: the idea that if you raise a tax beyond a certain point, you may in fact reduce revenues. Laffer curve effects are rather more common in newspaper headlines than in actual tax data. But that may be about to change – we’ve a new analysis showing that Scotland’s increases in the top rate of income tax, culminating in the rise to 48% in April 2024, may now be costing Scotland around £22m of lost tax in its first year.
The 48p rate was always a political symbol rather than a serious revenue measure. The sums are trivial – a rounding error against Scotland’s £18.6bn total income tax take. But when you use tax as a symbol, people are entitled to ask what the symbol actually means. The awkward possibility is that Scotland’s gesture of asking more from its highest earners is costing more than it collects.
The Sunday Times has more on the story here, including a response from the Scottish Government (which doesn’t engage with the data).
Updated on 1 August 2026 with a response to the Future Economy Scotland article.
The Scottish rates
After a series of increases, Scotland now has six income tax bands and the highest income tax rates in the UK:
This understates the complexity because of the interaction with National Insurance thresholds, child benefit claw back, and the personal allowance taper – sometimes the gap is much wider than the headline rates suggest.1
Back in 2021, the Scottish Fiscal Commission acknowledged that the first increase in the Scottish rates, which took the top rate from 45p to 46p, “raised limited additional revenues, and might even have resulted in a small loss of receipts”. That didn’t stop two subsequent increases in the rate.
The April 2024 increase
In April 2024, Scotland’s top rate of income tax went from 47p to 48p (compared to 45p in the rest of the UK). At the same time, a new “advanced rate” of 45% appeared on income between £75,000 and £125,140 (the rate in the rest of the UK is 40%).
The revenue projections for the new 48p rate were unusual.
If we just multiplied the new tax rate by the number of people earning that amount, we’d expect it would raise £53m – so that’s the “static” revenue estimate.
But we have to adjust for “taxpayer responses” – avoidance2, reduced effort and migration. That is normal, particularly when you get to higher incomes, where people often have control over how much income they declare, in what form, and in which year.3 But when the Scottish Fiscal Commission applied the normal approaches, they came out with an unusual result – 85% of that £53m disappeared in taxpayer responses, leaving only £8m of revenue.
The problem for Scotland is that its ability to raise income tax is constrained by the rest of the UK. For someone with a permanent home in the UK, moving to another country is a fairly big deal. Moving4 from Scotland to the rest of the UK (and vice versa) is far easier.5 For people with two homes, on either side of the border, it can be a judgment call.6
Migration is an actual real-world step, but most of the taxpayer response will be fictional – people doing things which only make a difference on paper. That’s always the case, but Holyrood’s limited devolved powers make the situation worse. Whilst Holyrood can set its own income tax rates for employment and self-employment income, everything else – dividends, savings income, capital gains, the personal allowance, and every relief – remains reserved to Westminster.7 A Scottish company owner who pays herself in dividends rather than salary leaves the Scottish tax base without moving house.8 So does a Scottish employee making an additional pension contribution. Both are cheap, legal and immediate.
These effects can be quantified and (to a degree) predicted. That astonishing 85% fall from the static estimate came from HMRC figures analysing the moment in 2018-2019 when Scottish rates started to diverge from the rest of the UK.9
To state the obvious: £8m is a very small amount, and the figure comes with a great deal of uncertainty.10 The measure could raise more than this, but it could raise less – and eight million is close enough to zero that it could lose money. The IFS speculated that Scotland’s top rate rises “may have reduced revenues”.
We covered all of this in our piece on the Laffer Curve and in an episode of Untaxing on Radio 4. I congratulated the Scottish Government on conducting about as close to a controlled experiment as tax policy gets: same currency, same labour market, no border – and the rest of the UK three points cheaper. I couldn’t wait to see what happened.
We now have some data.
On 9 July, HMRC published the first outturn covering a full year of the 48p rate. So guesses, hypotheses, and estimates can be checked against reality.
What the data shows
HMRC publishes the tax raised in each band, for Scotland and the rest of the UK (which I will rather clumsily write as rUK). It also publishes the number of taxpayers in each band.
It is then trivial to calculate the taxable income declared by these taxpayers and the taxable income per taxpayer:
| Scotland | Rest of UK | |
|---|---|---|
| Top rate above £125,140 | 47% → 48% | 45% → 45% |
| Taxpayers above £125,140 | 35,400 → 41,400 (+17%) | 731,400 → 805,200 (+10%) |
| Tax raised in that band | £1,876m → £2,069m (+10%) | £54,978m → £63,797m (+16%) |
| Implied income in that band | £3,991m → £4,310m (+8.0%) | £122,172m → £141,771m (+16.0%) |
| Income in band, per taxpayer | £112,754 → £104,202 (−7.6%) | £167,039 → £176,070 (+5.4%) |
Scotland’s total income above £125,140 grew 8% – less than rUK, but still respectable. But the number of Scots above the threshold grew 17%. So the income per taxpayer, the last line in this table, fell.
Is that a one-off?
One way to get an overall picture of what’s going on is to calculate the ratio of Scottish top rate income per taxpayer to UK top rate income per taxpayer.11 We expect the ratio to be less than one, because UK top incomes are higher. We don’t necessarily expect it to have changed over time.
But it has:
For seven years the ratio sat in a band between 73% and 81%, wobbling but going nowhere, and apparently unaffected by the 2018 rise in the top rate. Then, in the years of the rise to 47p and then 48p, it falls to a level well below everything that came before.12
Other HMRC data has additional support for the idea that this is people who can control their income (e.g. landlords, investors and company owner-managers), managing it down. This chart shows Scottish tax as a proportion of UK tax, separating out self-assessment income tax from PAYE income tax:13
Scotland’s share of PAYE14 in 2024-25 was 8.43% – off its recent high, but statistically indistinguishable from the eight years before it.15
Scotland’s share of UK self assessment income, by contrast, fell to 4.90% – a statistically significant drop.16
I think it’s better practice to look at Scotland’s relative change in self-assessment income against the rest of the UK, but the absolute figure felt as well – from £6,598m to £6,503m. This was only major part of the Scottish tax statistics to see a fall- PAYE rose 16%.17
So we have two independent comparisons: the fall in the income ratio against the rest of the UK, and the drop in self-assessment income (in both relative and absolute terms). Both are consistent with our hypothesis that high earners who can control their own income are doing so to minimise their 48p liability.
What it has cost
If our hypothesis is correct, we can estimate the loss in tax caused by the 48p rate:
- Take the taxpayers who were already in the £125,140+ band, stripping out the new entrants. Let’s assume for the moment that the new entrants are £4,000 above the top rate threshold, i.e., their income is £129,140.
- Ask what the already-in-the-data taxpayers would have declared if their incomes had grown like their counterparts’ in the rest of the UK. This is a critical assumption upon which our estimate will rest. I discuss below whether it is in fact a reasonable assumption to make.
- That gives a Scottish top rate base of about £4,646m — 7.8% bigger than the £4,310m actually declared
- Tax all of it at 45% and it raises £2,091m., against the £2,069m top rate tax actually collected.
- So the 48p rate cost Scotland about £22m.
If we change that assumption, the result changes (because the higher amount we allot to new entrants, the lower the income of people who were already here, and the more pronounced the estimated loss of tax revenue):
What income should we assume for new entrants into the data? They are mostly people dragged over a frozen £125,140 threshold by a year’s pay rise, so on average they will sit only a little above it – about half a year’s growth, or roughly £4,000, which gives a cost of about £22m.
That figure is very cautious: some entrants arrive well above the threshold – movers into Scotland, a growing business, or one-off bonus years. So £22m is our central estimate; the range is £15m–£30m.18
How does this compare with the previous estimates from HMRC and the Scottish Fiscal Commission? That depends on what we think the taxpayer response we’re seeing is a response to:
- If the fall in 2024/2025 is a delayed response to the whole of the three-point gap with the UK, then it’s more than the SFC expected, but within HMRC’s expected range of taxpayer responses (and the HMRC figures always implied the Scottish rates could lose money).19
- But if the fall reflects the increase to 48p then it’s a huge taxpayer response20, much greater than anything expected by HMRC or the SFC, or indeed in the literature.
There is a reason to think that “delayed response” reading is the right one. Migration and incorporation are not small decisions, and they’re not quick decisions. It also fits the shape of what we saw in the statistics — two consecutive falls rather than a single step.
So that chart at the top of this article comparing the static revenue from the 48p increase to the dynamic revenue may have understated the problem. Even if we look just at the impact of the 1p rise and not the two rises before it, the chart looks like this:21
Couldn’t it just be volatility?
The most thoughtful challenge to this analysis22, from Future Economy Scotland, is that Scottish top incomes are volatile – they swing about from year to year far more than the UK’s. So the 2024-25 fall might just be one of those swings, with nothing to do with tax.
FES is right that the numbers are volatile. Here’s the annual gap between Scottish and rest-of-UK top-income growth, and it does indeed lurch up and down:23
Rather than just eyeballing this, it’s useful to run some statistical tests to see if the 2024/25 result is plausibly explained by the historical volatility.
First, against the normal range. The grey band in the chart marks the range the gap normally stays within – two standard deviations either side of its average.24 The 2023-24 fall sits just inside that band; the 2024-25 fall breaks below it. Put through a formal test, 2023-24 is about a one-in-eleven year and 2024-25 about one in twenty.25
Second – the two largest annual falls in the whole record are the two most recent. If the year-to-year changes had come in a random order, that would happen only about one time in 28.26
Third, we went back further. FES point to a longer HMRC series – taxpayers with total income of £150,000 or more – which we can take right back to 2010-11, the first year that band exists. It isn’t the same measure as ours – it stops before 2024-25, it includes dividends (which we’d expect to be more volatile), and it compares Scotland with the whole UK rather than just the rest of it. Here it is, on the same format as the first chart:27
This longer series is no more volatile than ours – a standard deviation of about 6 points over 2010-24, essentially level with our own 6.28
A 13-point fall would be outside the normal range of either series.
FES make two further points. They note that the 2023-24 cut in the top-rate threshold (from £150,000 to £125,140) pulled proportionally more people into Scotland’s top band than the UK’s, which would mechanically drag Scotland’s average down. That’s a fair point about 2023-24 – but 2024-25, the larger fall, compares a £125,140 threshold with a £125,140 threshold, so composition from the threshold change can’t explain it.
They also show that an alternative ratio built on total income actually rose in 2023-24, rather than falling. This is, however, consistent with our hypothesis. If high earners move income out of salary and into dividends, it leaves the Scottish tax base (NSND – non-savings, non-dividend income) – while remaining in a total-income measure. On our hypothesis NSND should fall but total-income should not.
Two further points are worth making. FES suggest Scottish top incomes grew more slowly than the UK’s “over the period” – but that period includes the two disputed post-policy years. Before the policy, from 2016-17 to 2022-23, the Scotland-to-rest-of-UK ratio was essentially flat (73.3% to 74.6%), with no pre-existing downward trend for either volatility or slow Scottish growth. The fall is confined to the two years the rate went up.
There is no sign of an exodus. In 2024-25 – the year the top rate reached 48p – the number of Scottish top-rate taxpayers grew.29 That is not contrary to our hypothesis, which is about income management, not migration.30
So, if we step back from the numbers, “random volatility” isn’t a good explanation:
- the fall came in two consecutive years – the two years Scotland put its rate up to 47p and then 48p;
- it reached a record low and fell further the next year;
- a separate, suggestive cross-check – Scotland’s share of UK self-assessment – drifted down in the same two years.
Taken together, these results show that the recent fall is unusual. They do not rule out random volatility: the clean 2024–25 result is a roughly 5–7% lower-tail event under our two simple models, and the two-year test is complicated by the 2023–24 threshold change. Our point remains: the absence of a pre-existing downward trend, the timing of the two falls and the separate self assessment evidence all make tax-related income management the most plausible explanation that’s consistent with the evidence.31
But is our hypothesis correct?
We need to be very careful here. The data is consistent with our hypothesis, but it certainly does not prove it. There are potential counterarguments and alternative explanations:
- It could just be noise in the data. Our simple tests found the two movements to be statistically significant, but that doesn’t stop them from being pure chance. These are nine-point annual series, and tests on so few observations are inherently fragile.32
- There was no such effect first time Scotland raised its rate. This isn’t very surprising. The 2018-19 rise created a divergence of only 1 point against the rest of the UK, where today’s is 3 – and behavioural response scales with the size of the gap, not the size of the change. But important to note, there absolutely was an actual effect found by HMRC from the 2018-19 rise, analysing their much more detailed data – but the methods we’re using here to analyse the published headline data aren’t able to detect the 2018-19 effect.
- Non-tax effects. There could be non-tax effects that mean that Scotland is attracting a disproportionate number of people just over the top rate threshold. For example, and this is simply illustrative, what if there had been an increase in the number of mid-level hospital consultants in Scotland? I don’t know if there are any real effects like this.
- It could be the North Sea, not the tax.33 Scotland has a reasonably large and gas sector, which is both highly paid and shrinking. Offshore incomes are dropping, and this is mostly a Scotland-specific effect – so could this create an apparently anomalous drop in Scottish high incomes? Yes, but not large enough to explain this data. Two reasons for this. First, the last genuine oil price crash, in 2020, didn’t have this kind of effect34Second, the income that has gone missing is far larger than the sector could plausibly account for.35 the element that would definitively settle this would be separating out top rate taxpayers by region to seewhether this is an Aberdeen story or a Scotland-wide one. Only HMRC holds that data.
- The rest of the UK saw a large increase in its aggregate top-rate tax base. Income falling above £125,140 rose by 16%, but most of that reflects a 10% increase in the number of additional-rate taxpayers as frozen thresholds pulled more people into the band. Income in the band per taxpayer rose by 5.4%, broadly in line with economy-wide nominal earnings growth. That still leaves open the possibility that differences in the composition of top earners – for example, London finance and professional-services incomes – made the rest of the UK an imperfect counterfactual for Scotland. That would not explain the anomalies in the two Scottish data series, but it could mean that our estimate of the revenue loss is too high. It’s even possible that Scotland’s high earners would have grown their incomes more slowly than the UK’s regardless of tax. If so, the rest of the UK is simply too high a benchmark, and a fair comparison (if we had the data to do it) might show the rise raised money after all.
- The UK data is an estimate. £4,272m of the rest-of-UK figure is an estimate for unreconciled PAYE cases (i.e. where HMRC has not finalised the position).36 For whatever reason, HMRC seems much further behind than it was this time last year when only £291m was an estimate. The Scottish equivalent is £37m. These estimates are allocated across bands by modelling rather than observation (because the observations are not complete). This could distort the results – for example, if there was a correlation between cases being unreconciled and the amount of tax paid by a taxpayer.
We will have a little more clarity in a year’s time – next year’s data will at least resolve whether this was a blip or a real trend. However, if we are to understand what the trend really means, then we will need more detailed data than the very macro numbers used in this analysis.
For example:
- Bunching analysis around £125,140 on the HMRC Survey of Personal Incomes. If people are managing income down to the threshold, there would be a “spike” around £125,140 in Scotland and not in England. It’s a standard technique, and HMRC has the data to do this easily. However, there is no public data which provides anything like the necessary granularity.
- Pension contributions and dividend income for Scottish taxpayers above £100,000 or so. On our hypothesis, both jumped in 2024-25. There is no public data on this.
- Monthly address-change data. Possibly we’ll see increased migration, although my bet is that the effect is dominated by pension contributions and dividends. If it were migration rather than income-shifting, it would be slower to appear – and it would show up here first. Again, there is no public data.
Until we get that kind of data, all we have is a hypothesis.
Scotland would not be the first to find its top rate parked on the knife-edge of the Laffer curve: when the UK itself ran a 50p additional rate from 2010 to 2013, the revenue effect turned out to be so close to zero that no one could agree even on its sign.37
We finish where we started. None of this is really about the money. £22m is a rounding error in the Scottish budget, and always was. But that is precisely the point: the 48p rate was never chiefly about raising money. It was intended to demonstrate that Scotland taxes its highest earners more heavily than England. The emerging evidence suggests that some of those earners have responded – and that the price of the gesture may be negative revenue.
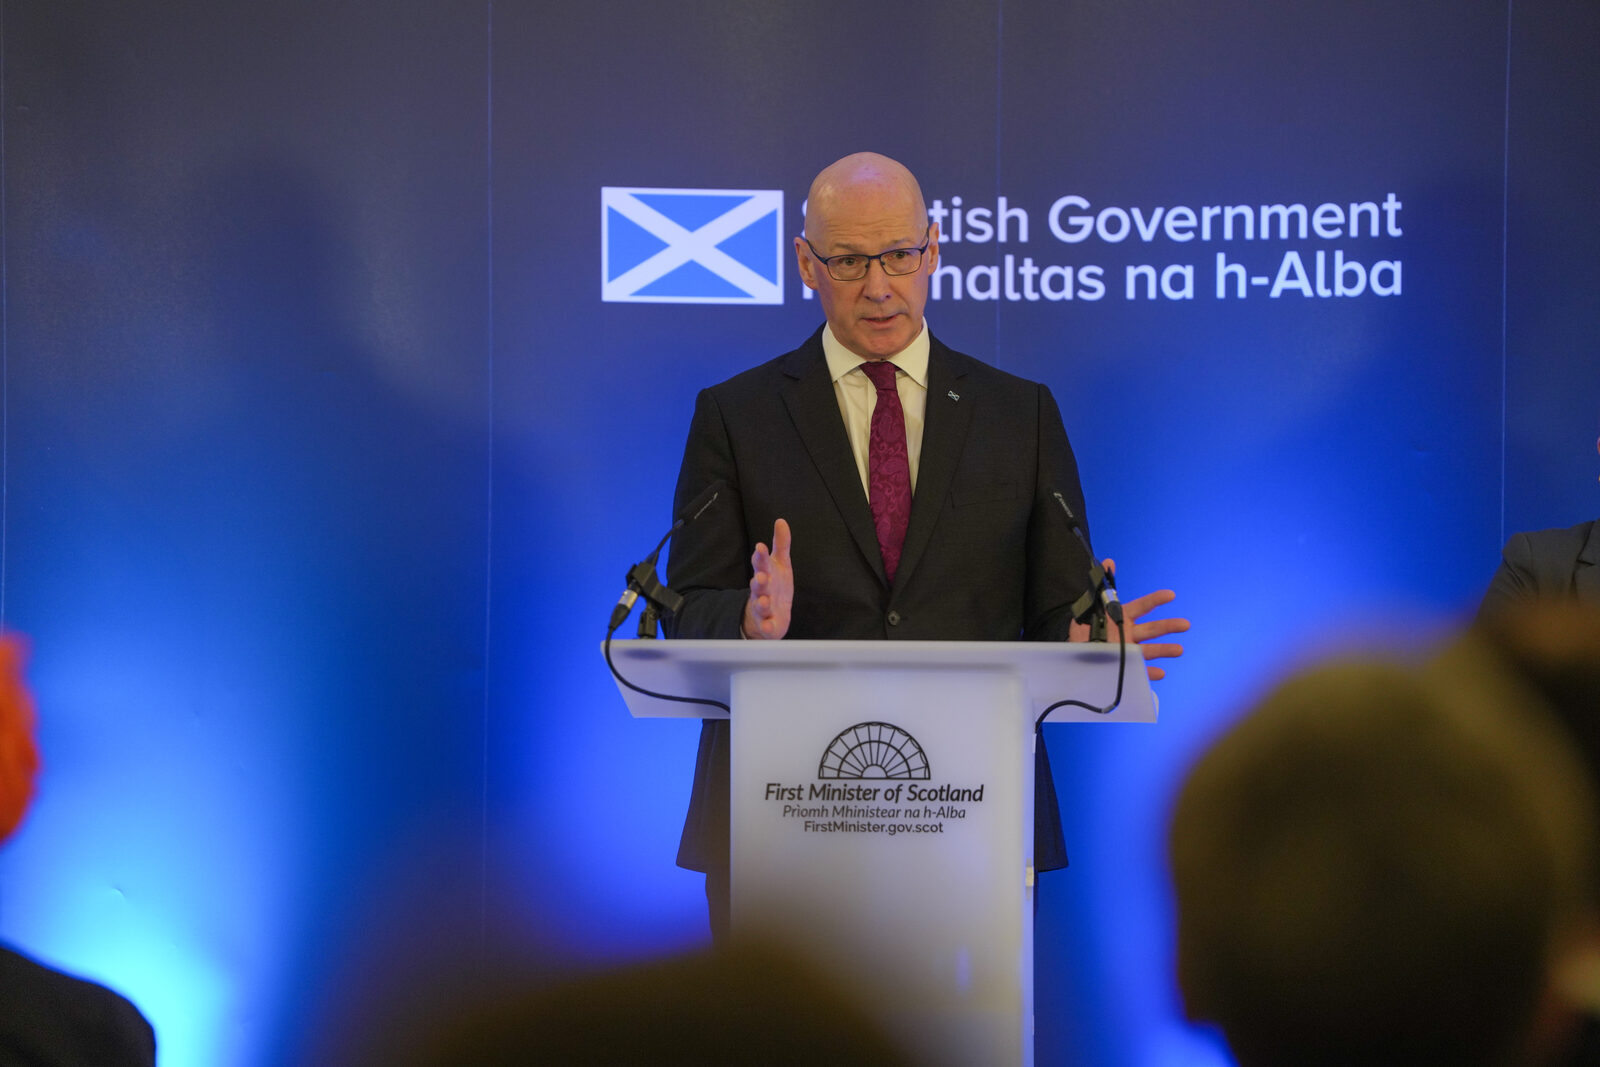
Photo of First Minister John Swinney speech in Scotland on 27 November 2024 by the Scottish Government, via Wikimedia Commons. Licensed under CC BY 2.0.
Disclosure: I was a member of the Scottish Government’s Tax Advisory Group. The group was not consulted on the decisions to introduce or set the rates discussed in this article. The Scottish Government disbanded the group in February 2026.
Thanks to F and K for help with the elasticities and reviewing the statistical tests.
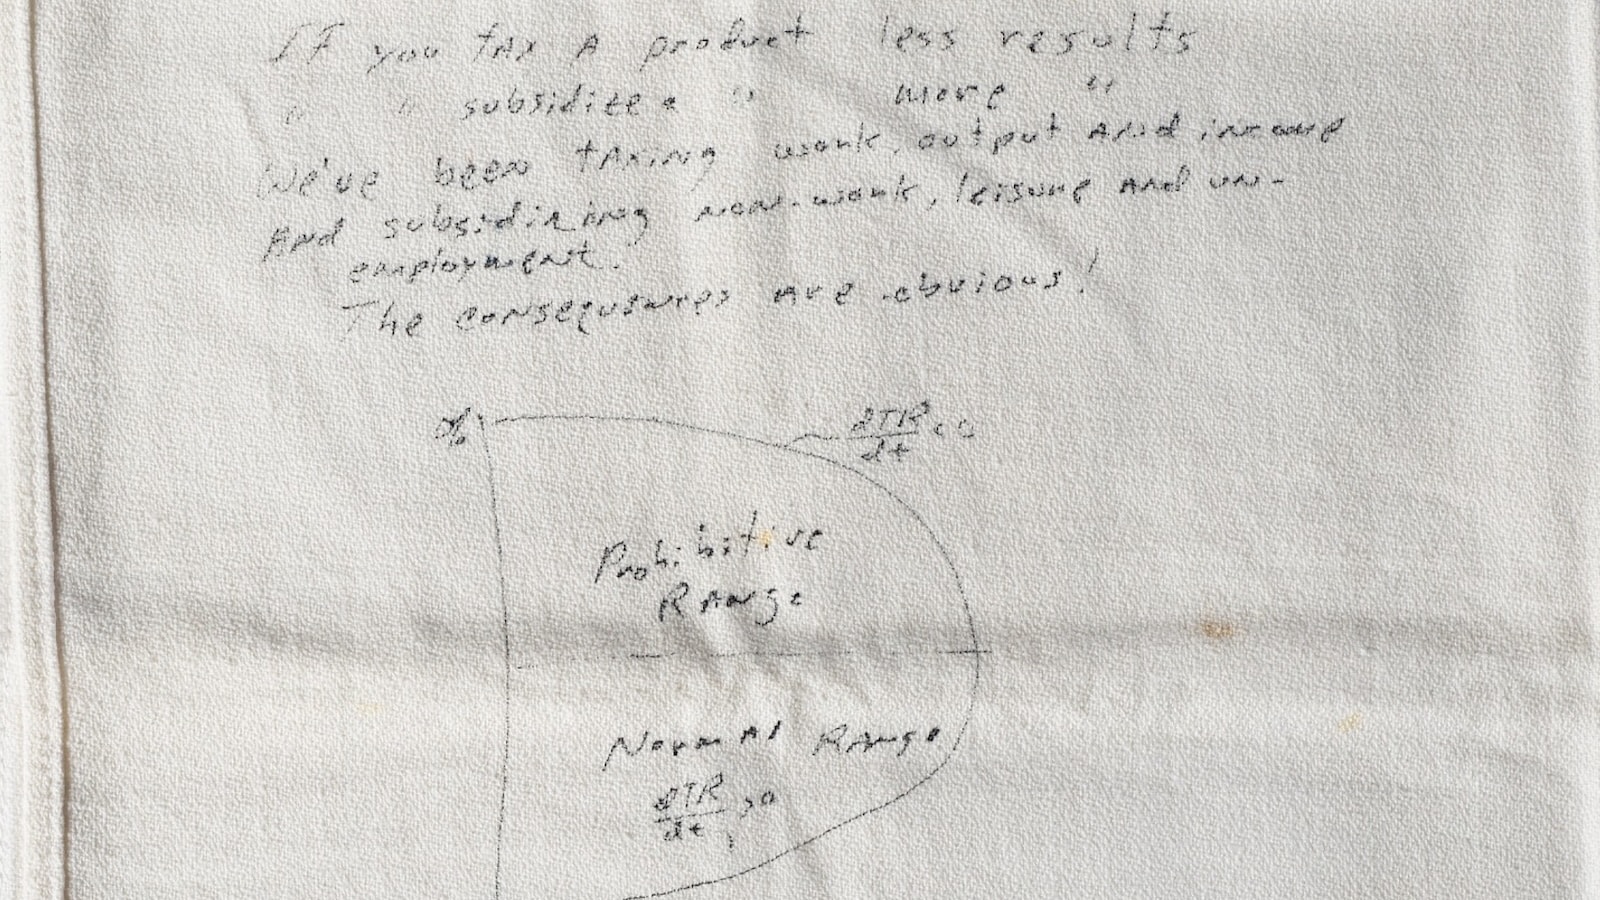
Untaxing – The Laffer curve, and the napkin that changed the world

Tax cuts and tax rises: do tax cuts pay for themselves?

John Healey should cut National Insurance, not raise the personal allowance

The Scottish Budget – four thoughts on a tiny tax cut
Are UK workers over-taxed? The answer in four infographics

The tax longlist – 35 ways Rachel Reeves could raise £22bn
Footnotes
The personal allowance is withdrawn between £100,000 and £125,140, so every extra £2 of income there creates £3 of taxable income. In Scotland that produces a marginal rate of 69.5%, against 62% in England. 45% advanced rate multiplied by 1.5, plus 2% employee national insurance. The English equivalent is 40% multiplied by 1.5, plus 2%. ↩︎
I am using the word “avoidance” in the loosest possible sense. This rarely means traditional artificial tax avoidance schemes and usually means what would ordinarily be called “tax planning”. I talk more about the specific steps people take below. The important thing is that this category of taxpayer response does not involve a change in the work undertaken, merely a change in the tax consequences of that work. ↩︎
The standard survey is Emmanuel Saez, Joel Slemrod and Seth Giertz, “The Elasticity of Taxable Income with Respect to Marginal Tax Rates: A Critical Review”, Journal of Economic Literature 50(1), 2012, pp.3–50 – which suggests that the UK top rate of tax is already very close to the revenue-maximising level. ↩︎
Scottish income tax uses a residence concept, similar to the usual UK residence concept, and so essentially based on where you live and not where you work ↩︎
The international evidence says migration is real, concentrated at the very top, and usually second-order. The closest analogue is probably Spain, which devolved income tax rates to its regions: the elasticity of the number of top taxpayers in a region to its net-of-tax rate is about 0.85 — large, but still small enough that the mechanical revenue gain from a higher rate exceeded the loss from people moving away. See David Agrawal and Dirk Foremny, “Relocation of the Rich: Migration in Response to Top Tax Rate Changes from Spanish Reforms”, Review of Economics and Statistics 101(2), 2019, pp.214–232. A contrasting position from Arun Advani, David Burgherr and Andy Summers, “Taxation and migration by the super-rich”, CAGE working paper 630. US administrative data on every million-dollar earner over thirteen years finds millionaire migration between US States to be rare: Cristobal Young, Charles Varner, Ithai Lurie and Richard Prisinzano, “Millionaire Migration and Taxation of the Elite: Evidence from Administrative Data”, American Sociological Review 81(3), 2016. For a survey, Henrik Kleven, Camille Landais, Mathilde Muñoz and Stefanie Stantcheva, “Taxation and Migration: Evidence and Policy Implications”, Journal of Economic Perspectives 34(2), 2020, pp.119–142. HMRC has separately studied cross-border movement between Scotland and the rest of the UK: HMRC, “Labour market participation and intra-UK migration of taxpayers”, 24 April 2024. Mobility is also higher for some groups than others — most strikingly “superstar” inventors: Ufuk Akcigit, Salomé Baslandze and Stefanie Stantcheva, “Taxation and the International Mobility of Inventors”, American Economic Review 106(10), 2016, pp.2930–2981. ↩︎
See Joel Slemrod and Wojciech Kopczuk, “The optimal elasticity of taxable income”, Journal of Public Economics 84(1), 2002, pp.91–112. See also Joel Slemrod, “Income Creation or Income Shifting? Behavioral Responses to the Tax Reform Act of 1986”, American Economic Review 85(2), 1995, pp.175–180, on the hierarchy of responses: timing and re-labelling are much more elastic than real economic activity. ↩︎
Note that the 39.35% dividend rate is intentionally lower than the main income tax rate because profits paid on a dividend will usually have been subject to corporation tax. The 39.35% rate is set so that when combined with corporation tax: the overall level of tax is broadly equivalent to the result if wages are paid instead of dividends (employer national insurance, employee national insurance and income tax). That maths works in England with a 45% top rate of tax, but it breaks in Scotland with the 48% rate. There is a clear advantage in paying dividends. ↩︎
There is good UK evidence that owner-managers do exactly this, at a very large scale. Helen Miller, Thomas Pope and Kate Smith, “Intertemporal Income Shifting and the Taxation of Business Owner-Managers”, Review of Economics and Statistics 106(1), 2024, pp.184–201, finds that the large responses of UK company owner-managers to personal taxes reflect income shifting rather than reduced real business activity. ↩︎
HMRC’s study of the 2018-19 divergence found that, for those earning over £150,000, “a 1% reduction in income retained after tax leads to a reduction in income declared of between 0.52% to 0.77%”. See HMRC, “Estimating Scottish taxpayer behaviour in response to Scottish Income Tax changes introduced in 2018 to 2019”, 16 December 2021. For those between £43,431 and £150,000 the range was 0.12% to 0.46%. ↩︎
All elasticities are approximations and estimates. Humans react in unpredictable ways. The response to a 1% increase to 48p may be different from a 1% increase to 46p for all these reasons. ↩︎
The reason to use a ratio is that it nets out everything Scotland and the rest of the UK have in common: UK-wide earnings growth, the frozen threshold, fiscal drag, and the 2023-24 cut in the top rate threshold from £150,000 to £125,140. The alternative is to make a variety of somewhat complex adjustments to see the overall picture, all of which have potential sources of bias and error. And we wouldn’t expect the ratio to be affected by the change in the threshold because, above a high threshold, income follows a Pareto distribution closely enough that average income above the threshold is proportional to the threshold itself – van der Wijk’s law, the standard tool of the top-incomes literature (Anthony Atkinson, Thomas Piketty and Emmanuel Saez, “Top Incomes in the Long Run of History”, Journal of Economic Literature 49(1), 2011, pp.3–71). If that holds, the ratio of two countries’ average excess incomes does not depend on where the threshold is drawn. ↩︎
The effect is also confined to the very top. Below £125,140 – across the whole range from the higher-rate threshold up, which includes Scotland’s three-point advanced rate – income grew at almost exactly the same pace in Scotland as in the rest of the UK. Only above £125,140 do the two part company. Whatever is happening is happening to the people who face the 48p rate, not to higher earners in general. ↩︎
“Self assessment” is Scotland’s SA liability as a share of the UK total; “everything else” is Scotland’s total-minus-SA liability as a share of the UK total-minus-SA – mostly that’s PAYE. Figures are from HMRC’s statistical tables, Table 1. ↩︎
Strictly, the trace is a bit wider than that. It’s everything-except-self-assessment. So that will include, e.g., compliance yield as well as just PAYE. ↩︎
One-sample prediction-interval t-test, two-sided. Baseline: the eight pre-policy years 2016-17 to 2023-24 (mean 8.58%, standard deviation 0.20 percentage points). The 2024-25 value of 8.43% is 0.15 points below the baseline mean: t = −0.74, 7 degrees of freedom, two-sided p = 0.48. The 95% prediction interval for a single new year is 8.09% to 9.07%, and the 2024-25 figure is within that. So we can’t reject the hypothesis that this share is unchanged. ↩︎
One-sample prediction-interval t-test, one-sided (lower tail), because the hypothesis is directional. Baseline: 2016-17 to 2023-24 (mean 5.12%, standard deviation 0.07 percentage points). The 2024-25 value of 4.90% is 0.22 points below the baseline mean: t = −2.78, 7 degrees of freedom, one-sided p = 0.014. In other words, we would expect to see such a result by chance only 1.4% of the time. But what if the mild pre-existing downward drift in this share was some other trend, nothing to do with tax, and so we assess the 2024-25 drop as against a continuation of that trend? Then the fall is weaker – around the 7% level rather than 1.4% (and so not distinctly significant at the usual 95% point). ↩︎
the original version of this article didn’t include the absolute figure because I felt it was less important, but people are asking about it in the comments, so I have added it here. ↩︎
The method is as follows: HMRC’s tables give 35,400 top-rate taxpayers in 2023-24 and 41,400 in 2024-25, so about 6,000 are new to the band. We assume each new entrant has income e above £125,140. We then ask what the taxpayers already in the band would have declared if their income had grown like their rest-of-UK counterparts’ (stripping the same assumed entrants out of the rest-of-UK figures, so we compare like with like). The counterfactual base is the “grown” incumbents plus the new entrants at their assumed income; the cost is that base taxed at 45% minus the £2,069m actually collected at 48%. The base case of £4,000 comes from the fiscal-drag arithmetic: someone pushed over a frozen threshold by g% of nominal growth ends up on average about U×g/2 above it, which for a £125,140 threshold and 5-7% growth is around £3,000 to £4,400. ↩︎
The elasticity is 0.61 – within HMRC’s expected range of 0.52 to 0.77 for Scottish taxpayers earning over £150,000. ↩︎
Elasticity of 1.8. ↩︎
Applying the shrinkage implied by the adjusted counterfactual to the move from 47% to 48%: at 47% the base would have been £4,422m and the tax £2,078m, against £4,310m and £2,069m at 48%. On the least favourable entrant assumption, the loss is £18m. ↩︎
This section was added on 1 August 2026. ↩︎
The “gap” is Scottish minus rest-of-UK growth in average top-rate income. We measure it precisely as the year-on-year change in the natural log of the Scotland-to-rest-of-UK ratio (×100); for movements of this size that is within a fraction of a point of the plain arithmetic difference in growth rates, and we describe it that way for readability. It is equivalently the year-on-year change in the ratio charted above. ↩︎
Across the six pre-policy year-on-year changes (2017-18 to 2022-23) the gap has a mean near zero and a standard deviation of about 6 percentage points; the band is ±2 of those. Because the spread is estimated from only six numbers, we use a Student’s t-distribution for the p-values below, which is the conservative choice for such a small sample. ↩︎
On a small-sample t-test, the 2024-25 gap of −13 points is a one-sided p ≈ 0.05 (about one year in twenty); 2023-24’s −10 points is p ≈ 0.09 (about one in eleven). Modelling the ratio as a random walk – arguably the fairest way to allow for the volatility – gives p ≈ 0.07 for 2024-25. These tests are one-sided, which is the appropriate choice here rather than a convenience: the hypothesis is directional and was fixed in advance – a higher rate is predicted to reduce top-rate income – so the question is whether the gap fell, not whether it moved in either direction. A two-sided test would double the figures. ↩︎
A permutation test: shuffle the eight annual changes and ask how often the two most recent sum to as large a fall as we actually saw. It is distribution-free – it assumes nothing about the shape of the data – and, unlike a rank test on the nine ratio levels (which are serially related, so a low year tends to follow a low year and consecutive lows are not independent), it assumes only that the year-to-year changes are exchangeable: exactly the random-walk assumption behind the test above. The answer is about 1 in 28 (3.6%). Although result should be treated cautiously because the first of those two years also contains the threshold change. ↩︎
Source: HMRC Survey of Personal Incomes, Table 3.11 (“income and tax by gender, region and country”), 2010-11 to 2023-24 – the same series FES use. We take the average total income of taxpayers with total income of £150,000 or more, Scotland versus the whole UK, and compute the year-on-year change in the ratio; its standard deviation is 5.8 percentage points, against 6.0 for our non-savings non-dividend outturn measure. Our figures reproduce the year-gaps FES quote (e.g. 2018-19 and 2019-20). The series includes the large swings of 2011-12 and 2012-13, which coincide with the 50p-rate distortions of the early 2010s – we keep them in deliberately, because leaving them out (which would lower the figure to 4.7) would flatter our own argument. The script and links to the HMRC files are on our GitHub. ↩︎
I’d half-expected a dividend-inclusive series to be more volatile; in the event it is essentially the same (5.8 against 6.0). The difference is well within sampling noise – our own figure rests on just six years, so its true standard deviation could be anywhere from roughly 4 to 15 – so there is probably nothing real here to explain. Whether dividends genuinely add little to top-end volatility is an interesting question, but not one these small annual samples can settle. ↩︎
Scottish top-band headcount rose from 35,400 in 2023-24 to 41,365 in 2024-25 (+16.8%); the rest of the UK rose from 731,400 to 805,200 (+10.1%). Both years share the £125,140 threshold, so this is not the composition effect of a threshold change. Source: HMRC Scottish Income Tax Outturn Statistics 2024-25, Table 2. Faster entry does cut the other way – newcomers just over the threshold pull down the average income above it – but that composition effect is already removed from our revenue estimate: it accounts for roughly 40% of the raw Scotland-versus-UK gap, and our figure rests only on what remains. FES are right that the £22m estimate is conditional: it disappears if Scottish top incomes would otherwise have grown about 1.2 points more slowly than rUK’s. The pre-policy series provides no evidence of such a persistent growth gap, but with only six annual changes it cannot exclude one. ↩︎
There may be a real migration effect involving a handful of high income individuals, but that’s invisible in figures like these. And more significantly, but often forgotten, a reduction in normal migration into Scotland. ↩︎
It might be thought we could use this volatility analysis to wrap the revenue estimate in a formal margin of error. But I’d be uncomfortable doing that: the uncertainties that dominate here – above all, whether the rest of the UK is the right benchmark – aren’t the sort you can put neat error bars around, and doing so would dress up a genuinely uncertain number as a precise one. ↩︎
Our central estimate is itself a simple difference-in-differences – Scotland’s growth against the UK’s. What we avoided is pushing that onto so few data points with formal significance testing, where we’d risk fooling ourselves with patterns in noise. ↩︎
Thanks to Laurie Macfarlane for prompting us to look into this. ↩︎
Brent crude averaged around $42 in 2020, against roughly $100 in 2022 and about $80 in 2024 (EIA annual Brent prices). Yet in 2020-21 – the worst of that crash – Scotland’s income per top-rate taxpayer was 74.9% of the UK’s, and its share of UK self-assessment was 5.07%: both squarely within their normal range (the two charts above), and nowhere near 2024-25’s 59.2% and 4.90%. If Scottish top incomes were sensitive enough to the oil price for a mild 2024 softening to drive a record low, a historic price crash should have shown up in the numbers. It didn’t. ↩︎
The fall is roughly £8,500 of top-rate income per taxpayer, across about 41,000 taxpayers – on the order of £350m of income. Scotland’s entire oil and gas workforce is around 115,000, of whom only a small fraction earn over £125,140. For the sector to explain the whole fall, that small group would need to have lost enormous sums; and because anyone whose income drops below £125,140 simply leaves the band – which mechanically raises the average of those who remain – the incomes of those still in it would have to have fallen further still. ↩︎
Note 4 to HMRC’s statistical tables. ↩︎
HMRC’s 2012 review found the 50p rate raised only a small fraction of its static costing – around £1bn on a central estimate it stressed was highly uncertain, with an alternative calculation implying the take may even have fallen. The IFS analysed subsequenr OBR data and reckoned the UK had been “strolling across the summit of the Laffer curve”, the rate worth at most a few hundred million pounds in either direction. There’s an excellent House of Commons Library summary from 2018. ↩︎


Leave a Reply