
There are widespread reports that the Budget will increase tax on banks. This follows claims from the TUC that banks are under-taxed, and claims from UK Finance that they’re overtaxed. We’ve compared bank taxation in the UK and eight other countries, examined how much bank profits have really risen, and assessed who would pay the price of higher bank taxes.
Our independent analysis finds that UK bank taxes are higher than in New York, Dublin or Singapore, but broadly comparable to, and generally slightly lower than, those in the large European economies. Bank profits have risen, but by much less than campaigners claim. And higher bank tax would fall partly on customers, not just shareholders.
A small increase in the bank surcharge (raising around £1-2bn a year) looks low-risk in the short term, given the current high bank profits. But a large increase would move the UK near the top of the European range and carry real risks for the City (and the significant tax it generates) and, over time, for households and businesses. Any increase should be temporary and kept under review.
Have bank profits gone up?
Positive Money says HSBC, Barclays, NatWest and Lloyds:
“reported pre-tax profits of £45.7bn in 2025… just below their 2024 record of £45.9bn.”
IPPR says bank profits are:
“up by £22 billion compared to before the Covid-19 pandemic, having more than doubled“
The TUC says:
“Banks made £37bn of profit in 2023-24, up by 41% from £26.3bn in 2019-20“
These claims do three unreasonable things.
First, they ignore the effect of inflation. Prices have risen by about 30% since 2019, but all the figures above are in nominal pounds.1
Second, they look at global profits. Some large businesses choose to base themselves in the UK, but much of their profit is made overseas. In the banking sector, the exemplar for this is HSBC – about three quarters of the bank’s profit was made elsewhere (mostly in Asia).2 That shouldn’t be included in this comparison because the profits are taxed abroad and not here.
Third, they pick a low starting point. IPPR compares with 2019, “before the Covid-19 pandemic”. But 2019 was itself a poor year for these banks: their profits were depressed by PPI compensation and by a $7.3bn goodwill write-down at HSBC.
Once we account for these changes, we see that bank profits have gone up, but by much less than is often claimed. Here are the profits the five largest banks have made from their UK banking businesses since 2014:3, in 2026 money:4
Comparisons are made more difficult by the exceptional years: 2020 is Covid; the 2014, 2015 and 2019 drops are PPI compensation. But it seems reasonable to say that if we compare the current position with the post-financial crisis/pre-COVID position, bank profits are, very roughly speaking, up by about a quarter.5
Have bank taxes gone down?
The TUC says that “Tory governments slashed taxes on banks before they left office”, and its general secretary says the Treasury “has already lost £6 billion in revenue from the Tories’ senseless bank tax cut”.
These claims are misleading.
The UK has two bank-specific taxes. The bank surcharge is an additional 3% corporation tax that applies to banks.6 The bank levy is a rather more complicated beast: a percentage applied to banks’ balance sheets.7
The bank surcharge was created to prevent banks benefiting from the cut in corporation tax.8 When that cut was reversed, it was expected and rational for the surcharge also to be cut. There was no cut to the overall level of tax paid by the banks on their profits:9
But that is not the whole story, because it omits the bank levy. To compare like with like, we should look at the total tax paid by banks as a percentage of their profits, rather than just headline figures:10
We see bank taxation soaring in the post-financial crisis period because bank profits dropped but the bank levy, because it applies to balance sheets, did not. That meant the bank levy became a very high percentage of overall profit. Since then, things have been relatively stable, other than a significant fall in the bank levy from 2021, when it ceased to apply to UK-headquartered groups’ foreign subsidiaries.11
The international comparison
Comparing taxes across different countries is a difficult exercise because there are many non-tax differences between countries, and those can also change the tax result. We’ve worked with tax experts across Europe and the US and tried to make a comparison which is as transparent as possible and as like-for-like as possible.
We’ve modelled an investment bank and a commercial bank, and estimated their tax for the UK and eight other countries.12
We didn’t model a retail bank because retail banks are tied to their local retail customers, and cannot move from one country to another. We therefore don’t think it’s useful to compare different countries’ tax frameworks for retail banks.
We explain exactly how we did this, and the assumptions we’ve made for each country, in the methodology section at the end, and all our code is on GitHub.
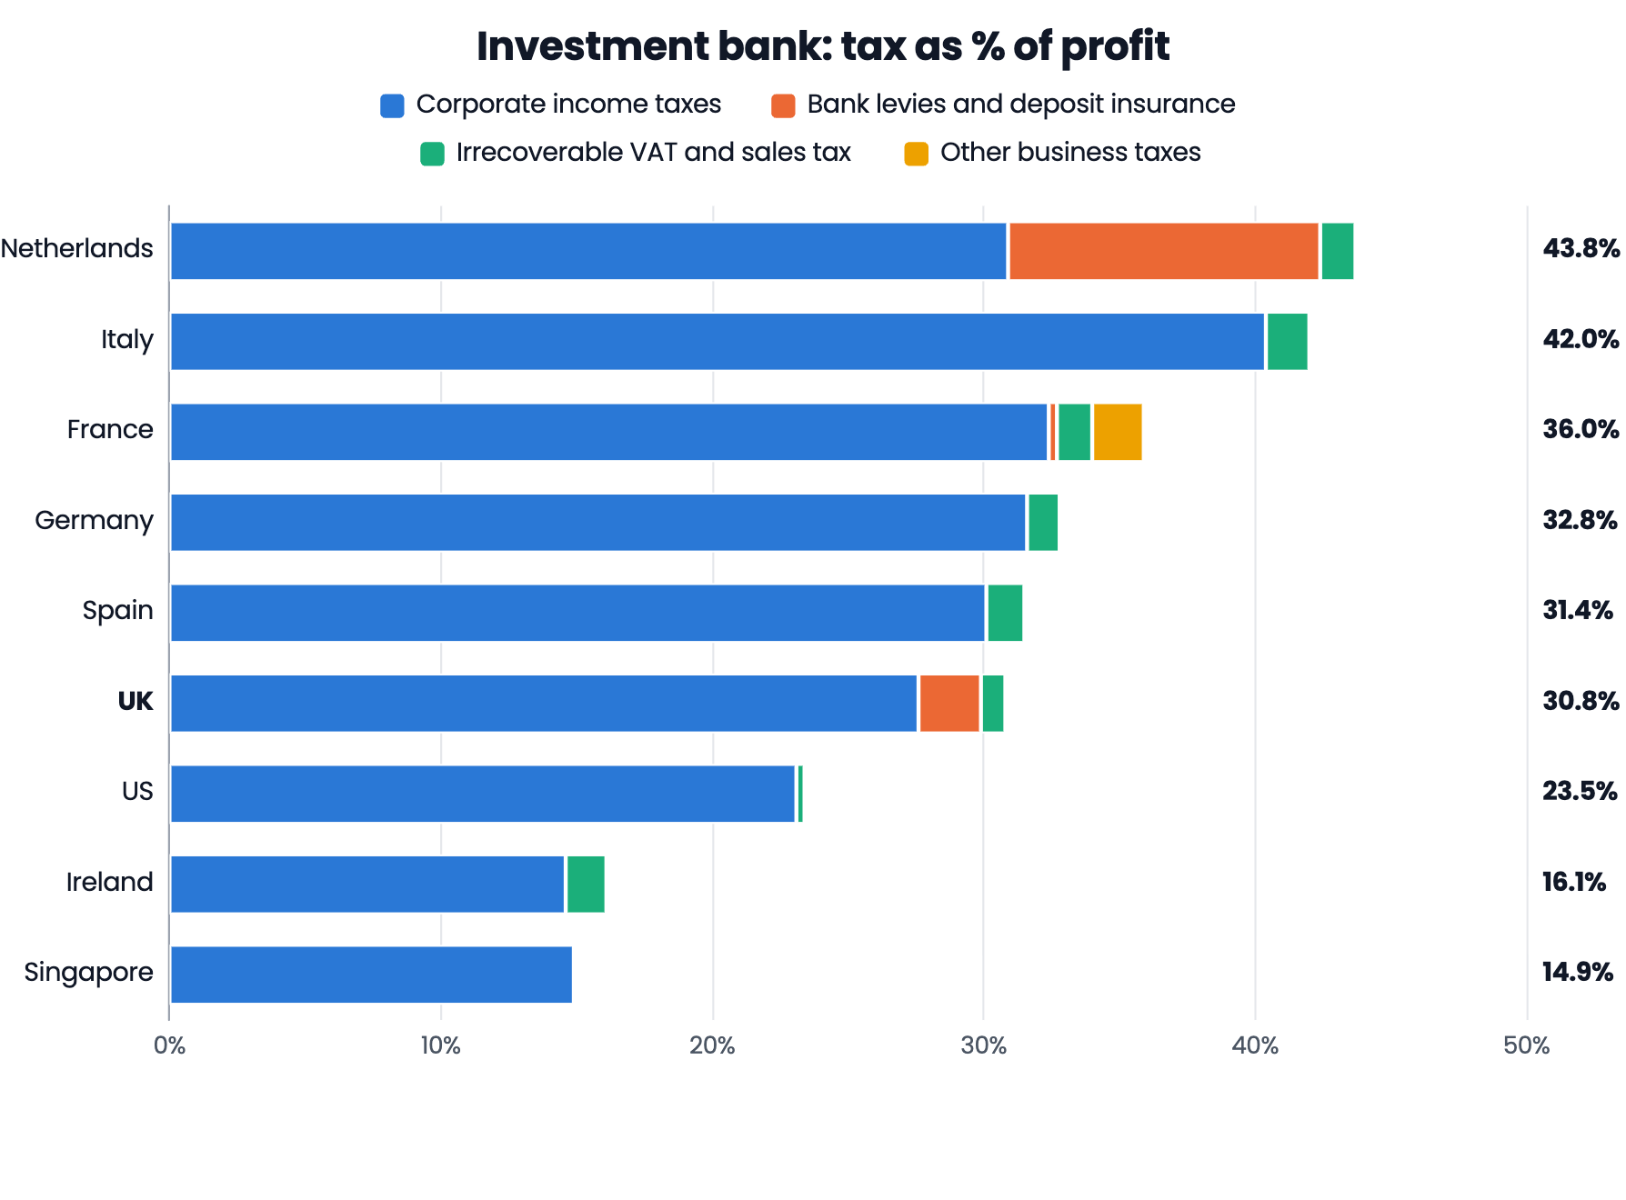
Here are the results for our modelled investment bank:
The UK’s overall level of tax is comparable to, but slightly lower than, Spain, Germany and France, and much less than Italy13 or the Netherlands14. It’s much more than Ireland, Singapore and the US.
It’s important to stress that the nature of the exercise means the figures should be regarded as illustrative rather than precise. It’s probably more realistic to view the UK as in a tie with Spain and Germany.
The overall picture doesn’t change much for our modelled commercial bank:
The US is now closer to the UK, because a commercial bank (that necessarily takes deposits) pays federal deposit insurance on its entire balance sheet.
So we conclude from this that the UK certainly doesn’t have the highest bank tax in the developed world. It’s much higher than the small financial centres, somewhat higher than the US, and broadly competitive with most of Europe.
What if we put up bank tax?
There are various proposals to increase bank taxation. The Chancellor is reported to be considering taking the bank surcharge back to 8%. The TUC has called for a 16% or even 35% surcharge. IPPR’s Budget briefing proposes “a temporary increase in the commercial bank surcharge (£1 billion)”, which suggests an increase of about 2.5 percentage points.1516 Here’s how they’d change the UK’s position:
So an 8% surcharge would move the UK from the cheaper end of Europe to the middle of the pack, and a 16% surcharge would put us near the top, second only to the Netherlands. IPPR’s 2.5-point increase makes only a small difference.
Who really pays bank tax?
There is no prize for having the world’s lowest or highest bank tax. The only question that matters is: what are the consequences?
The benefits of higher tax are obvious – more revenues for a cash-strapped HM Treasury.
The costs are less obvious.
A key question for any tax increase is: who really pays it? The easy answer is the person with the legal obligation to pay the tax – the “legal incidence”. The important answer is the person who ends up economically carrying the can – the “economic incidence”.
Here’s what the evidence says:
- The initial cost falls on bank shareholders. Bank shares fall quickly when bank taxes are announced17 – and indeed they’ve already fallen in anticipation of Budget tax increases, as they did for previous ones.18
- Over time, some of the cost moves to customers who don’t have a choice to go elsewhere. That means most retail customers19, households with an existing mortgage, savers who don’t shop around, and people with overdrafts. Banks will try to maintain their post-tax profits/return on capital, and putting up fees/interest is an obvious way to do this. Bank taxes largely fall on the four largest banks, and they have 70% of main current accounts, with only 3% of customers switching every year. If all the big banks are hit by a tax, most customers have nowhere else to go.20 This is the economic theory – and there’s also evidence21 it happens in practice.
- On the other hand, the clients of investment banks absolutely do have a choice to go elsewhere. A client of a London investment bank could, most of the time, take its business to a New York investment bank. So an investment bank will have a hard time passing on the cost of tax increases to its customers. Instead the cost will be mostly borne by shareholders, and somewhat by its employees22 (i.e. lower bonuses).23
- The clients of commercial banks are somewhere between these two extremes. Larger businesses can tap the bond markets; to some degree businesses can borrow Sterling from the London branch of foreign banks (who are often too small to be impacted by the bank levy or the surcharge; but their size also limits their capacity to pick up business).
- In theory, the extent to which the cost falls on savers vs borrowers likely depends on whether market conditions are such that deposits vs loans are in more demand. The actual evidence on the extent to which the burden of bank tax falls on customers is complex and (as far as we are aware) none of it comes from the UK – but it is reasonably clear that there is an impact on customers who are, in practice, locked into their bank.24
- Where the incidence is borne by shareholders and senior management then investment banks (in particular) will have an incentive to reduce their investment in the UK and increase their investment abroad. That, in principle, means a loss of jobs in the UK and, in the long run, a reduction in tax in the UK. PAYE is ten times the surcharge and levy combined, so even small behavioural effects matter (albeit slowly, over many years, as jobs are “sticky”).
- But whilst people move slowly, profit can move quickly. German evidence suggests25 that a one percentage point higher tax rate reduces the fixed-income trading assets banks book in a country by 3% to 4%, and their trading derivatives by 9%. Scaled up to a five-point rise in the surcharge, that would be about 15% of fixed-income trading and over a third of derivatives. The profits that stay would be taxed at 33% rather than 28%, so tax from fixed-income trading would be roughly unchanged, but tax from derivatives trading would fall by about a quarter.2627
- Banks are unusually good and fast at responding to tax changes. One study finds that multinational banks’ reported profits respond about twice as strongly to tax as previous studies found for other multinationals.28
- It’s reasonably clear that bank business lending is an important driver of growth – and if a bank tax ate into the capital banks need to lend then that could reduce lending. But banks paid £7.7bn to shareholders in the first quarter of 2026, and the Bank of England says lending isn’t being held back by a shortage of capital.
- UK Finance told the Chancellor in a letter that a 5% increase in the bank surcharge would reduce lending by about £10bn.29 UK Finance hasn’t said where this figure comes from, and so we cannot give it much credence.
- The share price changes have been obvious, but nobody has ever measured any of the other effects for the UK. The OBR has never noted a material impact beyond the banks themselves.30 Other effects have only been noted in passing.31 The clearest statement came from Andrew Bailey, the Governor of the Bank of England, who said in January that additional taxes on bank profits would impact customers’ saving and borrowing rates.
So what should the Chancellor do?
We take no position on whether the overall level of tax should go up, go down, or remain the same.
But if the Chancellor does want to increase taxes, our view of the evidence is that a small increase – say around £1-2bn/year – should be low-risk in the near-term.
The Bank of England does not currently see capital as the binding constraint, and past surcharge changes were judged by the OBR to have little material macroeconomic impact.
But caution is required. Even in the current context, we may see an impact on the competitiveness of the City – the competition from New York and Singapore is real, and it wouldn’t take much response for reductions in PAYE and corporation tax to wipe out the £1-2bn raised. When and if bank profitability drops, then any surcharge increase becomes more likely to be passed on to the banks’ clients, and potentially impact lending.
So if there is to be an increase, it should be a temporary one. Not temporary in the sense that income tax was temporary, but really, truly, temporary. And a tax with a definite and credible end date would be less likely to trigger medium- and long-term relocation effects.
Why are our figures different from the industry figures?
Every year UK Finance publishes a report by PwC comparing the taxes a model bank would pay in five financial centres. This year’s report, published on 21 October, puts London at the top:32
It’s hard to assess these figures because the methodology is not published. We found an error in the UK Finance/PwC figures for last year – they didn’t allow for the £100m allowance before the UK bank surcharge applies. To do that we had to reverse-engineer these calculations – not a small piece of work. To their credit, UK Finance and PwC have admitted the error and corrected it in their 2026 report.33
Our position is that nobody should accept figures from industry groups and other lobbyists unless they publish their methodology in full.
But having been through PwC’s figures we can say we don’t agree with them. In two cases it’s a judgment call; in one case we think PwC made a mistake (in addition to the surcharge point that’s now fixed).
The first judgment call is that PwC includes employer national insurance/social security. It’s the single biggest reason London looks expensive in PwC’s figures: 13.1% of profit in London, against 3.5% to 9.7% elsewhere, where social security contributions are capped or charged at lower rates.34 But in the long run the economic cost of employer national insurance falls mostly on employees, through lower wages. If employer national insurance didn’t exist then, in the long run, banks’ payroll costs wouldn’t change much (because wages would rise). So it shouldn’t be included in this comparison, and we exclude it. Note that if we apply PwC’s approach to France and Italy then social security results in extremely high rates – 54% for France and 49% for Italy.35 There is a counter to this, which is that senior investment bankers and traders are internationally mobile and negotiate compensation in a global market – people in this category represent something like a third of banks’ payroll cost.36
The second judgment call is that PwC also includes business rates. The evidence is that, in the long run, most of the burden falls on landlords, through lower rents.37 So we exclude it too.
Then the mistake: most of the services provided by banks are VAT exempt. That has an obvious consequence: banks don’t charge VAT on, for example, account fees. But there’s a less obvious consequence: banks can’t recover VAT on their own costs (for example, legal fees or the costs of purchasing computer equipment). PwC assumes banks recover 60% of the VAT on their costs, in the UK and across the EU.38 But Brexit makes this badly wrong. An EU bank can recover VAT when it supplies a service to a customer outside the EU. A UK bank can recover VAT if it supplies a service to a customer outside the UK.39 A UK bank with identical international business to an EU bank will have a very different VAT recovery position. Our model accounts for this, but PwC’s does not.40
Here’s how PwC’s figures reconcile to ours, for the five cities we both cover:41
Methodology: how we compared bank taxes
Cross-border tax comparisons always have to be viewed with caution. There’s a balance to be struck between, on the one hand, having an approach that’s so simplified it’s meaningless, and, on the other hand, having an approach so complex that it introduces numerous unverifiable and subjective assumptions. We’ve tried to balance this, but nobody should take our figures as representing any kind of absolute truth. Our model, the figures we took from each bank’s accounts and our reconstruction of PwC’s model are all on GitHub, so anyone can check our working or change our assumptions.
We start by taking two real banks:
- an investment bank – Goldman Sachs International, Goldman’s main UK broker-dealer (we used its 2025 accounts).
- a commercial bank – SMBC Bank International, the UK bank of the Japanese SMBC group (using its accounts for the year to 31 March 2026 and leaving out its Paris branch).
We then construct a broadly accurate model of each country’s tax system, and apply it to each of the banks. We only include the taxes that, on the evidence, the bank itself (or, rather, its shareholders) bears: corporate tax42 and its local equivalents; bank levies and other bank-specific taxes; contributions to deposit guarantee schemes and resolution funds; and the VAT (or, in the US, sales tax) a bank pays on its costs and can’t recover. As we discuss above, we leave out employer payroll taxes (such as employer national insurance) and property taxes (such as business rates), because the evidence is that they fall mostly on employees and landlords respectively. We also leave out stamp duties and transfer taxes (borne by clients), and the income tax banks deduct from their staff’s pay, which the staff bear.
We then make a series of simplifying assumptions:
- Each bank is a standalone domestic company with no parent, no subsidiaries and no foreign branches. But we apply the OECD global minimum tax (relevant to Ireland and Singapore) as if it was part of a group.
- It carries on exactly the same business, with the same customers, the same balance sheet and the same profit (£2.86bn for the investment bank and £424m for the commercial bank).
- Each bank has traded steadily for years and has no past losses to use, so one-off timing effects (for example, share awards that are deductible in a different year from when they’re expensed) are smoothed out. This assumption is extremely wrong for real banks, particularly Continental banks, which often have significant carried-forward losses.
- There are no special tax breaks/reliefs – again this is often wrong for Continental European banks.
- Where tax varies within a country, we use the main financial centre: Frankfurt for Germany, Lombardy (Milan) for Italy and New York City for the US.
- The rules are those enacted by 9 October 2026 (19 October for Ireland, and 20 October for the Netherlands and Singapore), as they’ll apply in 2027. There’s one exception: we assume France extends its “exceptional contribution” into 2027, as its budget bill proposes.
- The EU’s Single Resolution Fund is full, and charged banks nothing for 2024 to 2026 – we assume the same will happen in 2027.
- Our investment bank takes no deposits, so it pays nothing into deposit guarantee schemes.
- Our commercial bank’s deposits come almost entirely from companies, and very few of them are covered by deposit guarantee schemes, so it pays only a bit.
No real bank could be picked up and moved in this way. If you compare one country’s banking environment with another you see numerous legal and economic differences: regulatory law (and regulatory capital in particular), employment law, levels of pay, property costs, energy costs… it is a very long list. If we magically transport a bank from one country into another country then all of these non-tax factors will impact the tax result. Our comparison ignores that. This is unavoidable – but it means our results have to be viewed as illustrative rather than definitive.
How we checked our results
We’ve checked the model against the published accounts of banks in every country. Where a real bank looks like ours (profitable, standalone, with no past losses to use), it pays close to what our model predicts: Bank of America’s French business, for example, accrued 32.9% in French corporate tax in 2025. Many real banks pay much less, because of losses carried forward, group structures, foreign branches and tax incentives. The big French groups, for example Société Générale and BNP Paribas, paid 13% to 16% on their French profits in 2025.
The following sections describe particular issues in particular countries.
The UK
Generally speaking, we were confident with the UK position because our team is familiar with UK tax, and the application of taxes to banks is well understood.
The bank levy presents a particular problem, because it’s a large component of bank taxation, but many banks don’t disclose how much they pay, and we can’t reliably calculate the tax base from published accounts.
We tested our calculation against the levies actually paid by eleven UK banks. For deposit-taking banks it’s generally within 15% to 35% of the actual figure. For investment banks it can be out by a factor of two or three in either direction, because the levy depends on netting arrangements and group allocations that banks don’t publish. Our investment bank’s £65m levy is calibrated against Morgan Stanley’s UK broker-dealer, which disclosed a $79m levy for 2025.
The Netherlands
The Netherlands is the most expensive country for our investment bank, for two reasons.
The first is the Dutch bank tax (bankenbelasting) – 0.058% on debts due within a year and 0.029% on longer term debts. It applies to the bank’s whole balance sheet less its regulatory capital, the deposits covered by deposit guarantee and a €23.5bn exemption. Unlike the UK bank levy, it doesn’t let a bank net its derivatives, and derivatives are more than half our investment bank’s balance sheet. So the bank tax is a disaster for investment banks. That doesn’t seem to have been the aim: the stated objectives were a contribution for the State’s implicit guarantee of the banks, encouraging longer-term funding, and discouraging large bonuses.
Our calculation reproduces the bank tax that BNG Bank and NWB Bank actually paid to within €0.2m.
The second is the “minimum capital rule“, which denies a bank part of its interest deduction when its equity is less than 10.6% of its leverage exposure. Our investment bank’s is 3.9%, so 7% of its interest isn’t deductible, which costs 5.0% of its profit. The formula matches what Dutch banks disclose: it gives ASN Bank’s €17m almost exactly, and nothing for BNG Bank and NWB Bank, whose equity is above the threshold.
We departed from our normal rules to prevent the Dutch result being unrealistically high:
- Dutch bank tax goes up by 10% if a director’s variable pay is more than a quarter of their fixed pay. Both of our banks’ directors are above that, but pretty obviously, they wouldn’t be in a real scenario where they were a Dutch bank. So we leave the uplift out.
- The Netherlands doesn’t allow any deduction for pay in shares, including shares in a parent company; pretty obviously, banks respond by paying staff in cash, and so we assume this happens.
- We assume interest on repos doesn’t count for the minimum capital rule. No law or ruling deals with repos directly, but the Ministry of Finance’s 2026 guidance on what counts as a loan reads as if it covers them, so this assumption probably flatters the Netherlands.
If we’d stuck to our standard approach then the overall Dutch rate for our model investment bank would be 61.4%.
Italy
Italian corporate tax (IRES) is 24%, plus a 3.5% surcharge for banks. Banks also pay a regional tax, IRAP, charged at 7.57% in Lombardy on the “intermediation margin” (broadly, net income from lending, fees and trading), with only some costs deducted (see PwC’s summary and the Ministry of Economy’s rate table).
Italy’s 2027 budget plan expects about €5bn from the financial sector in 2027, without saying how it would be raised. That isn’t in our figures; arguably, it should be, but it’s unclear how we do this when there is nothing more specific available at the moment.
France
French corporate tax is 25%, plus a “social contribution” that takes it to about 25.8%. France charged large companies an “exceptional contribution” on their profits for 2025 and 2026, and the 2027 budget bill would extend it for a third year (article 15; see KPMG’s summary). Our French contacts all expect it to pass.
For a company with turnover of €3bn or more, which includes both our banks, the bill sets the rate at 31.4% of its corporation tax. It isn’t deductible, and adds about 7.5 percentage points.
France also has two business taxes that aren’t charged on profit: the CVAE, a local tax on value added, and the C3S, a 0.16% tax on turnover. Between them they cost our banks about 2% of profit. A small French bank tax (the “taxe pour le fonds de soutien”) adds another 0.2 to 0.3 points.
French banks pay a payroll tax, the taxe sur les salaires, because most of their income is outside VAT. Like other payroll taxes it isn’t in our figures, but possibly it should be given that it’s a rough proxy for irrecoverable VAT. Our figures may therefore flatter France.
Germany
Germany has no bank levy. Its corporate tax is 15%, plus a “solidarity surcharge” of 5.5% of the tax (thus 15.825% in total). Businesses also pay trade tax to their city: 16.1% in Frankfurt.
Germany’s statutory deposit guarantee fund has reached its target and charged nothing for its last year.
There’s one important judgment call. Trade tax normally adds back a quarter of a business’s interest costs, but banks are largely exempt from that, provided their banking assets outweigh their other assets. We count the investment bank’s derivatives as banking assets.
Spain
Spain charges banks corporate tax at 30%, rather than the normal 25%. It had a temporary tax on banks’ net interest and fees, but that applied only to 2024 to 2026, so it isn’t in our figures (on the 2026 rules it wouldn’t have changed the result for either of our banks anyway).
Spain taxes customer deposits at 0.03% (the IDEC), which costs our commercial bank 1.1% of its profit.
The US
Federal corporate income tax is 21%. On top of that, New York State charges franchise tax at 7.25%, with a surcharge for the Metropolitan Commuter Transportation District, and New York City charges business corporation tax (9% for large financial corporations). State and city taxes are deductible for federal tax.
We put our banks in New York City, but New York State and City tax a bank only on the share of its receipts that comes from New York customers. About 15% of our investment bank’s business (by revenue) is with US customers, and about 3% of our commercial bank’s.43 We allocate these customers across the states in line with each state’s share of US output. New York has 8% of US output, and 19% of US finance and insurance. We put 59% of New York’s share in New York City, and tax the other states’ share at an average rate of 5.7% (derived from the Tax Foundation’s average combined federal and state rate of 25.5%). New York also lets a bank apportion just 8% of the net income from its “qualified financial instruments” (broadly, its trading book) to New York, and we assume our bank elects to do so.
There’s no US bank levy. But a US bank that takes deposits pays federal deposit insurance on its average assets less its Tier 1 capital (12 CFR 327.5), and a bank with $50bn or more of assets can’t deduct it at all (the deduction is phased out between $10bn and $50bn: section 162(r) of the Internal Revenue Code).
Our investment bank takes no deposits, so it doesn’t pay deposit insurance at all (see the FDIC’s explanation); in the US its business would be carried on by a broker-dealer, not a bank.
New York sales tax applies to goods, such as computer equipment, and to off-the-shelf software – but not to most of the services that make up a bank’s costs. So it makes very little difference.
Ireland
Irish corporation tax is 12.5% on trading income. But Ireland has implemented the OECD’s 15% global minimum tax, including a domestic “top-up” tax, and we include that.44
Ireland’s bank levy applies only to four named banks that received State support in the financial crisis (section 126AB SDCA 1999), so our banks don’t pay it.
Singapore
Singapore’s corporate tax rate is 17%, and it has no bank levy. But banks can apply for the Financial Sector Incentive, which taxes income from qualifying activities at 13.5% (10% for some activities), and the large banks we looked at all have it or a similar status.
Since 2025, Singapore has charged a domestic top-up tax to bring a bank in an international group up to 15%: DBS’s Singapore business paid about 15% in 2025, the first year of the top-up tax. So we assume our banks have the incentive and pay the top-up tax.
Our banks bear no GST, because the financial services they supply to customers abroad are zero-rated, so the GST on their costs is recoverable under the special recovery method banks can elect.
Deposit insurance premiums are negligible, and the investment bank, which takes no deposits, pays none.
Many thanks to P, G and B2 for help with the coding, L for the economic analysis, and to all the country tax specialists who contributed.

Epstein emails reveal Mandelson advising JPMorgan to threaten Chancellor over post-crisis banker bonus tax

Badenoch’s inheritance tax cut could cost £11bn – almost twice the advertised price
Capital gains tax reform was right. Now it’s dead.
England’s new tourist tax: what it raises, who pays, and what it costs

Universities UK: a £6bn lesson in bad tax policy
New data suggests Scotland’s 48p tax rate may be losing money
Footnotes
The TUC does include a real-terms figure: it says the 41% rise it found was 19% “in real terms”. ↩︎
HSBC made £22.1bn of the big four’s £45.7bn in 2025, but its UK retail and commercial bank, HSBC UK, made only £5.6bn. Positive Money’s table uses that £22.1bn figure. ↩︎
We can’t easily go back further than 2014 because like-for-like data isn’t available. Lloyds didn’t report a UK profit figure before 2014. And, before 2013, RBS’s accounts omitted PPI, the bank levy, restructuring costs and crisis costs (which were in a separate wind-down unit). Barclays didn’t split out UK cards profit before 2014. ↩︎
From 2019 we use the “ring-fenced banks” that HSBC, Barclays and NatWest have had to run since then, which hold their UK retail and commercial banking: HSBC UK Bank plc, Barclays Bank UK PLC and NatWest Holdings. Before 2019 we use the UK divisions each bank reported at the time: HSBC Bank plc’s UK retail and commercial banking, Barclays’ UK division, and RBS’s UK personal, commercial and private banking. Those divisional figures include PPI and other conduct costs, but leave out some central costs, so there will be a slight mismatch – in 2019, when we have both datasets, the difference was about £0.8bn, or 9%. Lloyds and Santander UK are almost entirely UK banks, so we use their group profit throughout. All the figures are statutory profit before tax, converted into 2026 money with ONS CPI (taking 2026 as the average of the months published so far). This leaves out the banks’ UK investment banking and markets businesses, which earn UK profits but aren’t much driven by interest rates. We’d have liked to go back further, but before 2014 the figures aren’t comparable: Lloyds didn’t report a UK profit figure, and RBS’s UK divisions left out PPI, the bank levy and the losses in its bad-bank unit. The country-by-country reports banks have published since 2014 don’t help for HSBC and Barclays, because their UK figures are dominated by holding company accounting. NatWest’s 2019 figure includes Ulster Bank in the Republic of Ireland, and Lloyds’ 2022 figure is restated for the new insurance accounting standard. ↩︎
Profits averaged £19.7bn a year in 2016 to 2018 and £24.5bn in 2023 to 2025, leaving out two one-off gains in recent years (HSBC UK’s £1.3bn gain on buying SVB UK in 2023, and Barclays UK’s £0.3bn net gain on buying Tesco Bank in 2024). That’s an increase of 24%. There are many ways one could cut the data differently. Putting the pre-2019 divisional figures onto the ring-fenced basis would take the increase to about 35%. Adding back the PPI charges at Lloyds and Barclays in 2016 to 2018 (about £2.5bn a year in today’s money) would bring it down to about 10%. But then we should also adjust for Lloyds’ motor finance provisions (£0.7bn in 2024 and £0.8bn in 2025), which would push recent years up a little. So “about a quarter” is best seen as a central figure sitting in a range of something like 10% to 35%. ↩︎
Not quite as simple as it sounds. The surcharge is charged on a banking company’s “surcharge profits”, which are its taxable profits with some reliefs taken away. Losses from before 2016, and losses surrendered by non-banking companies in the same group, can’t reduce the surcharge profits. Each group then has an allowance of £100m a year (£25m before April 2023), which it can share among its banking companies. And it applies only to “banking companies” (broadly, deposit-taking banks and the largest investment firms) and building societies (Part 7A of the Corporation Tax Act 2010; HMRC’s guidance). ↩︎
The bank levy is 0.1% of a bank’s short-term liabilities and 0.05% of its long-term liabilities and equity, on its UK balance sheet, after an allowance for the first £20bn. A lot is taken out before the rates apply: Tier 1 capital, deposits protected by the FSCS and sovereign repos are excluded, high-quality liquid assets are deducted, and liabilities can be netted against assets with the same counterparty. It isn’t deductible for corporation tax (Schedule 19 to the Finance Act 2011; HMRC’s bank levy manual). Our experience and that of other practitioners we spoke to is that the bank levy is an extremely complex tax for banks to operate. It’s more manageable for HMRC (relatively speaking) because there are so few taxpayers. ↩︎
That was the logic of the UK’s bank-specific taxes from the start. When the bank levy was introduced in 2010, the Treasury minister David Gauke told MPs that “Other sectors, including manufacturing, will benefit from the reduction in corporation tax, but the banks will not benefit because we are introducing the bank levy” (quoted in the House of Commons Library’s briefing on the taxation of banking, page 25). The levy rate was then raised in 2011 “to offset the further reduction in the rate of Corporation Tax announced in Budget 2011” (HMRC’s impact note). The surcharge took over part of the levy’s role in 2016, when it was expected to raise more than the cuts to the levy cost (see that Commons Library briefing, page 6). And when corporation tax was put back up, the March 2021 Budget said that “without any other action, due to the additional bank surcharge of 8%, the increase in the main corporation tax rate to 25% would make UK taxation of banks uncompetitive” (Commons Library briefing, page 6). ↩︎
Rates are for financial years starting on 1 April, from HMRC’s background notes to its banking sector statistics (Appendix B). The surcharge started on 1 January 2016, so it also applied to the last three months of 2015-16, which the chart doesn’t show. It only applies to profits above an allowance: £25m until 2022-23 and £100m from 2023-24. ↩︎
This is an illustrative chart because of its necessary limitations. Corporation tax, bank levy and bank surcharge are cash receipts from the banking sector, from HMRC’s banking sector receipts statistics and its tax receipts statistics. HMRC doesn’t publish banks’ taxable profits, so we estimate them by dividing banking sector corporation tax receipts by that year’s main rate of corporation tax (from HMRC’s background notes, Appendix B). That makes the corporation tax part of each bar simply the main rate; what the chart really shows is how much the levy and surcharge add on top (which is the useful part of the illustration). This is taxable profit, after losses carried forward from the financial crisis – losses therefore distort the first few post-crisis years. Taxable profits were very low from 2011-12 to 2014-15, and the bank levy is charged on balance sheets rather than profit, so in those years it looks very large. The chart leaves out the bank payroll tax (a one-off £3.4bn in 2010-11), the Bank of England levy and tax on bankers’ pay – in each case, that’s because, consistent with our general approach in this report, economic incidence is likely not on banks/their shareholders. ↩︎
This was for a very good reason: countries generally accept they tax local profits and activities only. Breaking this rule makes their businesses less competitive when operating overseas, which most countries see is against their long-term interests. ↩︎
We excluded payroll and property taxes because of the reasonably clear evidence that these are economically borne by employees and landlords, respectively. We included the remaining taxes without attempting a full allocation of their economic incidence. This involves some fine judgments; we talk about the issue further below in our comparison with the industry’s modelling. ↩︎
Because it adds a regional tax on banks’ margins (IRAP) to a 27.5% corporate tax. ↩︎
Its bank tax falls on the whole balance sheet, derivatives included, and a special rule denies banks part of their interest deduction. ↩︎
IPPR’s earlier plan was a levy on the interest the Bank of England pays on banks’ reserves, above 2%. It now proposes deferring the Bank of England’s losses instead, which it says wouldn’t affect banks’ profits. ↩︎
We haven’t included Positive Money’s proposal for “a 38% levy” on “UK retail net income” above £800m, “the profits they’ve made directly from the UK public” rather than (in the words of its August 2026 release) “banks’ wider investment activities”, because (obviously) it wouldn’t apply to a commercial or investment bank. But it would take Lloyds’ effective rate to something like 85%. ↩︎
There’s lots of evidence for this. Australia: Chronopoulos, Sobiech and Wilson found “a decline in value of the order of 5.2%” for the banks liable to a new bank levy (but not others). Italy: De Vito, Pancotto, Perdichizzi and Reghezza found average returns of minus 7% and cumulative abnormal returns of minus 3% around the announcement of a new bank tax. Martins found that all Euro area bank stocks reacted significantly negatively to Spanish and Italian windfall tax announcements, but more so for the banks directly affected. ↩︎
In theory, a tax confined to pure “economic rent” – the profit above the return needed to attract investment – is borne by those receiving the rent. But neither the bank surcharge nor the bank levy is confined to rent. Even if investment banks earn substantial rents, that doesn’t mean all their activities or additional investments generate rents – new business, for example, often won’t. The advantage of, say, a targeted reserve-tiering mechanism, is that it is much more closely tied to taxing rents – but the BoE rejects this on monetary policy transmission grounds (and we don’t have the expertise to assess the merits here). ↩︎
Even in the euro area, after more than 25 years of a single currency, households hold just 1.6% of their deposits with banks in another member state. ↩︎
Reality is more complicated than this. People can go to challenger banks for current accounts, and building societies for mortgages, but challenger banks and building societies are subject to the bank surcharge and bank levy when they get big enough. ↩︎
Albertazzi and Gambacorta, using data from ten industrialised countries, found that banks shifted a substantial share of corporate income tax onto borrowers through higher lending rates. ↩︎
There is a long-standing dispute over how much is borne by shareholders and how much by employees. It’s often claimed by people on the right that tax is borne by workers and therefore should be cut, and by those on the left that it’s borne by shareholders and should be increased. In the context of banks, this is a much less significant dispute because many people on the left would be happy to see bank workers bear the economic cost of a tax increase. But because it is an interesting point, we will quickly go through the evidence, which is rather nuanced and suggests that the result will differ markedly, depending on the particular market that is being considered. Fuest, Peichl and Siegloch in 2018 used German municipal tax rates to find that about half the incidence fell on workers. Suárez Serrato and Zidar found “firm owners bear roughly 40 percent of the incidence”, with workers bearing 30% to 35% and landowners 25% to 30%. Arulampalam, Devereux and Maffini, covering nine European countries, found that a “rise of $1 in tax would reduce the wage bill by 49 cents”. More recently, Baker, Sun and Yannelis found roughly half of the incidence falls on consumers through higher prices. But a study of the 2017 US corporate tax cut found wages rose only around 1%, and mostly at the top of the wage distribution ↩︎
In 2025 Goldman Sachs International paid $3.5bn of compensation and made $3.7bn of pre-tax profit. Morgan Stanley’s UK investment bank paid $2.1bn and made $2.4bn; Citigroup’s paid $1.9bn and made $0.8bn. Pay at these banks is around 30% to 40% of net revenue. ↩︎
Here’s a very brief summary of a complex literature:
A 1999 World Bank paper by Demirgüç-Kunt and Huizinga, covering 80 countries, found “the corporate tax burden is fully passed onto bank customers”. A 2010 paper by Albertazzi and Gambacorta found at least 90% of corporate tax was passed onto bank customers from 1981 to 2003. A 2011 paper by Chiorazzo and Milani found 100% pass-through for European banks from 1990 to 2005.
But then a 2013 paper by Capelle-Blancard and Havrylchyk used a better measure of the tax banks actually pay, looked at 1,411 European banks from 1992 to 2008, and found no pass-through at all. But important caveats: this was looking at averages, and “even an average bank might shift all its taxes to customers that are ‘locked-in’, such as individual borrowers and SMEs, while sparing large enterprises that are more mobile”.
More recent studies have picked up this distinction between locked-in customers and others. So Jiménez, Martinez-Miera and Peydró found mortgage rates rose by about 10 basis points, “approximately 60 % of the tax” but “The tax pass-through is nonexistent for high-income households, but complete for low-income households”. A similar effect was seen from the 2010 Hungarian bank levy.
And a 2023 working paper by Fox and Pyle compared small and medium US banks with tax-exempt credit unions: “A 100 dollar decrease in taxes generates a 74 dollar increase in returns to capital of which 22 dollars are deposit expenditures”. ↩︎
That’s Langenmayr and Reiter, but also see Merz and Overesch, Reiter, Langenmayr and Holtmann, Huizinga, Voget and Wagner and Fuest, Peichl and Siegloch. ↩︎
Langenmayr and Reiter estimate a tax semi-elasticity between −3 and −4 for fixed-income trading assets, and 9 for derivatives. Scaling to five points treats the semi-elasticity as constant, which the authors caution against. Then we assume profit per asset is unchanged and that profit booked elsewhere pays no UK tax. ↩︎
The same study found that the largest bank affiliates, those with more than €3.5bn of assets, didn’t respond to tax rates at all; it wasn’t clear why. The authors had two potential explanations. First, the largest affiliates might not be paying much profit tax, because of losses or other tax planning. Second, there could be regulatory constraints on the amount of proprietary trading. We don’t think the first point applies to the UK; the second to some degree does. And of course there might be another reason the authors missed, which would apply to the UK. ↩︎
Langenmayr and Reiter (Scandinavian Journal of Economics 2022) estimate that Germany lost around 5% of the tax revenue collected from banks through this trading profit-shifting channel, although they stress that this is a rough calculation. Translating their asset estimates into a response of taxable trading profits requires an assumption that taxable returns on the affected assets remain unchanged; it is not a direct estimate of that profit response. A 2016 paper by Merz and Overesch found that the response of banks’ reported profits to tax was about twice that estimated in previous studies of non-financial multinationals. A 2021 paper by Reiter, Langenmayr and Holtmann found that a ten percentage point higher corporate tax rate increases the internal net debt ratio by 5.7 percentage points. Older work points in the same direction: Demirgüç-Kunt and Huizinga (2001) found that foreign banks’ reported profits rise relatively little with the local tax rate, consistent with opportunities to shift profits abroad. And Fuest, Peichl and Siegloch found wage effects close to zero in firms operating in multiple jurisdictions, which they suggest can be explained by those firms’ greater opportunities to shift profit. ↩︎
The letter, sent on 12 October, was reported by the Guardian and Bloomberg; it says lending would be £10.4bn lower in 2029-30 than if the surcharge stayed at 3%. UK Finance’s published Budget submission contains no lending or GDP modelling. ↩︎
e.g. when the bank surcharge was cut in 2021, HMRC said that would have “a small positive impact on business investment”, but the OBR said it made “no material difference”. ↩︎
The HMRC Bank Levy tax information and impact note in 2011 said “Although the extent to which the cost of the Levy is not absorbed by shareholders may result in additional costs for individual customers”. In 2014, HMT said the bank levy “may be creating distortions”, including “the relocation of certain low-margin activities overseas or to the non-banking sector”. ↩︎
PwC’s 2026 report, page 3: “The TTR for a model bank operating in London for 2026 is estimated at 46.2%”. The model bank carries on “a mixture of corporate and investment banking activities”, and “The commercial profit will be the same in all five jurisdictions” (page 44). PwC expects the figures to be the same in 2027 (page 47). It doesn’t cover Singapore. ↩︎
PwC’s 2026 report, page 22: London’s figures for 2022 to 2025 have been revised “following a review of the treatment of the UK bank surcharge allowance. The revisions reduce the modelled TTR by between 0.2 and 0.4 percentage points in each year”. The 2025 report had used “the 2025 tax rate of 25%, plus the 3% bank surcharge, giving an overall combined rate of 28%” (page 36) for a bank “standalone for tax purposes” (page 33), which is entitled to the full allowance. Its London figure for 2025 is now 46.1%, against the 46.4% first published. ↩︎
PwC’s report, page 45: employer social security contributions are highest in London, “amounting to 13.1% of commercial profit”, and in the other centres they “range from 3.5% to 9.7% of commercial profit”. ↩︎
We took our investment bank estimates for Paris and Milan, and restated them on PwC’s method by adding back employer social security and other payroll taxes (in France including the taxe sur les salaires) and property taxes, and assuming 60% VAT recovery, as PwC does. In Italy the cap on pension contributions applies only to staff first insured after 1995; we assume that’s 65% of staff, based on Eurostat’s age profile of Italian financial services. Of course the figures aren’t exactly comparable with PwC’s, because our model bank is different. ↩︎
Goldman’s 2025 UK group disclosures identify 531 “material risk takers” in its investment-banking category, receiving $897m remuneration out of a total payroll of about $3bn. This category is a reasonably good proxy for international mobility. ↩︎
The Institute for Fiscal Studies told the Treasury Committee: “Economic theory predicts that, in the long run, (higher) business rates will mostly be reflected in (lower) rents, passing the burden of the tax from the occupiers of property to the owners” (IFS submission, paragraph 6). ↩︎
PwC’s report, page 45: “We have assumed that 75% of general and administrative costs would be subject to VAT with the rest of the costs being exempt. We also assumed that 60% of the VAT incurred would be recoverable.” PwC accepts that the real figure “will depend on the geographical split of the customer base”. ↩︎
In the UK, VAT is recoverable on exempt financial services supplied to customers who belong outside the UK, under section 26(2)(c) VATA 1994 and the Specified Supplies Order, extended to EU customers at the end of the Brexit transition period (SI 2020/1545; see HMRC’s guidance). EU member states give recovery only where the customer is established outside the EU, under article 169(c) of the VAT Directive (in Ireland, section 59 VATCA 2010). ↩︎
We assume our investment bank has 22% of its customers in the UK, 32% in the EU and 46% elsewhere, and keep them where they are when we move the bank: so its UK customers count as non-EU customers when the bank is in Frankfurt (that likely flatters the German VAT position). For the commercial bank, with 26% of its customers in the UK and 24% in the EU, the EU countries give slightly more recovery than the UK. Here and throughout, we treat irrecoverable VAT as a cost to the bank, and don’t try to work out who ultimately bears it. That’s a deliberate difference from our treatment of payroll and property taxes. The evidence that employer national insurance falls on employees, and business rates on landlords, is strong. Who bears VAT on a bank’s purchases (or corporate tax on its profits) is much less clear. ↩︎
PwC doesn’t publish separate payroll and property tax figures for Amsterdam, New York and Dublin, so we’ve estimated the split from our reconstruction of PwC’s model; PwC didn’t estimate German property taxes. For London we use profit tax of 22.1% of profit, not the 22.4% on page 46: the 22.4% appears to be before the surcharge allowance, because the report’s other London figures, including its 46.2% total, only add up if profit tax is 22.1%. PwC’s figures are for 2026 and ours for 2027, and PwC expects no change in 2027 (see page 47). ↩︎
Noting the uncertainty around corporate tax incidence discussed above. ↩︎
Goldman Sachs International earns 19% of its revenue on its Americas desks (2025 accounts, page 60). Not all of that is from the US, so we apply the US share of its exposures to the Americas countries named in Goldman’s UK Pillar 3 disclosures (the US, Canada and the Cayman Islands), which is 80%. SMBC Bank International’s Pillar 3 disclosures put 3.3% of its on-balance-sheet exposures in the US. Customers elsewhere in the Americas, and in Asia, aren’t taxed by any US state. ↩︎
Irish banks owned by foreign groups generally pay the top-up already, and every bank will from 2029. A standalone domestic Irish bank owes no top-up tax in its first five years; on that basis Ireland would be 13.8% for the investment bank and 15.2% for the commercial bank. ↩︎
Leave a Reply