
Tax in the UK is the highest it’s been since 1945. That’s well understood – but another trend has been largely missed: the number of taxes in the UK is at its highest since the end of the Napoleonic Wars.
Back then, the Government was fighting France and building the modern state. Afterwards, and over the 20th Century, the number of taxes fell, as the size of the state increased. But that changed thirty years ago. There was a sudden explosion in the number of taxes, and it’s kept going. Taxes didn’t rise during most of that period – so what happened? And why do we have so many taxes?
The data
This chart shows all the UK taxes we could identify since William the Conqueror.
The next chart shows every individual tax. The horizontal lines each represent the lifetime of individual taxes, and if you tap on them or hover, you’ll see the details of each tax:
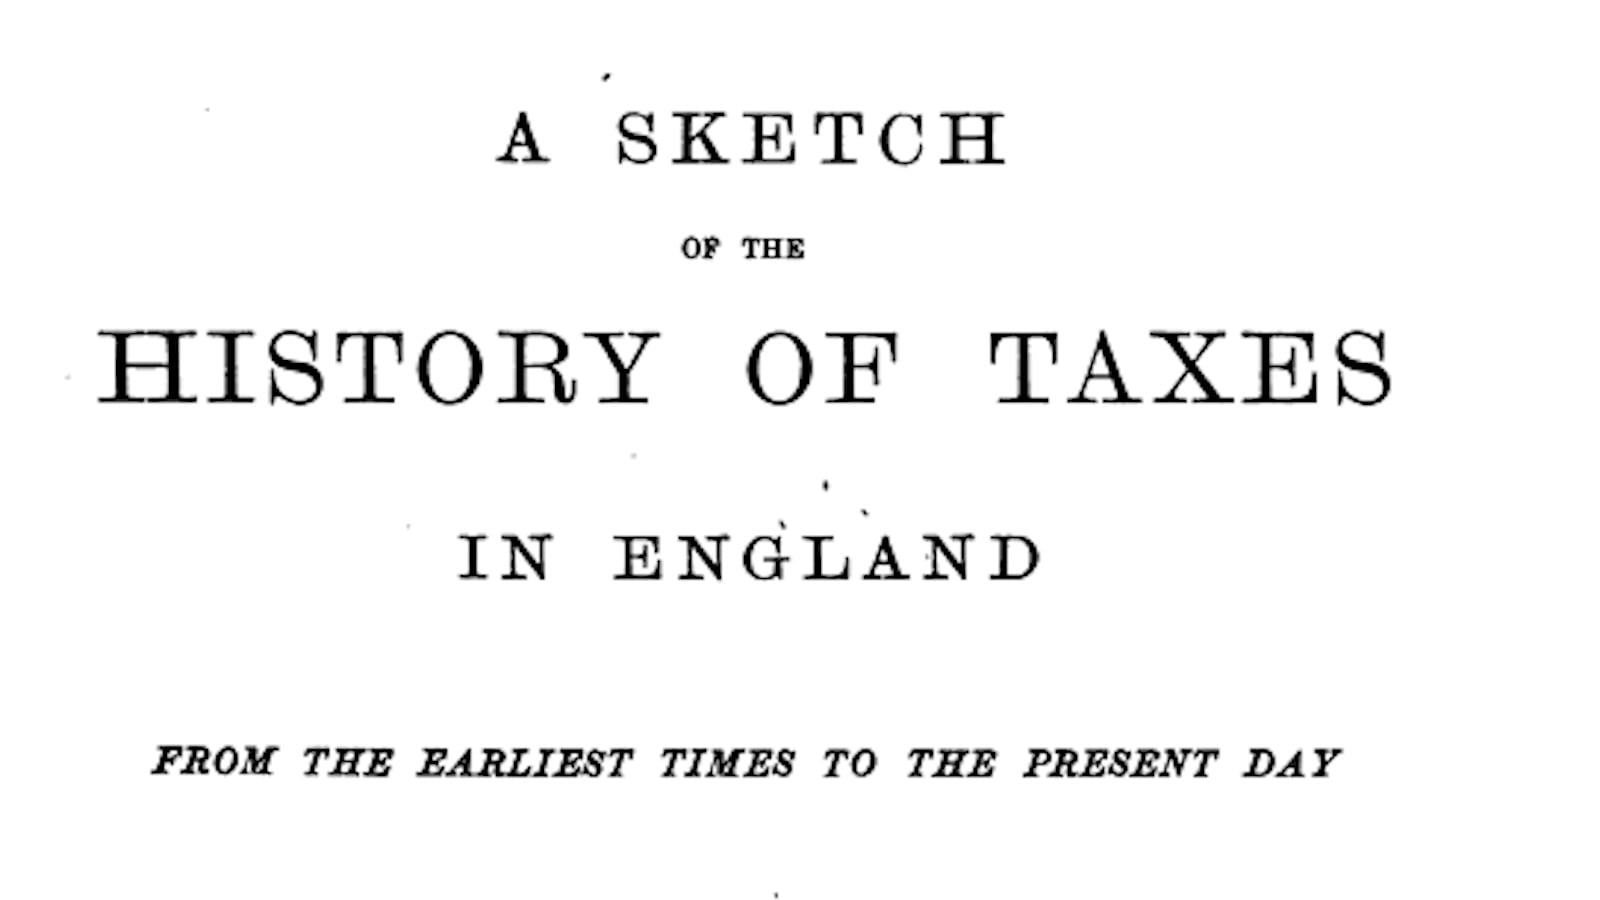
Our methodology is set out below, but for the pre-20th century position, we relied very heavily on Stephen Dowell’s 1884 four volume A Sketch of the History of Taxes in England. That means we generally miss older Scottish taxes and all Irish taxes. We tried to apply the ONS definition of what is and what is not a “tax” (except that in our view National Insurance is, realistically, a tax).1.
This plot overlays a chart of tax as a percentage of GDP:
There’s a little spike for the English civil war, and then two much bigger spikes.
The first in the late eighteenth century reflecting the Government’s need for huge new sources of funding to cover the expansion of the state, and the immense cost of the Napoleonic Wars. The single largest contribution came from the introduction of income tax, but there were also a dizzying number of very specific small taxes covering everything from dogs to wigs. When the Napoleonic Wars came to an end, Government spending dropped, and there was a significant rationalisation of all the little taxes. Patrick Karl O’Brien has written a fantastic history of this.
From the First World War there was a massive, and sustained, increase in the size of the state. But this time it was achieved by a small number of large taxes, rather than lots of little taxes – so the number of taxes actually declined.
Then we see something strange. There hasn’t been an increase in overall tax over the last 30 years (except very recently), but there has been an increase, and a very sharp and sudden one, in the number of taxes.
Some possible theories:
- “Stealth taxes” – attempting to reduce the burden of income tax on workers by applying small, segmented taxes to particular industries and services. Ultimately, in many cases, the burden falls on ordinary people, but it’s less noticeable.
- Environmental taxes – there were none before the 1990s.
- Devolved taxes – again, none before 2015 (Scotland) and 2017 (Wales)
- Behavioural taxes (plastic bags, soft drinks, etc.). Another recent innovation.
We’re not sure. But, as we said earlier this week, there’s a strong argument for cutting back. Taxes that raise little or no revenue create cost, and largely uncounted cost, for both taxpayers and HMRC.
Methodology
The complete list of taxes and code creating the charts is available on our GitHub.
How the tax history dataset was constructed
For the current UK tax system we began with the revenue taxonomy used in our UK tax-system sunburst chart (and we set out the methodology there).
We created the list of historic taxes from a manual and then automated/AI review of O’Brien and Dowell, plus numerous other sources including UK Parliament’s taxation timeline, legislation.gov.uk, The National Archives, Hansard, British History Online, HMRC manuals and statistics, GOV.UK tax information and impact notes, and devolved-revenue authority guidance. The list was then reviewed by veteran/retired tax advisers and HMRC personnel.
We made no attempt to weight by revenue – that would be wonderful, but we couldn’t find any reliable sources that would enable us to do it. The bulk of the taxes raised very little (even in their own time).
Where a tax was known to exist but the exact start or repeal date was uncertain, we used the best available “known in force by” or approximate endpoint and marked the row as lower confidence. Where the source showed an episodic tax, such as a one-year poll tax, the row runs only for that episode. Where a tax regime plainly continued under a modern name or successor form, we generally treated it as continuous only if that was the better description of the tax, rather than automatically splitting every statutory amendment into a new tax.
At the time of publication the dataset behind the charts contains 369 tax episodes across 339 tax identifiers. The count chart excludes the 17 chart-only split rows and includes the four announced/future rows by default, so the count ends at 90.
There are many, many limitations to this data:
- The historical list is incomplete. It is strongest for England, Great Britain and the UK, and weakest for older Scottish and Irish taxes. That’s largely because Dowell is an English tax history.
- There is a huge risk of presentism. Modern taxes are much easier to find, especially small statutory levies and ONS-classified fee-like taxes. Older equivalents may be missing, particularly late nineteenth and early twentieth century taxes (i.e. too late for the 1884 publication of Dowell, but too early for modern sources).
- Many medieval and early-modern dates are approximate. Some taxes were episodic grants, evolved into later regimes, or were consolidated into broader customs and excise systems.
- The boundary between a separate tax, a tax surcharge, a licence duty and an administrative fee is often contestable. We tried to apply the same rules consistently, but reasonable people could draw the line differently.
- The count is sensitive to granularity. Counting every stamp-duty instrument head or every customs commodity head would raise the historical count; grouping them into umbrellas would lower it. Our approach is to count named taxes where sources treat them as distinct and to avoid obvious parent-child double-counting.
- The endpoint includes four announced/future taxes. If those are excluded, or if a future government changes course, the final number changes.
We’d love people to send us additions/corrections.
How the tax/GDP dataset was constructed
The main source is the OBR’s historical public finances database, using the workbook sheet headed “Receipts (per cent of GDP)”. We used the best available tax-like receipts measure in that workbook for each period:
- 1700-01 to 1899-1900: central government receipts as a percentage of GDP, because the workbook does not provide a public-sector or National Accounts taxes total for those years.
- 1900-01 to 1945-46: public sector current receipts as a percentage of GDP, because the National Accounts taxes line is not available for this period.
- 1946-47 to 2022-23: National Accounts taxes as a percentage of GDP, taken directly from the OBR historical public finances database.
- Most recent figures: National Accounts taxes from the OBR March 2026 Economic and fiscal outlook, divided by OBR nominal GDP.
This is all highly approximate and should be regarded as no more than indicative of long-term trends.
Many thanks to T, V and O.
Chart created using Apache ECharts, by the Apache Software Foundation and contributors (Apache-2.0).
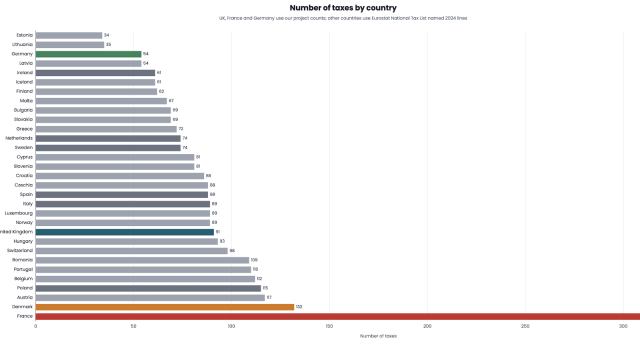
The UK has 90 different taxes. France has 348. Germany has 60. Why?

90 UK taxes. On one chart.
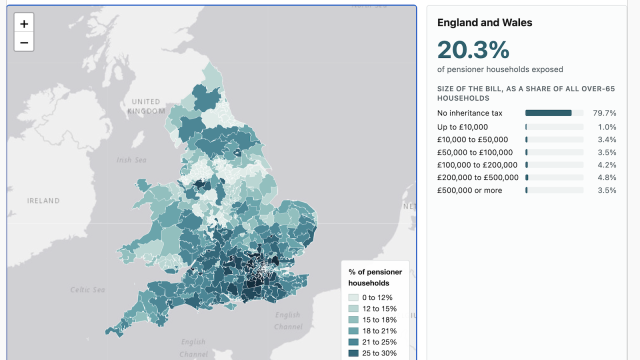
The hidden reach of inheritance tax: one in five pensioner households
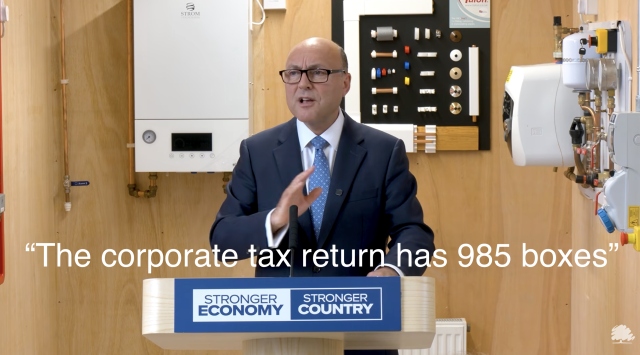
How complex is the corporation tax return? And is it getting worse?
England’s new tourist tax: what it raises, who pays, and what it costs


Leave a Reply