
The November 2025 Budget introduced a “mansion tax” – formally, the “high value council tax surcharge” – an annual charge on homes worth £2m or more. The Mail on Sunday reported in July 2026 that Andy Burnham might lower the threshold to £1.5m. The Times reported in September 2026 that it was under active consideration.
We’ve looked at what this might mean: who would pay, where the properties are, and how much it could raise. Updated 19 September 2026 with the latest available datasets and new visualisations.1
Our estimate: a £1.5m threshold would tax around 160,000 additional homes on an OBR-scaled basis, almost doubling the number of properties in scope. That’s a lot more cost. Adding a lower band, with a lower annual charge, would not raise a great deal of extra money – so this doesn’t seem viable to us.
That may mean that this is simply not going to happen. But if it does then, to make those new valuations worthwhile, the tax would have to become more aggressive. You could, for example, double the current yield i f£1.5m homes paid £2,500 (the current lowest charge), and all the existing bands had their charges increased. This article models that approach.
Mr Burnham may regard this option as tempting but there is, in our view, a serious downside. Tax systems need stability. Expanding a tax before it’s even been introduced is, in our view, the opposite of stability.
Also: 85% of the additional homes are in London and the Southeast.2
The impact of a £1.5m threshold
When the high value council tax surcharge (HVCTS) was first announced, we mapped the impact using historic Land Registry data. We’ve now re-run the model at a £1.5m threshold, reflecting the April 2026 valuation date the tax will use.3
Dropping the threshold to £1.5m nearly doubles the number of properties caught, from around 123,000 to around 245,000.4 If those new properties are charged a lower amount than the current lowest band (£2,500/year) then the net revenue is modest, once you take into account the additional cost of valuing all those additional homes. So it’s more plausible that £1.5m properties would be charged £2,500/year, with the £2m and upper band charges all increased. That could roughly double the net revenue, to about £800m – and we assume this is how any extension of the mansion tax would work. More on these calculations below.
It’s important to add that this is all speculation. We don’t know if Andy Burnham is really planning a change of this kind; but it’s useful to look at what the impact would be.
And none of this relates to Scotland, Wales and Northern Ireland. Land taxation is devolved, and so the HVCTS applies only to England – this article considers only the English position. Scotland is consulting on introducing new £1m+ council tax bands.
Regional breakdown
Here’s where the properties are (you can toggle between properties and revenue, hover for the detail, or click to zoom in):5
And, this is a heatmap of Parliamentary constituencies – you can pan/zoom with your finger/mouse and hover/touch individual constituencies for details:
Please don’t forget that all of this is based on our speculation on how a £1.5m mansion tax would work. It could tax less than this, although probably not much less if it’s to raise worthwhile sums. Alternatively it could of course tax more than this.
Who is newly taxed?
Rather than just looking at the distribution of the new tax, perhaps a more interesting question is to ask which homes weren’t caught by the original mansion tax, but are caught by a reduction in the threshold to £1.5m:
London has just over half the newly-caught homes (51%, against 59% of all £1.5m+ properties). But the biggest change is the number of houses in the commuter belt that get caught – and the biggest single upper-tier authority isn’t a London borough at all: it’s Surrey. The North is only just visible on the chart as a thin sliver.
And here it is constituency by constituency. The darker the constituency, the more homes a £1.5m threshold would newly catch; hover for the revenue as well:
Again, please don’t forget that all of this is based on our speculation on how a £1.5m mansion tax would work.
Where are the properties?
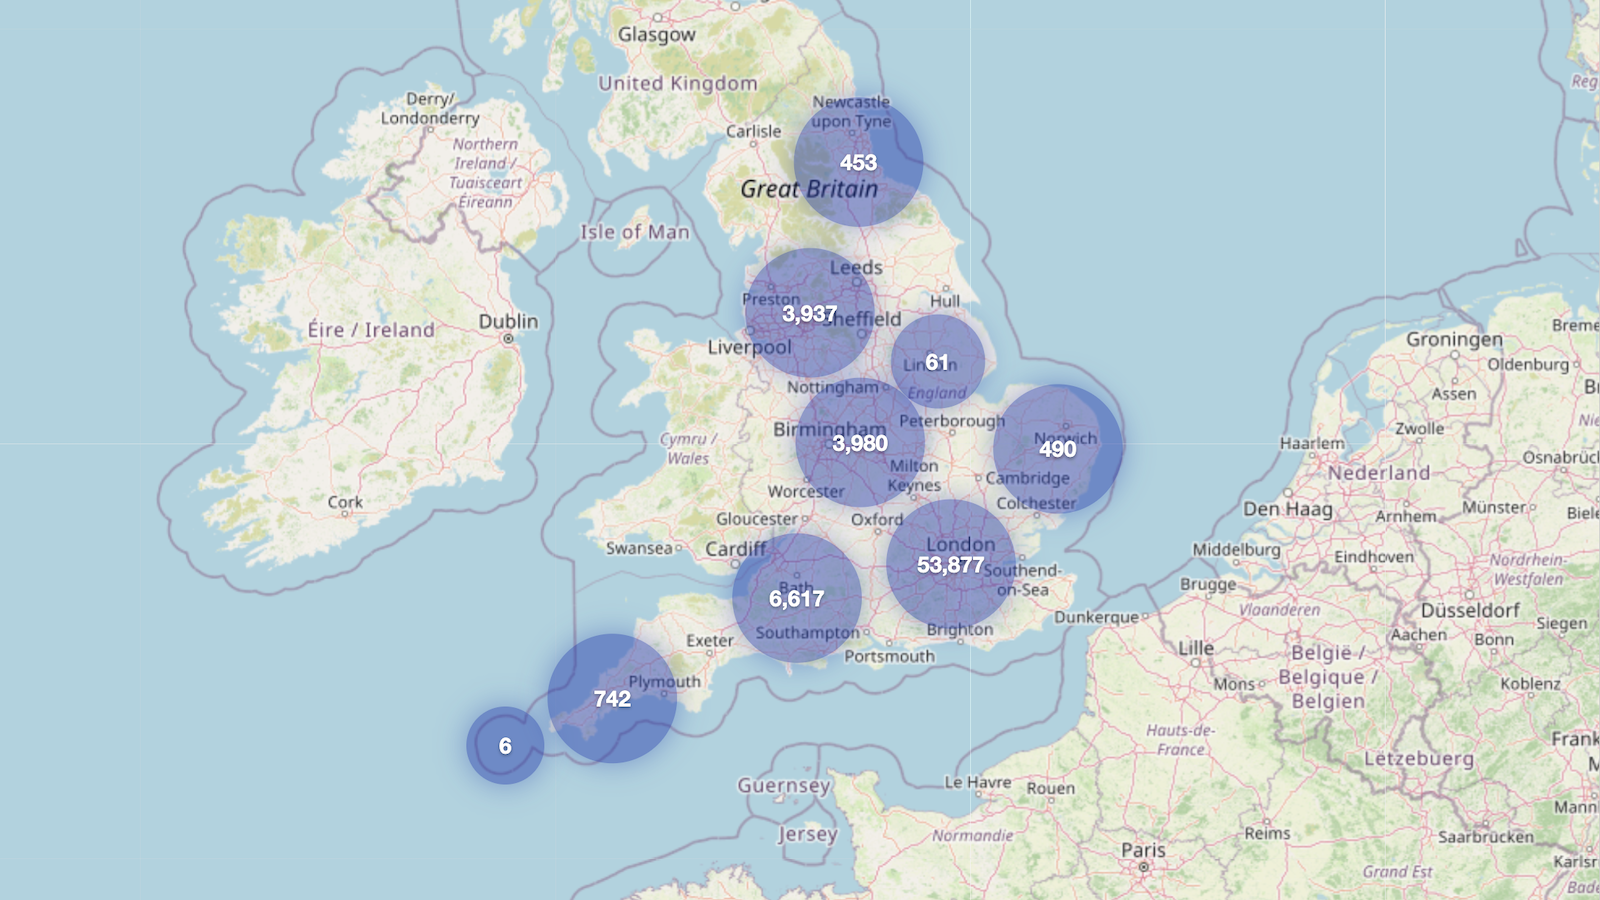
This interactive map shows postcodes containing properties we estimate would fall within a £1.5m mansion tax:
You can view the map fullscreen here. The markers sit at the centre of each postcode6 and do not represent individual properties. There are numerous approximations, and this should be regarded as highly indicative.
And yet again, please don’t forget that this is based on our speculation as to how a £1.5m mansion tax would work.
The overall yield
The tax announced in the November 2025 Budget applies a charge of £2,500 a year on homes worth £2m-£2.5m, rising in steps to £7,500 above £5m. As we explained above, we think a £1.5m band wouldn’t make sense if it was charged at a lower rate than this. So we assume that the lowest £2,500 rate would apply to the new £1.5m band, with each of the other charges shifting down one band, creating a new £10,000 top rate:
| Band (April 2026 value) | Announced £2m tax | Our £1.5m scenario |
|---|---|---|
| £1.5m to £2m | None | £2,500 |
| £2m to £2.5m | £2,500 | £3,500 |
| £2.5m to £3.5m | £3,500 | £5,000 |
| £3.5m to £5m | £5,000 | £7,500 |
| £5m+ | £7,500 | £10,000 |
We can estimate the revenue impact by taking the Office for Budget Responsibility’s costing approach and applying it to two scenarios: a new £1.5m band at £1,500/year, and our base case – a new £1.5m band at £2,500/year that “pushes up” each of the other bands. We set out the methodology below.
| Budget proposal (£2m threshold) | Add £1.5m band at £1,500 (other bands unchanged) | Add £1.5m band at £2,500 with higher other bands (our base case) | |
|---|---|---|---|
| Static revenue, 2028-29 | £605m | £850m | £1,270m |
| Dynamic revenue, 2028-29 (after taxpayer responses and the extra valuation and administration cost) | £400m | ~£520m | ~£800m |
Methodology and limitations
The code for the analysis, charts and and webapp is available on our GitHub.
We use the approach in our original post, with the latest available data downloaded on 19 September 2026. We take residential-looking transactions in the July 2026 release of Land Registry Price Paid Data and adjust prices to April 2026. Later sales are adjusted backwards.7
The limitations are as before, and mostly mean our results are an under-count: we miss properties that haven’t sold since 1995; we de-duplicate repeat sales of the same property, conservatively (so may accidentally eliminate real sales); we can’t reliably screen out commercial property, farms sold with farmhouses, or portfolio deals that span multiple postcodes; we can’t account for improvements or conversions after a sale; and constituency-level inflation misses variation within a constituency. Our original post sets these out in full.
On the announced £2m tax, our refreshed model estimates static revenue of around £470m from about 123,000 properties. This is below the OBR’s £605m static forecast and 165,000 properties for 2028-29. Our transaction-based model misses unsold properties and differs from the OBR’s projected housing stock and exemption assumptions. We therefore use the OBR figures as the baseline for the revenue table, rather than treating the gap as a measured undercount. The maps show our unscaled property estimates. These are approximate; individual valuations can be wrong in either direction.
For the revenue table we retain the OBR’s £605m static and £400m post-behavioural forecasts for the announced policy in 2028-29.8 We scale our 121,000 newly caught properties by 165,000 divided by our 123,000 £2m-plus count (about 1.34), giving roughly 160,000 additional properties. We apply the same factor to the extra revenue from each expanded schedule, and add that to the £605m baseline. Both scenarios then apply the OBR’s aggregate retention ratio of £400m divided by £605m. This is our illustrative extrapolation, not an OBR forecast for a £1.5m tax.
We also deduct an assumed £40m a year of additional valuation and administration costs from each expanded scenario. This is our estimate, not a published official costing.9 Both scenarios value the same additional properties, so we use the same administration assumption. The announced policy stays at the OBR’s £400m figure, without deducting its existing administration costs.
Detached-house inflation is an imperfect proxy for high-value homes, especially flats and terraces in London. Constituency medians can also move because the mix of homes sold changes. The geography and individual counts should therefore be read as estimates, not a valuation list.
The £1.5m band may have a different undercount and a different behavioural response from the £2m-plus stock. Our data does not establish the size or direction of the net effect. The revenue table uses the same scaling and retention assumptions for both expanded scenarios and rounds to the nearest £5m.
The OBR’s original costing carried a “high” uncertainty rating. Our extrapolation is – obviously – considerably more uncertain than that.
Contains HM Land Registry data © Crown copyright and database right 2026, licensed under the Open Government Licence v3.0. Also contains Office for National Statistics house-price and postcode data, Valuation Office Agency council tax statistics, and Ordnance Survey and Royal Mail data, subject to the respective providers’ copyright, database rights and licensing terms. Revenue estimates draw on the Office for Budget Responsibility’s published costing.
Thanks to K for help with the code, and T, D and S for their property and valuation insight.
The mansion tax map: where the money comes from
What effect is the mansion tax having on house prices?
The hidden reach of inheritance tax: one in five pensioner households
England’s new tourist tax: what it raises, who pays, and what it costs
What would a land value tax actually do?

Has Britain run out of “other people” to tax?
Footnotes
But all valuations remain at April 2026 (or where we have new data are carried back to April 2026) because that is the valuation date for the tax. ↩︎
For this figure, we use the former South East planning region: today’s London and South East regions plus Hertfordshire, Essex and Bedfordshire, including their unitary authorities. This follows the old SERPLAN boundary described in the London Assembly’s London in its Regional Setting, paragraph 2.2. We think this better captures the geography normal humans have in mind when we read “South East”. It includes 102,840 of our 121,388 newly caught properties: 84.7%, rounded to 85%. Using today’s official statistical London and South East regions gives 76.7%. ↩︎
The tax first applies in April 2028, but on values as at April 2026, revalued every five years. Our original post uprated to the most recent data then available; this version uprates to April 2026, using the latest ONS constituency price data (year ending March 2026) plus the England detached-house index from the UK House Price Index, from the July 2026 release (so no extrapolation/forecasting is required). ↩︎
All figures are our lower-bound estimates from Land Registry data – see the methodology section. On the same refreshed data, the announced £2m version catches around 123,000 properties and raises around £470m a year. ↩︎
The groupings in the chart are the ONS statistical regions, which don’t always match everyday geography. It’s deeply unintuitive (at least to us) that Hertfordshire is categorised as in the East of England, not the South East. The nine English regions were established in 1994 and are the highest tier of sub-national division in England. The East of England is Bedfordshire, Cambridgeshire, Essex, Hertfordshire, Norfolk and Suffolk, plus the unitary authorities carved out of them: Luton, Bedford, Central Bedfordshire, Peterborough, Southend-on-Sea and Thurrock. The South East is Surrey, Kent, Sussex, Hampshire, Berkshire, Buckinghamshire, Oxfordshire and the Isle of Wight. An easy way to check this is the ONS local authority district to region lookup. We take each property’s region from the National Statistics Postcode Lookup, which tags every UK postcode with a region code. To keep the chart hierarchy consistent, each constituency is assigned to the region and upper-tier authority containing the plurality of its relevant properties. ↩︎
Strictly the address-weighted centre, not the geometric centre. The postcode map’s boundary filter omits 43 of the 244,674 estimated £1.5m-plus properties. The constituency charts retain them. ↩︎
We retain detached, semi-detached, terraced and flat/maisonette records, split apparent batch sales and keep the latest sale for each normalised address. The ONS constituency detached-price series now runs to the year ending March 2026. We use the change from each sale quarter to that window, then multiply by the April 2026 England detached-house HPI divided by the average index over the twelve-month window. That bridge is 1.0096. Sales after March 2026, and historical sales with missing constituency observations, use the England detached index directly from the sale month. The HPI comes from the July 2026 release, including its revised April observation. We use the August 2026 National Statistics Postcode Lookup and the latest available 2025 council-tax stock tables. ↩︎
OBR, Costing of high value council tax surcharge, Table 1.5. The £400m already includes effects on other taxes, including stamp duty. Table 1.1 gives the 165,000-property static base, incorporating exemptions and projected stock changes. ↩︎
The assumption carried forward from our earlier analysis is approximately 300 officers at £70,000 average gross employment cost, doubled to allow for systems and associated costs, giving about £40m. It does not separately cost the initial valuation exercise or every appeal. ↩︎


Leave a Reply