
I just wrote in the Sunday Times about the political and economic case for a land value tax. I think the principled argument for LVT is compelling, and our (likely) next Prime Minister has supported it for many years.1, calling it “aspirational socialism”; a 2022 LBC interview described LVT as “a very productive form of taxation” that could discourage land hoarding; and at his 22 May 2026 Makerfield launch he said he had “long been persuaded of the argument for a Land Value Tax”, while describing council tax as “highly regressive” and its 1991 valuations as “not justifiable”. But Burnham has also supported Fairer Share‘s tax on the whole value of property, which is not LVT. There’s a good CIOT article on Andy Burnham’s tax positions.[/mfn] The challenge is the detail – and wrapped up in that is who wins and who loses. So this article is not about the case for land value tax. It’s about the detail: how a land value tax would work in practice, and what the key design questions and challenges are. It’s based on a simplified model of how a land value tax could apply to English residential property. The model helps answer the first question most people have: who will pay? More importantly, the model prompts a series of questions around the problems and limitations of a land value tax, and the potential compromises with reality that have to be made.
The principled case for LVT is easy. The practical case for LVT seems equally straightforward if we look at the headline result that (on our model) at least 63% of people will benefit in immediate cash terms2, and easier still if you consider the long run benefits for everybody. But, once we get beyond that headline figure, the implementation is difficult, and the politics is really difficult. This article is intended to help frame both.3
At this point, I do not have answers, but I have a better idea of what the questions are. It’s normally said the big problem with land value tax is valuation. That’s certainly a very serious challenge, but to my mind bigger problems are (1) very substantial tax increases for some people, particularly in London, and (2) capitalisation: the prospect of a sudden shock that, overnight, greatly reduces property prices in some parts of the country (think: Kensington) and greatly increases them in others (think: Blackpool). Neither is desirable. The most plausible solution is to phase in the tax over a long period. That may not be enough – and land value tax proponents may have to accept complexity and deviation from the beautiful purity of the LVT concept.
This report starts with the model – which you can see here. Below this is a full discussion of how to use the model, what it means, and — most importantly — its limitations. You may find it helpful to open the model in a separate tab by clicking here, so you can view model and discussion at the same time.
We are not the first to publish a sophisticated online model of land value tax. PolicyEngine has produced a much better model than ours for examining the distributional consequences across households: it is a proper microsimulation model, using household survey data to show effects by income, family type and poverty status. Anyone principally interested in who gains and loses across the income distribution should start there. Progress and Property, meanwhile, has produced a much more spatially detailed valuation tool, using property boundaries and local data to estimate land values at something approaching individual-property level. Its underlying methodology and code do not appear to be published, however, so unlike our model (or PolicyEngine’s) its results cannot presently be reproduced or independently tested.
Our model was built to answer a different set of questions: what happens if residential council tax and stamp duty are replaced by LVT; how the results vary geographically; and what difference is made by progressive rates, regionalisation, transitional relief, deferral and phase-in. As far as we are aware, this is the first public model to combine those features. It is therefore not the best available model for every purpose, but it is (I think) the first that does the particular job we wanted done.
The way the model works, what it tells us, and wider questions about a land value tax are discussed in detail below. You can click these buttons to jump to each section.
Why a land value tax?
A very short version of my Sunday Times piece would go: the UK’s three existing property taxes: stamp duty land tax, council tax, and business rates4 are broken, unfair and anti-growth. They are also huge – and result in the UK having the largest property tax (as a portion of GDP) of any OECD country:
Stamp duty is particularly bad: it reduces household mobility, results in inefficient use of land, and plausibly holds back economic growth.5 A land value tax would be more equitable and efficient. And taxing land is better for growth than taxing any other income or asset because normally when you tax something, you get less of it, but when you tax land, you do not. In fact, you incentivise more efficient use of the land.6
Whatever your view of tax and the size of the State, land value tax makes sense. If you believe in a smaller State, then you should want income and corporation tax cut and land taxes to go up. If you believe in a larger State, you should want more tax raised from land. Either way, taxing land is pro-growth.7 The burden should fall primarily on landlords not tenants. How many other ideas are backed by the Institute of Economic Affairs, the Adam Smith Institute, the Institute for Fiscal Studies, the New Economics Foundation, the Resolution Foundation, the Centre for Economic Policy Research, and the chief economics correspondent at the FT?8
Our LVT model
This is a simple model with many limitations, and I talk about them below. It’s useful for seeing the rough overall impact of a land value tax – who gains, who loses, by roughly how much, and how design decisions change these results. It is not, by any means, a robust model of how a land value tax would actually work, and none of the individual figures should be treated as precise. I support a land value tax that covers residential and commercial property, but to keep this project manageable, the model and this article only discuss residential property.
You should start by launching the model (clicking that and the other links below open a new tab with a saved view illustrating the point). This shows that a pure land value tax can replace residential stamp duty land tax and council tax if we set it at a rate of 1.28%.
You can then see:
- Biggest winners: deprived North East and coastal towns – Hartlepool, Blackpool, Middlesbrough – where households would pay around £1,600 a year less
- Biggest losers: prime London and the commuter belt. £550,000 buys you a one-bedroom flat in Kensington & Chelsea. Our model shows that flat pays about £4,000 more in LVT than it paid in council tax; Hammersmith and Camden about £3,000 more. Important to repeat that this is an impressionistic model, and the direction will be correct, but the precise figures will not be.
- The starkest case: in the cheapest parts of Blackpool the land is worth almost nothing once you subtract rebuilding costs – so those homes, which today pay some of the highest council tax in England, would pay next to nothing.
- The other end: Westminster’s council tax take of roughly £180m would become a land value tax bill of about £1.5bn.
- The high end: Properties worth hundreds of millions of pounds will, fairly obviously, end up with millions of pounds of annual land value tax.9
Although when looking at the high figures for expensive property, bear in mind that stamp duty is disappearing. So for a new buyer, this is a much more attractive deal than for an established homeowner.10
Adding different thresholds doesn’t raise much more money
Any vaguely left-wing politician is going to be tempted to do better than revenue neutrality. They may want to use land value tax to raise additional funding. The obvious way to do that is to create a higher rate for higher value properties.
Let’s say, for example, we take a similar approach to the current mansion tax and impose a higher rate on land worth £2m+. Say a 2% rate.
You can dial that into the model by pressing the “Add a higher band” button. And the surprising result is that this raises less than a billion pounds. For the same reason, a land value tax that only applies to high-value properties is not really worth doing.11
The transition is unfair
Anyone buying an average £520,000 property in Islington would no longer suffer £16,000 stamp duty.12 But council tax of £2,000 would be replaced by LVT of £5,000. That’s a big increase. And it’s one thing if you’re about to buy that house – the disappearance of stamp duty may be some consolation, even (for some people) a good deal. It’s something else if you bought the house a week before land value taxes were announced.
People would be furious, and I think they would be right. It would be a desperately unfair result.13
Even if you don’t agree, you should be worried about something else. There would be years between an announcement of LVT and implementation. If there aren’t transitional rules, then few people would buy property and pay stamp duty, knowing that they’ll have to essentially pay again when land value tax comes in.
So realistically, I think you have to credit recently paid stamp duty against people’s increased bills (i.e. new land value tax minus old council tax).14
There are many ways this could be done. Perhaps the simplest approach is something like: full credit for stamp duty paid in the previous tax year, 90% credit for stamp duty paid the year before that, and so on.15 That credit is then used to reduce each year’s land value tax (the excess over old council tax), until it is used up.16
That’s the “Transitional rule” checkbox in the model. It simulates the kind of credit rule I described in the previous paragraph. I think it’s something you have to do – but there’s a catch. It creates a significant reduction in revenue in the first year – about £5bn at the rates shown. You will see the text below the checkboxes now says that, to remain revenue neutral, the rate has to go up to 1.41%. If you click the “use it” button then that rate will be applied.17
The regional redistribution is just too high
Now imagine that £520,000 Islington property was purchased by a couple of teachers who have been saving for ten years, and put everything they have into the purchase.18 They face £5,600 of LVT per year19 – £3,600 more than their Band D old council tax bill. It will be a significant sum to them – about 4% of their annual post-tax income.
There will be lots of people in this position: people owning valuable land, particularly in London, who will struggle to afford the land value tax. That feels a fairer result if it’s households who bought when property was much less valuable and have benefited from significant appreciation, but it feels much less just where people recently bought at great personal cost. We have no way to distinguish between these two cases in the application of the tax. So our Islington teachers are being punished for buying at the wrong time.
Now imagine an equally experienced couple of teachers in Blackpool. They would earn about £45,000 each. For £200,000 they could buy a four-bedroom semi-detached house of about 1,500 square feet, with front and rear gardens, a garage and off-street parking. Their home would be more than twice the size of the Islington flat, but would cost less than half as much. And their £2,100 council tax would be replaced by LVT of only £459.
This feels unfair. The stratospheric valuations of London property have caused many problems, and in my view it’s right that there is a correction. But not this much. Many otherwise-sympathetic people hesitate when they see results like this. And indeed there’s evidence that the greatest problems with horizontal equity for land value taxes can be on the lowest-value homes.
The answer is to forget the idea of a pure land value tax applying across the country and make it, to at least some degree, regional. If you take the slider at the top of the model and drag it from the left all the way to the right, then the land value tax becomes entirely regional. The LVT rate varies in each region so each region collects an amount equal to the total council tax and stamp duty previously collected from that region (although if you are using transitional rules then there are short term differences). Any redistribution in London (for example) is therefore solely between different properties in London. Our Islington teachers see an increase of £1,000 rather than £3,600. They are the main winners.
The regional table shows what this does to different rates. If we make the slider “all regional” then the rate becomes 3.4% in the North East, but 0.82% rate in London. That means a regional LVT greatly increases land value tax for wealthy areas within poorer regions. There are about 1,000 houses in Trafford in the top council tax band, worth an average of £2.5m. Under a national LVT they pay an average of £33,000. Under a regional LVT, £49,000 – higher than Kensington. Even an average Band C house in Trafford now pays about £2,300 more LVT than council tax. Things are even worse in Newcastle-upon-Tyne, because its land valuations are so much higher than the surrounding areas. An average Band C property pays £2,700 more than it did under council tax; the 120 Band H properties pay an average of £84,509. 3.4% is just not a sustainable rate for a land value tax.
(I should repeat the caveat that this is an impressionistic model, and the direction will be correct, but the precise figures will not be.)
If you drag the slider to, say, the 50% mark, you can try to get a result somewhat balanced between the extremes, but you’re choosing between bad options.
One could try to avoid these problems by applying rates on a local authority basis. But there is never a free lunch. There will always be winners (with the degree of winning limited because LVT does not go below zero) and losers (with little limit on the degree to which they lose). If the intention is to stop very large increases (in all but the highest-end properties), then some other, more ad hoc solution is required. We make no attempt to model that.
Regional rates also – necessarily – mean there’s no equal national treatment: two identical land values can face different bills because of a boundary, and local rate-setting can create tax competition (which some will regard as advantageous and some as problematic).
The choice between national and regional rates is fundamentally a political one, but my takeaway from this is that a pure land value tax that replaces council tax and stamp duty is not viable without measures to soften the blow on people who’d experience very large increases. More on that later.
The impact on asset-rich, cash-poor
The classic problem case for the land value tax is an elderly person living in a large house without much income. They have no prospect of affording the land value tax.
A purist LVT response is to say that is an intended outcome.20 The point of the land value tax is for land to be used as efficiently as possible, and someone without income occupying a large house is not an efficient use. There are also ways that someone asset-rich, cash-poor can generate cash from their asset, whether it is by taking in a lodger or by borrowing under a reverse mortgage or similar arrangement.
The delightful old lady rattling around in a huge house is the most often cited example, but in reality it’s not a terribly common one.21 These aren’t reasons for ignoring liquidity issues. They’re good news, because they mean liquidity is an easier problem to solve.
Our model’s (optional) solution is a deferral, where a taxpayer can opt for LVT to “roll up” each year, with a modest interest rate, until they sell the property or die. Similar schemes abroad have had a surprisingly low take-up.22
The model does this if you check the “Deferral option” box. It assumes 10% of the eligible excess charge is deferred (a conservatively high figure given the overseas experience).
Deferral reduces first-year cash receipts by about £2bn. If we adjust the rate to reflect both deferral and transitional relief, then that increases the revenue-neutral rate to 1.46%.
(An important point. Some people have proposed deferral of land value tax completely. Our model takes the approach that, since you can’t defer council tax today, you should only be able to defer the excess of land value tax over the old council tax amount. That makes deferral very significantly less expensive.)
Some people face a very large charge
It shouldn’t be a surprise that very expensive properties have a very large land value tax charge. That is, in the end, the point.
The model shows top Band H properties in Kensington carrying an average LVT charge of about £53,000 a year (once more: this is an approximation).
This is likely to create concern that people will leave the UK. But a land value tax is the tax that worries least about such concerns, because land cannot emigrate. If a Kensington owner moves abroad, the house – and its land value tax – stays exactly where it is, paid either by them as a non-resident or by whoever buys it. Unlike income tax, a tax on profits, or a wealth tax on movable assets, the base cannot follow the taxpayer across a border. To repeat myself, it’s the one asset that we can tax more but not get less of.23
This is all made easier if the tax phases in – over ten years with 10% more of council tax and stamp duty abolished every year and 10% more of LVT applying. The “ten-year phase-in” switch in the model shows you the effect of that – every bill just moves a little bit towards the full LVT result (be that a cut or an increase).
The effect is somewhat soothing. Our Islington teachers, staring down a £3,600 increase on day one of a big-bang reform, now face £360. Kensington’s eye-watering five-figure rises become merely four-figure ones. Blackpool still benefits, but only a little. Everything moves in the same direction as before, and towards the same destination, but more slowly.
Farmers
Farmland creates a particular design problem. Many farmers report a return of around 1% of the value of their farmland.24 This surprises many people – and many economists. The reason seems to be that valuation is driven by uses other than farming: development “hope” value, lifestyle and amenity demand, capital-gains rollover relief, and agricultural and business property relief. A small probability of planning permission can rationally add substantial value because the potential uplift is so large. There also seems to be an extent to which farmers’ behaviour is not rational in narrow economic terms (and farmers I speak to readily admit this). A rational economic actor inheriting a £5 million farm would sell it, invest the proceeds in index funds, and never work again. Farmers inheriting land rarely do this.
The same mismatch between farmers’ income and the market value of their property contributed to the inheritance-tax controversy we previously discussed.
There are two possible policy responses.
The fundamentalist LVT response is that an owner unable to earn enough to cover the tax should sell, lease, intensify or change use. That need not mean the end of the farm – another operator might use it more productively – but it could mean the end of small farms.
There are obvious objections to that. Perhaps the result is following not from real economics but from a series of distortions in the market? And perhaps we want to maintain small farms for community, environmental and food security reasons, even if the farms are not economically efficient?
I take the second view, although I live in a rural area and I may not be objective. But on that basis, I would create a significant reduction in land value tax for actively farmed farmland.25
This is fundamentally an easier point to resolve than the application of inheritance tax to farmland. Agricultural relief for inheritance tax has always been a fantastic avoidance opportunity, because someone with assets subject to inheritance tax, who wants to avoid IHT, can exchange them for agricultural land which is exempt or partly exempt. Someone with land subject to land value tax who wants to avoid LVT can exchange them for assets other than land. There is no incentive to buy agricultural land to avoid land value tax.26
None of this is terribly relevant to our model because our model only covers residential property – but farmhouses would in many cases need to be covered by any farmland LVT relief or exemption.
What if we just replace stamp duty?
All the very big LVT figures in some of the examples above are a consequence of replacing council tax and stamp duty. There are many properties, particularly in the north of England, whose council tax is dramatically reduced by its replacement with land value tax. That then piles up as land value tax on London properties.
This creates obvious political challenges. So an equally obvious solution is to drop the idea of replacing council tax and only replace stamp duty. Then you only have to raise £11.5bn rather than £57bn, and things then become much easier.
Our model lets you do this with the big switch at the top. And suddenly, our teachers in Islington with their £520,000 house pay only £1,500 LVT each year, not the £3,600 increase they saw under “full-fat” LVT. And their neighbour in a £3.4m home would only pay £12,800 each year, instead of £48,000. The lowest council tax band properties in Blackpool pay nothing.
In many ways, this is an attractive approach – even if one buys the argument for a full land value tax, this could be a transitional step.27 But (as always) there are catches.
An administrative catch: the valuation work required for an £11.5bn LVT is exactly the same as for the full-fat £57bn LVT.28
And a political catch. Around 63% of people benefit in immediate cash terms under a full-fat LVT with transition and deferral. Their council tax disappears, and their LVT bill is less than council tax. Nobody receives this benefit from an LVT that only replaces stamp duty. Their annual bills can only go up. They may not mind if they are planning to move soon because they benefit from the abolition of stamp duty. They may be forgiving if they moved recently because they’ll benefit from transitional relief (at least for a while). But everyone else – people neither recently moved nor planning to move – loses from a stamp duty-replacing LVT. For all the economic advantages that I and many others would say replacing stamp duty has, in cash terms this proposal offers them nothing29 except a new annual bill – about £400 on average.
So I’m afraid a mere stamp duty replacement does not look very viable. It looks even less viable once we start thinking about administration costs…
The cost of running LVT
Having spoken to a variety of people with experience of HMRC and other government projects, we think the figure would be somewhere between £300m and £1bn each year. That’s the steady-state figure – the upfront cost would be larger. These figures should be seen in the context of existing council tax collection costs of £300m (incurred by local authorities) and an overall HMRC budget (not including council tax) of about £4.5 billion. So £1bn is very large indeed.
These figures are not very scientific, and the following paragraphs will try to justify them.
Our starting point should be that the current £300m cost of collecting council tax tells us little about the cost of collecting land value tax because, whilst council tax is much simpler than land value tax, it is administered individually by local authorities, and so there is a significant amount of inefficiency.
The new High Value Council Tax Surcharge (“mansion tax”) is a better point of comparison, because it requires a reasonably large number of new valuations to be conducted, albeit in bands and not with precision. It’s been reporting this is requiring the recruitment of 300 new valuation officers. 300 officers at an average gross employment cost of £70,000 comes to about £21m, which we should roughly double to allow for IT systems and associated costs. That covers the valuation of roughly 165,000 homes worth more than £2m. If we naively gross this up to England’s 26 million dwellings we get £6bn.
This figure must be nonsense, for two reasons:
- Ordinary homes are far cheaper to value than mansions. The mansion tax is expensive per property precisely because each £2m-plus home is unique, high-value, and valued individually against a bright-line threshold – which invites clustering, disputes and appeals over whether a house is worth £1.98m or £2.05m. The LVT would apply automated valuation models (see further on this below), which are an order of magnitude cheaper, and people would only have an incentive to dispute valuations if they were very significantly wrong.
- Land valuation is cheaper than property valuation. As we discuss in the valuation section below, property valuation is dependent upon the unique characteristics of particular properties. Land valuation is not.
- Economies of scale. The systems, data and methodology are largely fixed costs; spread across 26 million properties rather than 165,000, the cost per property falls sharply.
- Although… as a banded tax, one would think valuation for the mansion tax is a more straightforward task than valuation for a tax which applies on a percentage basis.
A useful sanity check is the HMRC Valuation Office (formerly the Valuation Office Agency, and created to administer Lloyd George’s original LVT attempt). In 2023-24 the VOA cost around £180m to run. Whilst it provides ad hoc valuation advice to the public sector, its main role is maintaining the council tax and business rates lists. The scope is therefore very similar to any new LVT valuation office, but the work required is significantly smaller given that neither council tax nor business rates require annual valuations. So some small multiplier of that £180m feels like the right figure.
Faced with these datapoints, the experienced HMRC and civil service personnel we spoke to essentially shrugged and estimated numbers in the range of £300m to £1bn.
If a full-fat £57bn LVT (replacing stamp duty and council tax) costs £1bn to collect, then that is a somewhat high collection cost – about four times the HMRC average. But £500m to collect an £11.5bn stamp duty-replacement LVT is another matter.
Our model, of course, ignores all administrative costs, for both HMRC and taxpayers.
Capitalisation – the known unknown
A classic blunder is to calculate the revenue from a tax by multiplying the tax base by the rate. That is a “static” estimate which ignores the consequences of the tax and the way people respond to it. There are approximately ten million men with beards in the UK. If the Government introduces a £10,000 tax on beards, it will not raise £100bn.30 For most other taxes, there is a more subtle taxpayer response than shaving, but the point remains: you cannot estimate tax revenue with a static analysis.
Our LVT model estimates LVT revenue with a static analysis. This is for two reasons: a dynamic analysis is too difficult, and a dynamic analysis changes many things, but (for reasons I will discuss) in practice ends up having only a limited net effect on tax revenue.
The reason this matters is that a credible, permanent land value tax would change property prices – in some places sharply. Not uniformly, and not always in the direction most people assume. Some homes would fall in value; others would rise. And that would change the rate, the revenue, the measured land share and the distribution. We know there would almost certainly be an effect. But for the reasons I’ll discuss below, the scale of the effect is unclear.
This effect is called “capitalisation”. To explain it, we should start by asking an easier and apparently unrelated question: how much would you pay to buy the right to receive £128,000 each year, forever?
We first need to determine your “discount rate” – how much happier you are to receive money today than money next year. Say it’s 3% – that means that you’d pay £97 today for £100 in a year’s time. You should then be willing to pay £4.3m – because if you put £4.3m in a bank account yielding 3%, you’d receive £128,000 each year.31
Now imagine an empty plot of land worth £10m (before anyone expects LVT to be introduced). The Government initially wants to raise the equivalent of 1.28% of that value: £128,000 a year. At a 3% discount rate, a permanent annual liability of £128,000 has a present value of £4.27m. The land would therefore fall in value to about £5.73m – a fall of 42.7%32. The Government still wants its £128,000, so it would have to charge 2.23% of the new, lower land value. That is the stable point: 2.23% of £5.73m is £128,000.
Do that across all of English residential property – on a 1.28% rate,33 and on the assumption that land is 55% of housing value – and a 42.7% fall in land value looks like an average fall in total residential property values of about 23.5%.34 That is the mathematical result of introducing a land value tax. It is also wrong – or rather, it is the answer to the wrong question.
The mistake is to look at land value tax in isolation. Every home in England already pays council tax, and everyone who buys one already pays stamp duty – and today’s prices already reflect both.35 A full-fat land value tax does not add a tax; it abolishes council tax and stamp duty and puts LVT in their place. So what gets capitalised into the price is not the whole land value tax, but the change in the annual bill: the new LVT minus the council tax it replaces.
That’s why, “overall”, there is probably little effect. Because the reform is revenue-neutral, the total land value tax (£56.7bn) is, by construction, exactly equal to the council tax and stamp duty it replaces. Across England, we are simply swapping one stream of payments for another of exactly the same size. The average home’s annual bill is unchanged, so there is little to capitalise, and no reason for prices to fall significantly. The frightening 23.5% is mostly an artefact of forgetting the two taxes we are abolishing.36
But, beneath the surface of overall flatness, plenty is going on. Employment can be flat even while millions of people lose jobs and millions of others find them. If everyone is an economics professor, then everyone gets a change in home value equal to the change in their annual bill divided by the discount rate. The model already shows you the change in the annual council tax bill. It’s the number used to colour the map. So everywhere you see coloured red, replacing council tax with LVT drives price falls, and everywhere coloured blue sees price increases. That is, however, only part of the picture because it doesn’t take stamp duty into account – the abolition of stamp duty should increase prices, with a bigger effect on high-value properties with huge stamp duty charges. But a perpetual annual charge is a far bigger thing, economically and in psychological terms, than a one-off saving on some future sale, so the very top still faces a net fall – just a smaller one than the coloured map implies.37
Our model generally ignores capitalisation, but displays a crude capitalisation estimate if you hover over the results table for a local authority or region. You’ll see an estimate for the one-off change in that home’s value – the change in the annual bill divided by 3%, taking account of the saved stamp duty. A few examples:
- Most of the country barely moves. Hover over a typical home in an ordinary area – say Leeds – and the estimate is within a whisker of zero: a Band D home is about −1%, the average home about +7%. The new land tax is close in size to the council tax and stamp duty it replaces, so for the typical household there’s not much going on. In practice, these kinds of changes would likely be invisible.
- At the top the effects are significant. The average home in Kensington & Chelsea faces about £15,750 a year more, which capitalises to roughly £525,000 off its value at 3%. Abolishing stamp duty softens the blow – a £100,000 saving on a sale – but a perpetual annual charge dwarfs a one-off saving, so the estimate tooltip still lands at about a 27% fall in property prices. The effect is exacerbated by the fact that, in prime London, land is a much higher proportion of the property price.
- Our Islington teachers sit in between. Their £520,000 flat would pay about £3,000 a year more – and, after taking into account the stamp duty saving, it’s a fall in value of 17%. Quite possibly negative equity, if the teachers bought a week before the announcement.
- Massive increases in value in some areas. In Blackpool or Hartlepool, where council tax is high and the land is worth almost nothing, the annual savings are large, and the tooltip estimate shows gains in value of 40 to 70%.
So capitalisation under a full-fat LVT is not a national crash. It’s an average nothing, disguising a large, concentrated fall at the top – prime London and the commuter belt – mirrored by a large, concentrated rise across much of the North and the coastal towns.
The losses in prime London and the South East could mean negative equity, real losses for lenders, and stress right up to insolvency for ongoing and planned construction, development and infrastructure. The obvious upside is that it improves affordability in these areas, but, even for those of us who believe current house prices are too high, and that this is a serious problem, the answer is not a sudden dramatic drop in house prices.
There is also an equity problem which bothers me. Capitalisation behaves a lot like a one-off levy on the land wealth of whoever owns at announcement. Someone who acquired land immediately before an LVT announcement may lose the full capitalisation amount. Someone who acquired land afterwards can lose little or nothing (because they pay the LVT in the future, but saved because it was “capitalised” into a lower purchase price). That’s a very random and unfair one-off wealth tax – I sometimes call it the “hot potato” problem, but people look at me strangely.
And of course we see the opposite effect in e.g. Blackpool. A long-term rise in Blackpool property prices may well be a good thing, but a sudden one-off rise is a different matter. It’s the opposite of the hot potato problem – call it the “pass the parcel” problem. Whoever owns property in Blackpool at the point a land value tax is announced suddenly receives an arbitrary windfall. The speed means it doesn’t result in a big win for Blackpool, but a big win for the lucky people holding the property when the music stops. Landlords gain; renters do not. Affordability for new buyers gets worse. Wealth inequality between Blackpool and Kensington improves, but wealth inequality within Blackpool gets worse.
These are not obviously great results.
How big any of these effects are depends heavily on the discount rate, which I just blithely assumed at 3%, without doing any thinking. That figure is on the low side, which is a good choice if we are trying to stress test scenarios. At a 6% discount rate every figure above roughly halves.
It also depends on how realistic it is to say that market value follows a mathematical formula. Even on its own terms, that formula assumes a constant rent, a fully credible and permanent tax, no credit constraints, no supply response and full information – all of which push the real effect down, not up. So the 27% collapse in Kensington example is highly theoretical and, even taken at face value, close to the top of the range.
At this point, I’d usually turn to the literature. But, less than helpfully, estimates in that literature range from no capitalisation to more than full capitalisation.38
Some people say phasing is the answer. I am not sure it is a complete one, but it clearly helps. In theory, a fully credible phase-in should be priced into land immediately (with a discount), even if it took twenty years for the LVT to fully apply. But in practice nothing is fully credible, and people are bad at incorporating long term effects into their planning. So it would be most surprising if twenty years of uncertainty produced an instant, complete repricing. More realistically, phasing gives households and markets time to adjust, and it is precisely the concentrated high-value falls – the dangerous part – that a long transition can spread out most effectively. That is what happened in the Australian Capital Territory, which in 2012 began a 20-year switch from stamp duty towards annual land taxation. There was no market crash – and the land value tax isn’t even visible if you eyeball the data.39 And whilst a large crash in land values could be a disaster, a gentle decline is – in my view – no bad thing at all.
So where does capitalisation leave us? It is, again, regional redistribution – sharp, concentrated falls in high-value areas, offset by rises in cheaper ones. My tentative conclusion is that this makes a full-fat land value tax a genuinely high-risk endeavour – and manageable only if the transition is slow, credible and deliberately gentle, and if the real-world discount rate is kinder than the naive arithmetic.
We’d minimise these effects if land value tax only replaced stamp duty but, as we have seen, that leaves too many people simply worse off, with (from their point of view) no upside.
Valuation: the known challenge
How do we value land?
The whole difficulty of a land value tax is separating the value of the land from the building on it. That’s relatively easy in rural areas where bare plots frequently change hands – you just look at the market price (although the question of how LVT applies to agricultural land is difficult – see above). New development on formerly empty land gives you an ideal data point because you see the purchase price of the empty land and the subsequent price of the developed housing. But in built-up areas, this approach runs into the immediate problem that sales of bare plots are unusual. You can’t rely on direct market evidence of market value and have to construct a synthetic market value. And those built-up areas are exactly the areas where most land value tax will be collected from. Think central London.
There are basically three workarounds: abstraction (the residual method we use – property value minus depreciated rebuild cost); allocation (assume land is a typical percentage of value for the area); or hedonic40 / contribution-value regression (statistically estimate the marginal value of land attributes from a large body of sales).41
In the modern world, all these methods can be combined using public and government data to model location value. However, proponents of land value tax have to acknowledge that there is no magic bullet; there is a solid literature on theoretical approaches, but the history of actual implementation is discouraging.4243
The Welsh research
There is more analysis on valuation methodologies today than at any point in the past, thanks to the Welsh Government. In March 2026 the Welsh Government published parallel studies by the Valuation Office Agency, universities and commercial teams using hedonic regression, machine learning, formulaic, conventional and entirely new and experimental approaches. All the work used desktop data rather than visiting sites.
The many different approaches broadly agreed about where Welsh land values are high or low; and machine learning predicted whole-property prices better than simpler models.
But absolute land-value levels differed, and differed enough that no land/building decomposition could be uniquely validated. None of the tested methods was accurate enough to be deployed in a live land value tax.
So, whilst this was a hugely valuable exercise which anyone interested in LVT would do well to read, it did not result in placing an implementation-ready solution onto our shelf. The key documents are footnoted here.44
The wider LVT literature
One of the most consistent elements in the LVT literature is the inconsistency of different approaches to valuation. When the Lincoln Institute compared land-value estimates across three US jurisdictions, the methods disagreed markedly – differences45 of about 23% (contribution value), 32% (abstraction) and 44% (allocation), all above the professional standards for the taxes in question. Those were differences between the three jurisdictions, not error against a true market price: urban vacant sales were too sparse to supply any. So we can’t know if any of the jurisdictions were in fact correct. In theory, there would be data from the twenty-nine US states that require land and improvements to be recorded separately, but ordinary property-tax liability does not depend on that split, so neither taxpayers nor tax authorities have any motivation to perfect or test the figures.
Land is valued at scale elsewhere despite the difficulty: Estonia values land from databases and New South Wales values about 2.7 million parcels annually, using a component and benchmark system. Taiwan operates both an annual land value tax and a land value increment tax. Denmark is a cautionary example. It introduced a land tax in the 1920s, at almost exactly the moment Britain gave up on one. Danish valuations were suspended in 2013, after the national audit office found three-quarters of house valuations bore no relation to market prices. So they decided to replace the old valuation system with an automated computer model. Nine years after the scheduled completion date, the rollout remains incomplete – it’s regarded in Denmark as a major IT scandal. Denmark’s response to all this has been to apply their land tax on a value that’s discounted by 20% from their modelled valuation.
Lloyd George tried to implement land value tax from 1909-1914, but failed for a variety of complex and disputed reasons – the tax was eventually repealed in 1920.46 Samuel Watling has used that history to argue that a pure tax on the unimproved value of land “has never been successfully implemented anywhere”. Watling adds that Australia and New Zealand later wound their land taxes back, that Denmark’s land tax raises under 2% of revenue, and that Taiwan exempts owner-occupied housing and agriculture. Pure land taxation, he says, has never really worked. It’s a powerful and well-argued paper and substantially correct. One criticism can be that the taxes he critiques were not true land value taxes, but this type of reasoning is never very convincing.
Lloyd George’s failure has prevented any attempt to return to land value taxation in the UK, aside from an experiment in Whitstable in the 1960s and 1970s.
So it is impossible to deny that land value tax has historically floundered in valuation difficulties. Any UK implementation has to seriously consider all of the history, messy as it is47
I tend to think the correct answer to the fairly dismal history of LVTs is in part technological and in part pragmatic. The technological part is that modern valuation methods and modern technology mean that some of the historic failures are not relevant – although it is obviously imperative that no land value tax is allowed to commence until valuations have been validated (one can imagine some kind of oversight body created to perform such a function).48 The pragmatic part is that some degree of error is inevitable in all valuation systems. Even our existing taxes suffer from it – council tax bands are an exercise in time travel to 1991. Stamp duty is almost always overpaid to some degree because most people don’t separate “fittings” such as curtains from the price paid.49 These are relatively small errors, but any property tax based on a percentage of property value will have much larger ones – and there is reason to believe that errors in land value tax valuation create no more distortion than errors in an ordinary property tax.50. Accuracy is less important than consistency, fairness and perceived fairness.
The alternative – the PPT
Fairer Share’s Proportional Property Tax (PPT) is a serious alternative and would be a significant improvement on council tax and stamp duty. It is not, however, a land value tax. It is, as its name implies, a simple percentage tax on property (buildings and land).
I have a strong preference for land value tax, because taxing the whole property also taxes extensions, rebuilding and renovation: improve the home and the tax base rises. So the PPT creates an incentive to not improve property. Or the flip side: it doesn’t create an incentive to improve property. We can put a number on this effect: a 0.48% annual tax is equivalent to imposing an approximately 16% up-front tax on the value created by home improvements.51
That might be a price worth paying if a PPT eliminated the valuation difficulty – and that’s basically the claim being made:
“Valuing land separately from the property is far more complex, requiring subjective estimates of “bare land” values that are harder to administer, update, and defend. By contrast, whole property values are well understood, widely available, and already used in the market, making them a more robust tax base.”
It’s true that property is frequently valued, but most property is not valued every year or, indeed, very often at all. About 42% of housing hasn’t sold since 1995, and there is no data available on the price it fetched. Looking at the market price achieved for a house is highly reliable when the sale was last week. It is less reliable when the sale was last year (what if the property was completely refurbished?), and of doubtful relevance when the sale was 20 years ago. Some suggest this can be resolved by cross-checking on an automated basis with the Land Registry, local authority planning permissions, and satellite imagery. That is not a viable approach. None of this tells you anything about construction technique, condition, fittings and refurbishment, or indeed the standard of any work that was undertaken. You can’t see a kitchen from a satellite, and a £300,000 kitchen and a £2,000 kitchen may appear identical on a planning application. The variation in construction cost between different projects of identical size can be extreme.
Property valuation has to be done by reference to the actual features of the inside and outside of the property in question: floor area, extension, age, condition, fittings and refurbishment. Land value is driven more by plot, permitted use, location and surrounding amenities, which can be determined on an automated basis from public and private data sources.
This is why council tax and the recently introduced “mansion tax” apply to valuation bands, not precise valuations. It means valuation disputes occur only at the boundaries, and so greatly reduces the need to look at people’s kitchens.
All of which creates a paradox. Land valuation is rarely undertaken in practice, but in principle land across England can be valued from the desktop. Property valuation is commonplace in practice, but cannot accurately be undertaken from the desktop.
My view is that, counterintuitively, land value tax is therefore very possibly easier to apply across England than a proportional property tax. Easier but not easy – for the reasons discussed above.
I should, though, be fair to the other side of the argument. A whole-property valuation has one advantage a land valuation can never match: you can check it against something real – what the house next door actually sold for. A land valuation has no such anchor. As the Welsh research showed, there is simply no market in urban land against which to test the land/building split, so that split is, in the end, unverifiable. So while I think land is, on balance, the easier of the two to value across England, it is a genuinely close-run thing – and anyone who weighs verifiability most heavily should reasonably land the other way.
The details of the Fairer Share proposal:
- an annual charge of 0.48% of the current market value of the whole property for an owner-occupied home: so £960 on £200,000.
- Then 0.96% for second homes, empty homes and overseas-owned homes (I don’t think these are good features because of the definitional complexity, potential for unfairness, and the sheer randomness of taxing one person with two £200k houses more than another person with one £400k house).
- It would replace council tax, residential stamp duty and the “bedroom tax” and is calibrated to raise the same revenue, not extra revenue.
- Fairer Share says roughly 75-77% of households would pay less. Its parliamentary evidence gives an indicative 0.32% national / 0.16% local split, combining redistribution with a locally retained element.
- The transitional rules are that, for an existing owner the annual increase, not the total bill, would be capped at £1,200. I feel they have not properly thought through the implications of this in terms of deterring future sales and/or falls in value. The capitalisation effects will be as difficult as those discussed above.
- The reform would be phased in over three years.
- An owner unable to pay could defer payment until affordable or until sale; and the cap disappears when the home is sold, so the purchaser pays the full 0.48%.
- See Fairer Share’s 2020 Treasury Committee evidence and the later FAQ for details.
- See also the PPT overview, manifestos and technical reports, and IPPR’s analysis of the national design and London impact.
Fairer Share published figures on the impact of their proposal. The methodology is described at a high level here, but the most important element – how they value individual properties – is not fully explained and not reproducible, and Fairer Share don’t publish the underlying detail or code. We hope they consider doing so, as enabling researchers and the public to model changes in tax design is incredibly useful. The constituency and local-authority modelling published on their website appears to rely on a simplified area-based approach rather than individual property valuations. The individual-property-estimator appears to be broken.
Incidence, planning and local government
This report was intended to look at modelling an LVT, and the policy choices and difficulties that can be illustrated by the modelling. There are other important issues and challenges of an LVT which a model does not help us with at all. So this report doesn’t cover those issues – but I will mention them in passing.
Economic incidence
Who pays a tax? The obvious answer is: the person responsible for paying tax. This is the “legal incidence”. When I buy a bar of chocolate, the person legally paying the VAT is the shop. If Labour increase corporation tax, it’s the company paying the tax.
But who is actually paying the economic cost of the tax?
I think everyone knows that if VAT went up, it would be the customers who economically pay the additional tax in the form of an increased price. If corporation tax goes up, then the company is not economically getting anything because the company is a mere legal fiction. The real cost of an increase in corporation tax is borne by some mixture of shareholders, employees, customers, suppliers (it is highly contested, and muddled by people striving to reach the conclusion that suits their political agenda).
What about land value tax?
Legally it’s paid by the landowner. That means the owners of freeholds and long leaseholds (e.g. most London flats). It’s never paid by tenants under assured periodic tenancies as a legal matter.
But can the landlord then pass it on to tenants, either directly (via some kind of indemnity) or indirectly (through rises in rent)?
The orthodox economic answer is that the landlord cannot do this, and a tax on land falls primarily on the landowner. Rents are determined by what tenants are willing to pay and the supply of competing homes, not by the landlord’s costs. Instead, the future tax liability is capitalised into a lower value for the land. The owner when the tax is introduced bears the loss; a later purchaser buys more cheaply, in return for accepting the annual tax. A counter-intuitive but inevitable consequence of capitalisation is that landlords carry the can.52 It is not, however, certain that this would be the result – and for this reason, it’s sometimes suggested, even by the IMF, that landlords should be explicitly prohibited from passing on LVT costs to tenants (I’m unclear how effective such a rule would be in practice).
This creates a limitation in our model. It compares the LVT attached to a home with the council tax attached to that home, as though the two taxes were always paid by the same person. For an owner-occupier, they are. For a rented home, the tenant loses their council tax bill and the landlord acquires the LVT bill. The long-run economic benefit or cost may still fall mainly on the owner, but the immediate cash flows are different. So when we describe “winners”, the precise claim is that a home carries a lower modelled liability — not necessarily that its current occupier personally receives the whole saving.
In other words, if we imagine a property where land value tax is exactly equal to council tax, in the short term land value tax is a big gain for tenants and a big loss for landlords. In the long term, as prices adjust, the position of a tenant and landlord of such a property should be flat.
Planning and “highest and best use”
The claim that LVT encourages land to be used efficiently depends on how the land is valued. There are three broad possibilities: its existing use, its currently permitted use, or its “highest and best use” — broadly, the most valuable development that could realistically obtain planning permission.
Existing-use value is the easiest to apply, but reduces the incentive that is the cornerstone of the economic case for land value tax. A criminally under-developed site continues to be taxed as an under-developed site. Land value tax becomes just another tax, rather than a way of reforming the use of land.
Highest-and-best-use valuation creates an economically useful pressure to develop or sell, but requires the valuer to predict what the planning system would permit. Every little cottage, boutique shop and piece of farmland in the country would require a psychic valuation officer to determine if planning consent could be obtained for some maximalist development project. That seems unworkable.
“Currently permitted use” seems more sensible – in other words, it’s not what you’re doing with land today, it’s what you could do given the limits of planning law. There’s an advance on this in Hughes, Sayce, Shepherd and Wyatt’s report for the Scottish Land Commission, which suggests “most profitable permissible development” as a possible definition. In other words, you look solely at the current planning position, but think about what you can do within that.
As with everything land value tax related, things get more difficult at the edges. Planning permission doesn’t require you to undertake work. It just enables it. Permission lapses after three years, but if you’ve started development, the permission remains live forever. So it’s common for people to apply for planning permission for something very ambitious (say, numerous buildings on a site), but actually only build one. Anyone owning or buying a property like this could be surprised by a much higher LVT bill than they expected. And going forward, people would apply for paying permission on a more modest basis to avoid an escalating LVT charge. Some people might go further and deliberately make applications that reduce the value of their land.
There’s then the evil version of that. Under current law, anyone can apply for planning permission for any site. I could right now apply for permission to convert the BBC’s headquarters into flats. I suspect the BBC would object, but if that permission was granted the land value tax liability of the BBC would soar. Tricks like this could be a licence for mischief-makers and aggressive developers.Perhaps Planning Law would need to change to restrict the people entitled to apply?
Local government finance
Our model treats English council tax as if it were one national pot of money. It isn’t. Council tax is set and collected locally, and sits inside the spectacularly complicated system by which local government is financed.
This operates by a formula. In simplified terms, central government estimates each council’s relative need for services, adjusts for differences in the cost of providing them, and then takes account of the resources the council could raise locally from council tax. Grants and retained business rates are adjusted so that councils with high needs and weak tax bases receive more support.53
Some people wail and gnash their teeth at land value tax and say that it would be quite wrong to break the local nature of council tax (and its predecessors). But council tax is only as local as the formula permits it to be. Land value tax merely requires a new formula; if it was desired to leave local authorities in the same position as they are today, then the formula could achieve that. No doubt this would be very complicated, but it is not a point of principle.
Conclusion
So where does all this leave us? I remain a supporter of a land value tax. The principled case is overwhelming, and the practical prize is real and large: abolishing stamp duty, the worst tax we have, and replacing the wheezing 1991 relic that is council tax with something far more equitable.
But our model – with all its limitations – has made me much more cautious about how we get there. A land value tax done carelessly would inflict real individual hardship – on the Islington teachers, on the asset-rich and cash-poor – and risk serious market disruption through capitalisation. Avoiding that is not optional, and it is not easy. It probably requires most of the tools in this article at once: transitional relief for people who have recently paid stamp duty, deferral for those who genuinely cannot pay, and – above all – a long and credible phase-in that lets prices and people adjust gently rather than overnight.
The price of doing it safely is patience. Each of those softeners pushes the full benefit years, even decades, into the future – which is frustrating for those of us who find the argument compelling today. But a reform this big, reaching into the home that is most people’s largest asset, has to be done slowly or not at all. And the prize – a country that no longer taxes people for the crime of moving house, and no longer asks a modest home in Blackpool to pay more than a mansion in Westminster – is worth waiting for.
Caveats and limitations
This is an impressionistic model. More than “just a bit of fun”, but certainly not a robust valuation exercise. It is built to show the rough scale of a land value tax and, above all, its geography – who wins and who loses, and roughly by how much. The direction of travel should be correct, but individual figures are no more than illustrative.
This is a quick summary of the main limitations of our approach, but it’s not a complete one. See more in the methodology below:
- An entirely static model. There is no attempt to model any response in prices, construction, tenure, moving, borrowing, avoidance, evasion, collection or planning to the tax. Capitalisation, particularly for the LVT that replaces council tax and stamp duty, could change both the statutory rate required and the measured distribution. All of these factors would require careful consideration.
- Land value per home, not per acre. We take a crude but, we think, defensible approach to estimate the value of the land sitting beneath each dwelling. It’s all set out in the methodology below, but our figures can look badly wrong if set against the wrong benchmark. Land in central London is worth vastly more per acre than land in the suburbs – yet a central London flat sits on a tiny sliver of it, while a suburban house sits on a much larger plot. Measured per home, those two effects largely cancel, so our modelled land values per home vary far less between areas than land values per acre. Someone comparing our per-home land figures against a per-acre land-value map could therefore mistakenly conclude that we are wildly wrong – potentially by an order of magnitude.
- Administrative costs for taxpayers and HMRC are not included in our model. We suggest above this could be of the order of £500m for HMRC; taxpayer costs might be similar. Not very significant for a complete land value tax, but of outsized significance for a land value tax that only replaces stamp duty.
- Residential only. Commercial, industrial, agricultural and undeveloped land are absent. The model therefore tests replacement of English residential council tax and residential SDLT only; it does not model replacing business rates or non-residential SDLT. Generally speaking, the argument for a commercial land value tax is stronger and easier than for a residential land value tax because businesses are already taxed on the basis of property value (albeit in a very inefficient way).
- The land/building split cannot be verified. Urban vacant sales are unusual, so the overall level rests on assumed rebuild costs and a 55% land-share calibration. These are assumptions.
- No adjustment for council tax support schemes. There is no national scheme for relief from council tax for people on low incomes or otherwise in need of support, but individual local authorities are required to provide support schemes. None of this is modelled by our model, and so council tax will in some cases be overstated.
- No adjustment for social housing. About 16% of dwellings are social housing. Our model makes no attempt to separate social housing from privately owned housing. There are, however, two key differences. First, whilst a design and political question, it seems most unlikely that net land value tax would be collected from social housing, because it would be government taxing government (or government taxing housing associations, which is technically possible but surely politically unpalatable). So real LVT would exempt social housing; our model does not, and so overcounts land value tax revenue. This will probably not be a large error because social housing is usually relatively low value. But fundamentally, we cannot determine the degree of overcount for social housing; it follows that we cannot determine how much the rate would have to rise to keep revenues neutral. If we were modelling non-residential land, then we would have the significant challenge of excluding government-owned land, however that is something the current residential-only model does not need to do.
- Homes outside the retained sample. About 42% of housing hasn’t sold since 1995 and isn’t in the price paid database. Others will have been excluded by property type or removed as anomalous. The value and type distribution of these missing properties is inferred from sales. We expect, although this is intuition rather than data, that this results in an undercount of land value tax because some very high-value estates never change hands (for example, because they are held by a long-established trust) or held by a company and sales are effected by selling the company. But there will also be cases of, e.g., abandoned properties that haven’t changed hands for generations but are worthless.
- Aggregated, not individual. Figures are built up to local-authority-by-band cells, not valuations of individual homes. Within any cell the model is just an approximation.
- Synthetic council-tax bands. Price Paid Data does not supply the council tax band, so 2026-ranked sales are cut to reproduce 2025 band counts. Relative values absolutely will have changed since the statutory 1991 valuation date.
- Rough inputs. We approximate floor areas using typical national values by property type, and approximate building costs using broad regional factors.
- No household characteristics. The model has no income, age, tenure, mortgage, benefit, disability, occupancy or ownership-portfolio data. Its “winners” are representative valuation points, not identified families, and it cannot measure distribution by income or wealth.
- First-year position only. Transition and deferral are aggregate first-year cash calculations. Historical SDLT and take-up are simplified. We don’t consider what happens in subsequent years. Almost inevitably, revenue will rise, and policymakers would have to choose between keeping neutrality and reducing the rate, or keeping the rate and raising revenue. It seems to me imperative that this choice is made up front and locked into the way the land value tax works (and my strong preference is neutrality).
- No exemptions or special rates. I suspect there has never been a tax without exemptions or special rates. However, this model assumes land value tax is such a tax. That is clearly incorrect, given that I think it is almost inevitable there would be an exemption or special rate for farmland, and some residential property is realistically part of farmland. So this will lead to a slight over-count in revenue.
- Highly approximate valuations. Everything relies upon interpolating and extrapolating property values from Land Registry data, and then applying a simplified abstraction method to estimate the value of land. This is a highly approximate process. More about that in the methodology section below.
- Displayed bands ignore council tax complexities. The global council tax revenue calculation takes into account the level of single person discounts and other exemptions. It doesn’t take into account council tax reduction/support schemes. The displayed figures for individual bands in a Local Authority take no account of any discounts or exemptions and are therefore showing the basic council tax result (not a model limitation, but a design choice taken to avoid too much visual complexity).
- We ignore that LVT would be tax-deductible for landlords. Albert Salter spotted this in the comments, and he’s right: we’d missed it. Council tax is paid by the tenant, who gets no deduction for it. Land value tax would be paid by the landlord – and an annual tax on a let property is an ordinary expense of a property business, so it comes off their rental profits.54 HMRC therefore collects less income tax and corporation tax, and our revenue figure is too high. An extremely approximate estimate based on housing data suggests the hole is around £2.54n.55 We can cross-check this from rents and reach about the same figure.56 Either way that’s about 4% of the £56.7bn we’re trying to raise, which would push the revenue-neutral rate from about 1.28% to about 1.34%. This is a serious amount of money, but haven’t rebuilt the model for it for several reasons: (a) the £2.4bn figure is highly approximate, even by the standards of this model, (b) it’s also about a fifth of the ~20% valuation error we’ve already said we expect, and (c) it changes none of our conclusions.57
- No economic modelling at all. The whole point of the reform is that land value tax has pro-growth effects, in terms of replacing existing anti-growth taxes and creating positive incentives for economic growth. We make no attempt to model any of this (it’s not our expertise).
To give an idea of what all this means in practice, our mansion tax estimate undervalued property overall by about 20% compared to the much-more-sophisticated OBR figures. There are many more uncertainties in our land value tax calculation than in our mansion tax calculation; whether, overall, this results in an under-valuation or an over-valuation is hard to say. It would be realistic to expect an error in a similar ballpark.
Methodology
The model uses public data to estimate a current value for millions of individual homes, splits each into land and building value, and then aggregates everything to the level of a local authority and a council-tax band. The model was designed and tested by humans. The code for the model and the UI was written with the help of AI (Claude Code), and AI/Claude was used to ensure that the methodology described below is an accurate description of the model. All the code is available on our GitHub.
The data
- HM Land Registry Price Paid Data – qualifying residential transactions lodged for registration since 1995; it is not a complete record of every change of ownership.
- ONS National Statistics Postcode Lookup (May 2026) – maps each postcode to its 2025 local authority and region.
- UK House Price Index (to April 2026) – used to uprate old sale prices to current values.
- VOA Council Tax stock of properties (2025) – the official count of dwellings in each council-tax band in each billing authority.
- MHCLG Council Tax levels (2025-26) – the area-average Band D charge for each billing authority.
- ONS Local Authority District boundaries (May 2025) – for the map.
Estimating each home’s current value
We start from 30,706,118 price-paid records whose property type is detached, semi-detached, terraced or flat; Land Registry’s “other” category is excluded. We identify a home by normalised postcode, primary address number/name and secondary address (for example, the flat number), then keep its most recent recorded sale. That produces 16,070,913 apparent unique homes, of which 15,259,039 match to an English local authority. This address key can occasionally merge or split properties incorrectly. Each retained price is uprated to 1 April 2026 with the all-property House Price Index for its local authority, falling back to its region and then England where an index is unavailable. This assumes the particular home moved with the area-wide index between its sale and April 2026; it cannot observe extensions, deterioration or renovations after sale.
Some records are not reliable estimates of a whole home’s open-market value – for example shared-ownership fractions, connected transfers and nominal consideration. Left in, these cluster in the cheapest modelled band and can dominate it where band A contains few homes. We therefore drop an uprated value if it is below the higher of £30,000 and 30% of its local authority median – about 1.8% of records. This is a crude attempt to exclude anomalies.
Screening out anomalous sale prices
A small number of HM Land Registry records do not describe one home changing hands at one market price. Instead they show a whole block of flats, a portfolio of properties, or a mixed commercial-and-residential building, which is all sold at once, and is then registered with a single price across all the titles. This can result in anomalously large prices – for example, if a street of modest houses are all sold together for £5 million, then sometimes each property will have £5m separately on its Land Registry entry. Or a £1m residential property sold with a £539 million commercial property can both have £540m on their entries.
This happened in the first version of the model with one cell in Waltham Forest recorded as a £540m “terraced house”.58
Removing these records is harder than it looks, because a high price is not the same as a wrong price. Genuine homes in prime central London change hands for £50m and more.
We therefore judge each sale against its own like-for-like local market. A sale is set aside only if its value exceeds a set multiple of the median value for the same property type in the same local authority, with the benchmark widening to the region where a local sample is too small to be reliable. The multiple is loosest for detached houses, which can genuinely stand far above their local median, and tightest for flats, where a price many times the local norm almost always means a whole block booked as one unit.
We use these multiples:
- Detached – 25x the local like-for-like median
- Semi-detached – 18x
- Terraced – 15x
- Flat – 12x
This screening process removes about 1,300 of roughly 15 million sales. It leaves national picture essentially unchanged, but avoids anomalous local results.
Splitting land from buildings: the abstraction method
For this model, land value is the estimated whole-property value minus an assumed rebuilding cost. We assign every detached home 147m², semi-detached home 96m², terrace 82m² and flat 57m²; multiply by type-specific base costs of £2,100, £1,950, £1,900 and £2,400 per m² respectively; apply a regional factor from 0.92 in the North East to 1.15 in London; and finally apply one national calibration factor (0.70550 in the current data). The model has no actual floor area, building age, condition, depreciation, construction quality, plot size, planning status or individual rebuild cost. A newly built mansion and a dilapidated detached house in the same region receive the same assumed building cost if their Land Registry type is the same. This is why it must not be used to value an individual home.59
We then force everything to fit so we end up with the correct national totals. First, all property estimates are multiplied by 0.77885 so the grossed-up English housing stock is about £8 trillion. That target is an approximate England share of Savills’ £9.18tn UK estimate. Second, the rebuilding-cost calibration is chosen so land equals 55% of value in the retained sold-home sample; after grossing up, the model contains £4.433 trillion of land, 55.4% of £8 trillion of housing. There is no single external series that validates any of this, and it should all be regarded as unverified but convenient (and, we think, reasonable) assumptions.60 Where assumed rebuilding cost exceeds estimated property value, land is floored at zero rather than allowed to become negative. About 13% of the retained sold-home sample is at that floor.61
From homes to council-tax bands
The Price Paid Data does not identify a home’s council-tax band. We therefore rank the retained sold homes within each local authority by estimated 2026 value and cut that ranking at the shares needed to reproduce the authority’s official VOA band counts. This is all a heuristic – the model does not know the actual band of any sale, and band boundaries based on 1991 relative values will not always match a ranking by 2026 value. The model is designed to reproduce the official 25,755,290 dwellings and the A-to-H counts in each authority.
Gross council tax is the authority’s area-average Band D figure multiplied by the statutory ratios, from six-ninths for A to eighteen-ninths for H. For national and regional revenue only, we multiply gross liability by 0.83 to produce £45.217bn. That factor is calibrated to approximate aggregate receipts after discounts, exemptions, council-tax reduction and non-collection; it is not calculated household by household. We add an external £11.5bn estimate for annual English residential SDLT, producing a £56.717bn baseline. This is what’s targeted when the model is trying to be “revenue-neutral”.
Aggregation and coverage
Everything is aggregated to 296 local authorities × eight bands, with empty combinations omitted. Each cell keeps ten representative points: the mean land value in each equal-count tenth of the retained sold-home sample. Their unweighted mean equals the cell sample mean, so a flat rate reconciles to the displayed totals; a progressive schedule remains an approximation because every tenth is represented by one mean. The roughly 15.0m retained sales-derived homes are then reweighted to 25.8m official dwellings. This assumes unsold homes in each authority and synthetic band have the same type and value distribution as sold homes there – an untested and potentially important selection assumption.
The tax you design, and the “revenue-neutral” rate
The land value tax is applied to each representative land value using the schedule a user sets: a flat rate or marginal bands. Tax is calculated at all ten points and averaged, which is more accurate for a progressive schedule than taxing the single cell mean, but remains an approximation of the unknown within-cell distribution.
The “roughly revenue-neutral” flat rate is solved by bisection so first-year net LVT equals the model’s £56.717bn council-tax-plus-SDLT baseline. None of this takes any account of capitalisation, or any behavioural effects. It is an entirely static model. This is an important limitation, but for the reasons discussed above, we think it is significantly less important than for most tax modelling.
Transitional stamp-duty relief
The optional transitional rule creates a notional credit for recent purchasers: 100% for the most recent cohorts, then ten percentage points less for each earlier year, reaching zero after ten years. Credit shelters only LVT above the gross council-tax bill, never the council-tax-equivalent amount. The calculation is aggregated. For each authority × band × purchase-year cell, the model stores the buyer count and total notional SDLT, computes the average credit and compares it with the cell’s average excess LVT.
Historical SDLT is approximated by applying the standard rates in force from April 2025 to the modelled latest nominal purchase price. The model does not reconstruct the rates and thresholds on the purchase date, first-time buyer relief, the higher rates for additional dwellings or non-residents, linked transactions, lease rent, reliefs or refunds (that was somewhat lazy – or, to be more generous, we were trying to avoid spiralling complexity – but differences over this period are small, particularly in the high value properties where the effects are largest). Only first-year cash cost is modelled; later use and expiry of the credit pot are not. Accordingly, the 1.41% “neutral” rate is the rate that funds this modelled first-year relief while raising the baseline in that year. It isn’t the permanent rate a real multi-year transition would require.
The deferral option
The optional deferral rule assumes 10% of the positive excess of LVT over gross council tax is not paid in year one (after transitional credit, if selected). It is a national cash-flow assumption, not a microsimulation: there is no eligibility test, income or age data, household choice, duration, death/sale profile, interest accrual, default or administrative cost. The interface describes recovery with interest at base rate, but the model does not project that recovery; it simply subtracts first-year deferred cash. Low take-up in overseas schemes makes 10% reasonable, but the figure is an assumption and not verified in any sense.
Impact by region
The regional table compares net modelled LVT with the nine regions’ net council tax plus an allocated share of the £11.5bn SDLT constant. The allocation is proportional to notional SDLT calculated on the most recent purchase records in the model’s transition cohorts. It assigns about 39% to London and 23% to the South East. The result is a useful approximation, but regional differences partly reflect this allocation rule.
Varying the rate by region
A uniform land value tax shifts a great deal of money out of London and the South East, whose land is worth far more, and towards the North. The “regional rates” control lets you soften that geographic transfer. It is a single slider, running from one national rate at one end to each region raising exactly its own current bill at the other, with a straight blend in between: at the halfway point every region’s total moves halfway from its uniform-rate figure towards what it pays in council tax and stamp duty today.
Sensitivity analysis
The model rests on a large number of unverified assumptions – the national land share, rebuild costs, floor areas, how old sale prices are uprated, whether unsold homes are worth the same as sold ones, and what happens to social housing. Given they are unverified, the question is: how much does the answer depend upon these assumptions?
So we re-ran the whole model dozens of times, varying each assumption across a plausible range, one at a time and in combination, and measured what happened to three things: the revenue-neutral rate, the share of homes that pay less than their council tax, and the largest local-authority shifts.62
The outcome reinforces what we say at the top: that the model should be reliable when it comes to geographical distribution but unreliable in pricing detail. The geography of winners and losers is robust: across every variation I tried, between roughly 67% and 70% of homes pay less, and it is always the same places that win and lose. But the rate needed to achieve this is highly uncertain – it swings from about 1.1% to 1.7% depending mostly on one assumption (the national land share), with the unsold-stock and social-housing treatments adding to that. And one assumption that is almost irrelevant nationally – how old sale prices are uprated – turns out to be decisive for particular places.
One assumption at a time
| Assumption | Variation tested | Revenue-neutral rate | Homes paying less |
|---|---|---|---|
| Central case | – | 1.28% | 68.4% |
| National land share | 45% (from 55%) | 1.56% | 69.7% |
| 50% | 1.41% | 68.9% | |
| 60% | 1.18% | 68.1% | |
| 65% | 1.09% | 67.9% | |
| Rebuild cost (uniform) | −20% | 1.28% | 68.4% |
| +20% | 1.28% | 68.4% | |
| Rebuild cost by property type | spread halved | 1.28% | 68.4% |
| spread widened ×1.5 | 1.28% | 68.4% | |
| Floor areas by property type | spread halved | 1.28% | 68.4% |
| spread widened ×1.5 | 1.28% | 67.5% | |
| Regional cost factors | flat (all regions 1.0) | 1.28% | 68.1% |
| spread widened ×1.5 | 1.28% | 68.6% | |
| Unsold homes worth less | 10% less than sold | 1.34% | 68.4% |
| 20% less than sold | 1.40% | 68.3% | |
| Social housing excluded | flat 16% of all bands | 1.33% | 66.8% |
| weighted to low bands | 1.21% | 66.7% | |
| HPI geography for uprating | region instead of local authority | 1.28% | 69.8% |
| England instead of local authority | 1.28% | 70.1% |
The table makes pretty clear that there is a strict order of importance of the assumptions:
The national land share drives everything. It is also the least verifiable of all our unverified assumptions – there is no official data on the value of residential land alone. It moves the rate more than anything else. Halve the model’s assumed land content to 45% and the revenue-neutral rate climbs to 1.56%; push it to 65% and the rate falls to 1.09%. But this doesn’t change who pays: the winner share stays within a point of 69% throughout (and the winners are basically unchanged).
The rebuild-cost and floor-area assumptions mostly don’t matter. This is a somewhat counter-intuitive result. Because the model calibrates its cost level to hit the target land share, a uniform 20% change in rebuild costs (or floor areas) is simply absorbed by that calibration and changes nothing. Even changing the shape of the cost assumptions – widening or compressing the gap between a flat and a detached house, or between London and the North – barely moves the needle (the rate holds at 1.28% and the winner share moves by well under a point).
The unsold-stock and social-housing assumptions move the rate, upward. The model reweights ~15m sold homes up to ~26m dwellings, assuming the unsold ones look like the sold ones. If unsold homes are in fact worth 10-20% less (older, in poorer condition, less often improved), there is less land to tax and the rate rises to 1.34-1.40%. Excluding social housing from the tax base – which is almost certainly what would happen, since it would otherwise be government taxing government – pushes the rate to 1.21-1.33% depending on how concentrated in low bands you assume social housing is, and shaves a point or two off the winner share (because a chunk of the natural “winners” are removed from the count).
HPI geography is nationally trivial but locally highly relevant – which is why it gets its own table below.
Two assumptions at once
If we vary the two most significant assumptions together, we can see that they compound. The land share sets the overall level, and the unsold-stock discount lifts it further:
| Land share ↓ / Unsold discount → | 0% (central) | 10% less | 20% less |
|---|---|---|---|
| 45% | 1.56% · 69.7% | 1.63% · 69.6% | 1.70% · 69.6% |
| 55% (central) | 1.28% · 68.4% | 1.34% · 68.4% | 1.40% · 68.3% |
| 65% | 1.09% · 67.9% | 1.13% · 67.8% | 1.19% · 67.7% |
Bundled scenarios
Finally, let’s push several assumptions together in the same direction – a “more land, softer” scenario, a deliberately pessimistic “less land, harder” scenario, and a cautious scenario that discounts unsold stock and strips also out social housing.
Across the full plausible range, the revenue-neutral rate sits between roughly 1.1% and 1.7%; the winner share never leaves the high-60s:
| Scenario | Assumptions | Rate | Winners |
|---|---|---|---|
| Central | as published | 1.28% | 68.4% |
| More land, softer | 65% land share | 1.09% | 67.9% |
| Less land, harder | 45% land share, unsold −20% | 1.70% | 69.6% |
| Cautious (unsold + social) | unsold −15%, social housing stripped from low bands | 1.30% | 66.5% |
The places where assumptions matter
Some of the changes that are invisible in the national numbers can still be highly visible in individual locations.
The land share reshapes the top end. Because prime London sits on the most land, it is most exposed when the rate moves. Dropping the land share to 45% (and so lifting the rate to 1.56%) raises the average bill most, in cash and proportion, exactly where the tax is already weightiest:
| Authority | Average LVT/home – central (55%) | – 45% land share | Change |
|---|---|---|---|
| Kensington & Chelsea | £17,670 | £21,040 | +19% |
| Westminster | £10,430 | £12,240 | +17% |
| Camden | £9,400 | £10,970 | +17% |
| Richmond upon Thames | £8,230 | £9,460 | +15% |
| Elmbridge | £8,230 | £9,370 | +14% |
How we uprate old sale prices matters – but only for prime central London. Uprating each home from its last sale using local-authority house-price growth, versus a single regional or England-wide index, changes the national rate by essentially nothing (all three land within 0.001 of 1.28%). But prime central London’s prices diverged sharply from the national trend over the last decade, so the valuation of its most expensive homes is very sensitive to which index is used: switch from local to England-wide uprating and the average bill in Westminster rises by a third.63
| Authority | Local-authority HPI | Region HPI | England HPI |
|---|---|---|---|
| Westminster | £10,980 | £14,160 (+29%) | £14,600 (+33%) |
| City of London | £7,030 | £8,830 (+26%) | £9,220 (+31%) |
| Hammersmith & Fulham | £7,470 | £8,840 (+18%) | £9,160 (+23%) |
| Kensington & Chelsea | £17,790 | £20,810 (+17%) | £21,350 (+20%) |
| Camden | £9,370 | £10,330 (+10%) | £10,630 (+13%) |
What to take from this
Three conclusions:
- The direction is robust: whatever plausible assumptions you feed in, a broad-based residential land value tax takes money out of London and the South East and moves it north, with a little over two-thirds of homes paying less. That result does not depend on the fine print.
- The exact rate does not survive contact with the assumptions: “1.28%” is a central estimate in a range that runs from roughly 1.1% to 1.7%, and the single biggest source of that uncertainty – the national land share – is also the hardest thing to pin down.
- The method of uprating old sale prices has a huge effect at the top extreme, in prime central London.
So we finish mostly where we started. We can’t use a model like this to make a reliable specific claim about the LVT liability for a specific household. The direction of travel is reliable; the decimal points are not. For most of the key design and policy decisions, that’s fine – they’re driven by the direction and the distribution, not the detail. The one point where precise numbers become highly relevant to implementation is capitalisation. Our model can tell you how much someone’s annual bill changes, but not how much of that turns into a fall in the price of their home – and that second step is significantly unknown. Part of the answer is more research. But it’s plausible that no matter how much research is done, the unknown will remain unknown, and the prudent policy response is a slow phasing.
Many thanks to A for the original idea, B and K for help with the modelling and coding, L and P for additional research and A and K (again) for review. Thanks to Matthew Ayre for spotting a valuation anomaly shortly after publication.
The code is available on our GitHub.
Contains HM Land Registry data, and ONS, VOA and MHCLG data, © Crown copyright and database right 2026, licensed under the Open Government Licence v3.0. The interactive map is built with Leaflet; basemap tiles © OpenStreetMap contributors, coastlines from Natural Earth (public domain).
Image of the UK from space, ESA – European Space Agency, CC BY-SA 3.0 IGO or ESA Standard Licence.
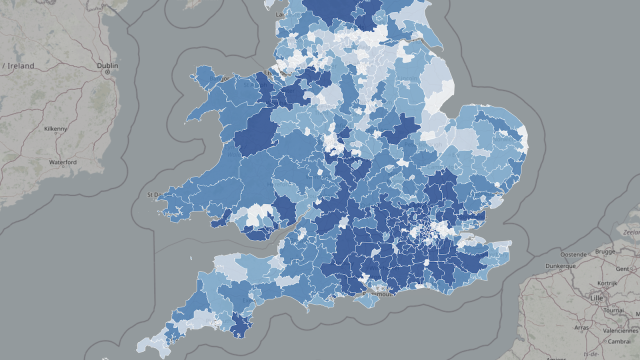
The mansion tax map: where the money comes from
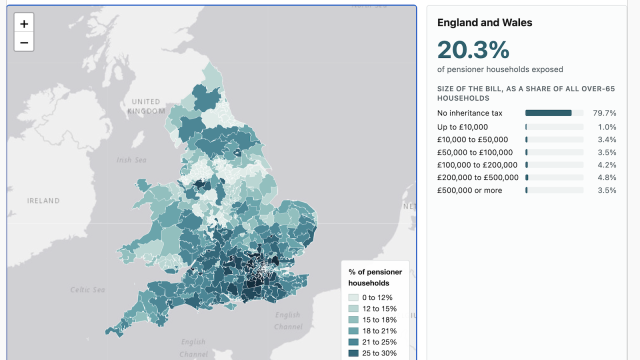
The hidden reach of inheritance tax: one in five pensioner households
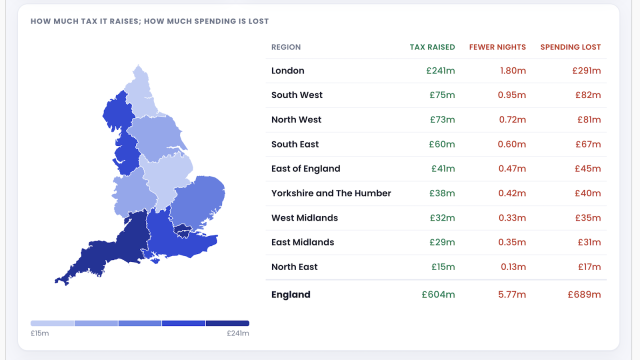
England’s new tourist tax: what it raises, who pays, and what it costs
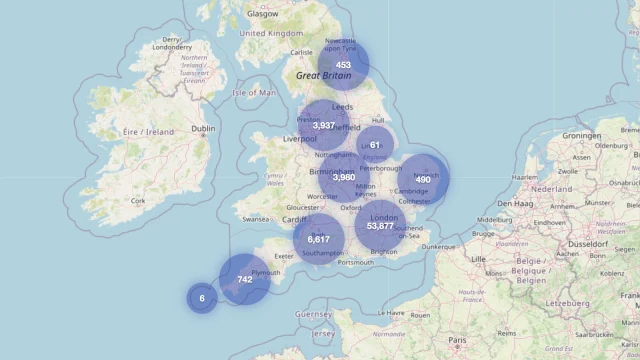
What if Andy Burnham lowered the mansion tax threshold to £1.5m?

Has Britain run out of “other people” to tax?
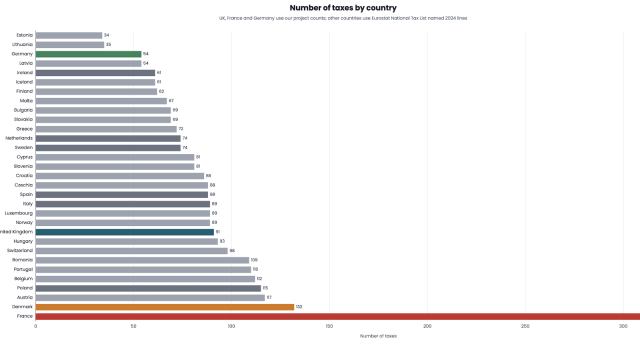
The UK has 90 different taxes. France has 348. Germany has 60. Why?
Footnotes
In his own 2010 Guardian article he proposed an annual tax on the market rental value of land that would permit abolition of stamp duty1The tax in question is stamp duty land tax, the modern tax on land in England. “Stamp duty” is a separate, much older, tax on documents. However we will, in the interests of clarity, refer to the tax as “stamp duty” in this article – our usual apologies to tax advisers. ↩︎
That’s the figure if we build in transitional rules and a deferral. If we don’t, then more people benefit in cash terms, but the losers suffer more deeply. Note that all these figures are probably under-estimates, because they are counting “people liable” and if, as I expect, incidence is on landlords, then “people benefiting” will be considerably more than “people liable benefiting”. ↩︎
Although it is only an introduction; the only implementation issue we talk about in any depth at all is valuation. There are plenty of other challenges, not least the interaction with planning, and the volatility of LVT revenues when prices move (something that doesn’t affect council tax at all). ↩︎
Council tax still uses 1991 values, its top band is fixed at three times the bottom band, and its effective rate falls sharply as value rises; a very high-value Westminster home can therefore pay roughly the same cash bill as an ordinary flat and less than a modest home in a high-tax northern authority. Business rates tax occupiers partly on buildings and improvements: investment can raise rateable value, revaluations lag, relief thresholds produce cliffs, and empty-property relief has generated avoidance. HM Treasury’s 2021 review describes the investment and administrative problems. However, the model on this page ignores commercial stamp duty and business rates and focuses on residential property. ↩︎
The best causal estimates are Best & Kleven’s study of the UK market, which finds that a one percentage-point change in the effective stamp-duty rate changes the number of transactions by 5-20%, and Hilber & Lyytikäinen, who find that a two-point rise in stamp duty reduces household mobility (short-distance owner-occupier moves) by around a third. The Mirrlees Review concluded that transaction taxes are “highly inefficient” and that stamp duty should be abolished. ↩︎
More formally, because land is in fixed supply, a tax on its value in principle creates no “deadweight loss”: it does not discourage anyone from building, improving or using land. This is close to unanimous across the mainstream. The IMF: “Land value taxation is efficient since it does not distort the supply of the tax base… land value should thus be fully taxed”. The Chicago Fed: a pure LVT “is considered neutral; it does not create a deadweight loss” (Chicago Fed Letter No. 489, 2023). The idea is old – Ricardo, then Henry George’s Progress and Poverty (1879). But always a catch: the more you depart from a pure land value tax, the more a deadweight loss may arise, and – as you’ll see later – we end up departing significantly from a pure design. ↩︎
See the OECD’s landmark study (later published in peer-reviewed form), which ranks recurrent taxes on immovable property as the least distortive of the major taxes, ahead of consumption taxes, then personal income, then corporate income. The IFS’s Stuart Adam, writing up the Mirrlees Review, puts the LVT case flatly: “Taxing land value does not discourage any desirable activity… Windfall loss to land-owner on day tax is announced – but no disincentive to buy, develop or use land” (Mirrlees Review: Land and property taxation). ↩︎
There is a huge amount of literature on Land Value Tax, some of which is cited in this report. A note of caution: a significant proportion of the literature is written by people with a deep political commitment to land value taxation. See e.g. Connellan and Lichfield Land Value Taxation in Britain for the Benefit of the Community (1997), Proposals for Legislation and Practice (2000), and Land Value Taxation in Britain: Experience and Opportunities (2004). ↩︎
The model aggregates to local-authority-by-band cells and cannot value an individual trophy home, but the arithmetic couldn’t be simpler. At the revenue-neutral 1.28%, a £100m house whose land is worth (say) £80m would pay a little over £1m a year. One of the very grandest London houses – Witanhurst in Highgate, reportedly worth around £300m, would therefore face several million pounds a year. This is a feature not a bug, and if you don’t like this result, then you won’t like land value tax. ↩︎
That is not so true at the high end, where it remains common to buy property that is “enveloped” in a company. An annual tax is supposed to put people off doing this, but at the high end, the economics still create a big advantage for enveloping. This means that, for most of The Bishops Avenue, I suspect that the land value tax is pure downside. ↩︎
Lifting the rate from 1.28% to 2% on the slice of land value above £2m adds under £0.9bn, because only about 80,000 English homes sit on land worth more than £2m. Even a standalone 2% levied on land above £2m (and nothing below) would raise only about £2.4bn – a rounding error against the roughly £57bn the broad-based tax raises. The revenue case for a land value tax rests on a broad base, not a soak-the-rich design. The OBR made the same point when it costed the 2025 “mansion tax” (a council-tax surcharge on homes over £2m), which raises only about £400m a year from around 165,000 properties. ↩︎
I’m going to use Islington partly because it’s a cliché, and I can’t resist a cliché, and partly because it’s neither prime London nor at the lower-end of London property prices. ↩︎
And that’s on top of the fact that their property could suffer a drop in value (see Capitalisation, below). ↩︎
There is a respectable argument that this is overgenerous because SDLT was partly capitalised into the price the purchaser paid. Nevertheless, politically and intuitively, the double-charge problem is real. ↩︎
You could credit all historic stamp duty/SDLT. But, if you go back in time forever, then that becomes both expensive and administratively tricky. If you have a hard stop, then it’s distortive. A taper of some kind is, I think, fairer. But, as I said, there are many ways this could be done. ↩︎
Many serious property-tax reform proposals use the same small toolkit – phase in, cap, defer and accept some losers – because there is no escaping a trade-off triangle: full revenue now, no cliff-edge for the losers, and full savings now for the winners – pick two. The Mirrlees Review recommends replacing stamp duty and reforming council tax “initially on a revenue-neutral basis” and “gradually, with transitional arrangements” modelled on business-rates revaluation relief (though, notably, Mirrlees would tax the combined value of a home – land and building, as housing consumption – not land alone). The closest live UK proposal, Fairer Share’s Proportional Property Tax, pairs its flat 0.48% rate with a £1,200-a-year cap on how fast an existing owner’s bill can rise, a three-year phase-in and deferral until sale – but the cap dies when the home is sold, so it’s a temporary revenue sacrifice recovered slowly as homes turn over. Even at 0.48% it would add on the order of £2.5bn to London bills, with hundreds of thousands of London and South-East households facing rises of £1,000+ a year (IPPR). ↩︎
A corollary of this is that, in future years, governments could maintain neutrality by reducing the rate of land value tax or collect revenue by keeping the rate static. My preference would be to reduce the rate because the political sell, already challenging to put it mildly, is much more difficult if this is seen as a tax grab. ↩︎
This is not a fanciful example. £52,300 is a plausible salary for a teacher with about ten years’ experience in London, so two such teachers would have a combined gross income of about £105,000. A £445,000 mortgage on a £520,000 flat is about 4.2 times that income. On top of the £75,000 deposit they would need roughly £16,000 of stamp duty and perhaps another £5,000 for legal, mortgage and moving costs – about £96,000 of cash in all. Accumulating that over ten years would be impressive, but not impossible (and, if we are committed to the cliché, with some help from the parents). ↩︎
That’s higher than in our original example because – having seen that example – we’re now applying a transitional rule which increases the rate. ↩︎
Although this tends to come more from popular treatments of the LVT rather than from theorists who do not generally support a fundamentalist version of LVT. In its typical deathless prose, an IMF study finds it “may be optimal not to tax land value fully for distributional reasons, with the decisive variable being the covariance of land value held by households and their social welfare weight”. A flat land tax can be outright regressive in poorer economies, where nearly all poor households own some subsistence land (Kalkuhl and colleagues). In other words, if a lot of land value sits with people you would rather not clobber – asset-rich, cash-poor pensioners – full land value tax may not be optimal even on pure welfare grounds. ↩︎
Loutzenhiser and Mann carefully examine Wealth and Assets Survey data in the context of a proposed UK wealth tax. It finds that prevalence of liquidity problems is highly design-dependent, that farmers and business owners are commonly over-represented in the low-liquidity group, and that there is little evidence for the archetypal single-pensioner narrative. Its policy menu includes payment from income or asset sale, financing, withholding, deferral and, in limited cases, payment in specie. ↩︎
British Columbia’s long-running property-tax deferment programme has on the order of 80,000 users – a low single-digit percentage of eligible seniors; Oregon’s fell from about 12,000 users in the 1980s to around 3,500; and when Colorado widened eligibility in 2021 expecting 35,000+ households, fewer than 2,000 applied. Boston College’s Alicia Munnell attributes the low take-up to unawareness, stigma, and reluctance to place a lien on the home or leave debt to heirs. ↩︎
The empirical literature finds the migration response of the rich to taxation is real but modest, and concentrated in a few footloose groups – star scientists, inventors and footballers – rather than the wealthy in general (Kleven and colleagues). Millionaires in particular turn out to be far less mobile than assumed, being tied down by business, family and social connections (Young and colleagues). I get a little frustrated when this research is cited as evidence that the ultra wealthy do not migrate jurisdictions – because the research relates to “normal wealthy” people and not ultra-high net worths. The existence of tax exiles – and indeed the continued existence of Monaco – is testimony to the reality of super-rich migration, and anyone denying that is, in my view, denying reality. What a land value tax absolutely can reduce is the price of land, through capitalisation (see below) – but that is a one-off hit to today’s owners, not a flight of the tax base. ↩︎
Defra’s Farm Business Income and Total Income From Farming series document volatile and often low agricultural income, while farmland market reports show capital values that cannot be explained by agricultural rent alone. ↩︎
There are inevitably adverse consequences of such an approach. See Anderson and colleagues, which documents the spread of this kind of compromise; it preserves farms but narrows the base and weakens the pure LVT incentive (it has to, because we are trying to avoid the incentive). ↩︎
There would, however, be an incentive to reclassify non-agricultural land as agricultural land. This would probably become a heavily litigated point – one can imagine developers arranging for their land banks to be farmed and then arguing that their land banks are agricultural land. ↩︎
Another advantage, though less significant, is that the price of land can be volatile. It can experience booms and shocks. So LVT revenue will also be volatile. If LVT is replacing stamp duty, then that is merely substituting one volatile tax for another. But council tax is entirely unaffected by changes in property prices, so replacing council tax with LVT is substituting a stable tax base with a volatile tax base. ↩︎
That is a slight overstatement because the pressure on valuation is much greater if it is collecting five times as much revenue; the basic valuation work may be the same, but the compliance and dispute cost would surely be much larger for the full LVT. ↩︎
their property value benefits from the abolition of stamp duty, but that will be undone, and probably a bit more than undone, by the creation of land value tax. See the capitalisation section below. ↩︎
It would also not raise nothing. Some people would be unaware of the tax and get caught. Others would forget to shave. Some people would keep their beard or even grow a beard to demonstrate how wealthy they are. The Liberal Democrats’ proposed share buyback tax could conceivably raise less than my £10,000 beard tax. ↩︎
The calculation is simply £128,000 / 3%. For a fantastic discussion of the “time value of money”, and this kind of calculation, see this paper from Aswath Damodaran of NYU Stern. ↩︎
i.e. the fall in value is 1.28% / 3%. ↩︎
I am using 1.28%, our estimated rate without deferral or transition. Deferral (mostly) and transition (entirely) are short-term timing effects, so provided the initially-higher rate is cut once those costs fall away, the expected long-run rate is close to 1.28% – and it is the average expected long-run rate that matters for capitalisation. ↩︎
i.e. 55% × 42.7% = 23.5%. ↩︎
The evidence suggests most or even all of the economic cost of stamp duty falls on sellers, in the form of reduced prices, so stamp duty is likely to be already capitalised. ↩︎
It might be thought that total fall = total rise, but life is unlikely to work that way. Stamp Duty is an occasional one-off charge, and Land Value Tax is a certain ongoing charge, economically and psychologically. The two are not the same. ↩︎
The size of this offset depends on how far the literature is right that stamp duty is capitalised into lower prices. If it is fully capitalised, abolition is a meaningful support to high-end values; if not, less so. ↩︎
The classic starting point is Oates (1969). For a recent review and quasi-experimental estimate, see Lyu. Lyu finds a 0.2-point higher marginal rate reduced relative prices by about 2.73%, implying at least 71% capitalisation, while emphasising that published estimates span zero to over-capitalisation. That literature concerns property taxes, often bundled with local public services; it is informative but not a direct estimate for a national English LVT. A published 2018 study of a 2007 municipal reform in Denmark found full capitalisation of permanent land-tax changes. A newer working paper, using persistent cross-municipality variation and additional outcomes, instead estimates a precise zero effect on residential prices, no general effects on development, mobility or ownership, but some sorting of older owners away from higher-tax areas (and some burden falling on tenants rather than landlords). ↩︎
ACT transition: University of Canberra evaluation; ACT “Second Interval” evaluation (APO); Prosper Australia. Other jurisdictions soften capitalisation with different approaches: Estonia caps annual land-tax rises at 10%, Denmark taxes land at a value 20% below assessment as a “prudence” discount, and New South Wales values land on a three-year average to smooth swings. ↩︎
“Hedonic regression” is a valuation method that breaks down a complex thing (like a house or car) into its constituent parts (e.g. square footage, number of bedrooms, fuel efficiency). It then uses a standard regression analysis to isolate and assign contributory prices to each part. It’s a technique that is widely used by commercial valuers and analysts, as well as by the ONS. It can even be used to look at the impact of, e.g., crime on house prices. ↩︎
This comes from the Lincoln Institute’s Traditional Methods and New Approaches to Land Valuation and Bell and Bowman (2006). Gloudemans finds that CAMA models can produce reasonable empty land estimates where some neighbourhoods lack vacant sales, but says reliable decomposition needs both vacant and improved sales as anchors. See also Bourassa and Hoesli, which found the best approach was matching a vacant sale with the later improved sale of the same land – but, as mentioned above, that is the approach that is going to be least useful in e.g. Central London. ↩︎
Modern technical studies include those by Kolbe and colleagues (2019), Ma and colleagues (2020), Zhang and colleagues (2021) and Jafary and colleagues (2024), plus a systematic review by Zhou and colleagues (2025). ↩︎
It is sometimes suggested that these difficulties can be overcome by requiring everybody to self-assess the value of their land, and then the government can acquire the land for your stated price if they think you undervalued it. This seems problematic for several reasons. First, most people do not want to suddenly sell their property, even for market value – it would be somewhere between inconvenient and highly unjust. Second, people make mistakes all the time, and punishing those mistakes with asset confiscation would be oppressive. Third, the consequence is that a rational person would overvalue their land to prevent the government from acquiring it – that is not a fair outcome. ↩︎
The March 2026 programme commissioned multiple independent teams. B. Goodwin-Hawkins, A Land Value Tax for Wales? Valuation methodologies, concludes that there is no single optimal method: feasibility depends on purpose, data, capacity, transparency and fitness for use. The Bangor University final report implemented hedonic, machine-learning and formula-based models (and includes the interesting observation that participants preferred understandable hedonic models, even though machine learning was statistically the best performer). Alma Economics rated its whole-residential-property valuations high-confidence but its residential and non-residential land valuations low-confidence. A final point: none of the Welsh methods can be verified against an actual “source of truth”, because there was no market in urban vacant land to validate against. Alma found only 141 Welsh land-only transactions over five years; even after adding 15 years and comparable English regions there were about 1,500, with volatility and representativeness problems. Land valuation is easier in England in some senses (there are more transactions) but more difficult in others (it’s much more heterogeneous). ↩︎
“Coefficients of dispersion” ↩︎
The history of Lloyd George’s attempt is fascinating, and it’s odd that a subject can dominate politics for so many years but become almost entirely forgotten except amongst specialists. The National Archives guide to the 1910-15 Valuation Office Survey explains the legislation and has some primary records. An early contemporary assessment is “British Taxes on Land Values in Practice” (1915). McLean and Nou analyse the 1909-14 failure using veto player theory. ↩︎
See Oates and Schwab on the Pittsburgh experience; Plassmann and Tideman (15 adopting municipalities compared with 204 one-rate municipalities); and Banzhaf and Lavery (more housing units and denser development). Yang reports about a 21.5% rise in total real-property values and a small negative land-value effect. But selection remains a serious problem: Kwak explains why non-random adoption can bias estimates. Estonia also supplies mixed evidence: Wenner’s Tallinn-Riga comparison found a somewhat higher capital-to-land ratio and density in Tallinn but substantial suburbanisation in both cities, making attribution difficult. Finally, Altoona reversed its land-only tax in 2016 and Pittsburgh abandoned split rating after its 2001 reassessment sharply increased assessed land values; see the Chicago Fed’s balanced review. M. Hughes, “Why So Little Georgism in America?” blames the very limited uptake of LVT in the United States on (crudely speaking) dislike of its consequences. ↩︎
The fullest treatment of LVT implementation is probably a 2020 paper by Hughes, Sayce, Shepherd and Wyatt. It identifies an up-to-date land register, plot-level land-use planning, professional capacity, robust separation of land and improvements, highest-and-best-use rules and political support as preconditions. Its six-country review is important contrary evidence: standalone LVT is rare, often raises little, and has been reduced or abolished in some places because implementation creates uncertainty that existing property taxes do not. The paper grew from the Scottish Land Commission’s 2018 feasibility study. See also R. Almy, Effective and Sustainable Systems for Valuing Property for Taxation: A Comparison (World Bank Conference on Land and Poverty, 2016), and the International Association of Assessing Officers’ mass-appraisal standards. ↩︎
On the other hand, the many consultants that offer to correct this by separating out fittings and claiming a refund will, in our experience, typically result in a dramatic underpayment. Any consultant who quotes this report to advertise their services is probably a crook. ↩︎
See Chapman, Johnston and Tyrrell on the implications of a land value tax with error in assessed values (2009) ↩︎
For example, suppose £10,000 of building work would otherwise add £10,000 to a home’s value. A 0.48% annual tax would add £48 a year to the tax bill. Using a 3% discount rate, and assuming the tax continues indefinitely, buyers would capitalise that future cost into the price they are willing to pay. The improvement would therefore add about £8,400 to the home’s value rather than £10,000 – an effective reduction of roughly 16%. Less if the LVT itself takes account of the falling value, as discussed further in the capitalisation section ↩︎
This is the conclusion of the Welsh Government’s Technical assessment of the potential for a local land value tax in Wales. It says that, because the supply of land is close to fixed, almost all the economic incidence falls on owners, and recommends placing legal liability on the landowner rather than the occupier. See also the discussion of incidence and capitalisation in the Mirrlees Review. ↩︎
The Government’s local government finance policy statement for 2026–27 to 2028–29 summarises the present approach. The underlying Fair Funding Review 2.0 uses a series of “relative needs formulae”, local cost adjustments and a “resources adjustment” based on the council tax that each authority is notionally able to raise. The detail is formidable. ↩︎
An annual land value tax on a let dwelling is deductible because it is a recurring, non-capital cost incurred wholly and exclusively for the property business. It would be entirely unprincipled to create some special rule excluding deductibility for LVT. ↩︎
The envelope looks like this. Three steps. First, how much LVT do landlords pay? There are 4.88m privately rented dwellings in England – 19% of the stock, but cheaper than average, with a mean value of £289,000 against £348,000 for all dwellings (MHCLG Market Value Survey 2024). Nobody publishes privately rented dwellings by council tax band: MHCLG holds a Valuation Office-matched band for every English Housing Survey dwelling but uses it only internally, and the Valuation Office’s own data can never supply it, because the valuation list records property, not tenure. So we took the Market Value Survey’s distribution of rented dwellings by value and mapped it onto our model by percentile. That gives the private rented sector roughly 15% of England’s residential land value – well below its 19% share of homes, because our land figure is value minus rebuild cost, so cheaper homes have proportionately less land in them and the cheapest have none at all. At the revenue-neutral rate that is about £8.4bn of LVT. Second, at what rate is it relieved? Weighting HMRC’s net property income by the tax bands of the landlords earning it gives about 31% for individuals; company landlords mostly pay the 19% small profits rate, and hold perhaps a fifth of the stock. Let’s put that in a blender and call it 30%. Third, net off what landlords already deduct. Landlords do pay council tax on a small slice of the rented stock – voids between tenancies, HMOs, some short lets – and they deduct it today, so abolishing council tax takes that deduction away again. Call it £150m. £8.4bn × 30%, less £0.15bn, is about £2.4bn. ↩︎
HMRC records £55.5bn of gross property income for individual landlords; company landlords file corporation tax and are missing from that figure, so we should gross up by the quarter or so of the sector owned by coporate landlords. Total rent is around £74bn. Capitalise that at a 5.8% gross yield and the rented stock is worth about £1.27tn – which is within a whisker of what our model independently says it is worth, and a little under the £1.41tn the Market Value Survey implies. Take the land out of that (about half), tax it at 1.28%, relieve it at 30%, and you are back to roughly £2.4bn. ↩︎
Plausibly it is more likely to be an over-estimate than an under-estimate; many landlords are loss-making (particularly these days); some incidence of council tax may fall on landlords (albeit we aren’t aware of reliable evidence on this) so that abolition of council tax increases rents and increases taxable profits; abolition of stamp duty will slightly increase capital gains receipts. ↩︎
Many thanks to Matthew Ayre for spotting this anomaly. ↩︎
The floor-area assumptions are based on English Housing Survey averages; see MHCLG, Floor space in English homes. The base costs and regional factors are broad BCIS/ABI-style assumptions rather than property observations. The final calibration factor makes them lower than literal new-build costs and functions as a crude national adjustment for depreciation and model fit; it is not a measured depreciation schedule. ↩︎
Savills’ February 2026 estimate is £9.18tn for UK housing. ONS publishes estimates of land underlying dwellings, but the geography, date and concepts do not map cleanly to this model, and ONS land estimates are themselves derived residually. ↩︎
Economically, occupied residential land doesn’t go below zero. A negative abstraction result just means the model’s assumed rebuild cost exceeds the sale price – which just means that the rebuild cost is overstated for cheap, small, old terraces, not that the plot is worth less than nothing. Property value can be negative – for example, if remediation is required or the land carries some other form of obligation – but land value should never be. ↩︎
The sensitivity script (on our GitHub as
4_sensitivity_analysis.py) reuses exactly the same cleaning, council-tax banding, £8tn value calibration and land-share (kappa) calibration as the production model; it only changes the assumption under test and rebuilds. The central case reproduces the published model to the digit (1.28% rate, 68.4% winners). ↩︎An oddity here which confused some of our team: the “local-authority HPI” column in this table will not exactly match the central figures quoted elsewhere in this article – that is intentional rather than an error. Everywhere else – including the land-share table just above – we use the production model’s valuations, in which each recorded sale is uprated to April 2026 using the monthly local-authority House Price Index. This table, by contrast, is built for a like-for-like comparison between three uprating geographies (local authority, region and England), so all three columns re-uprate each sale from its original price using annual-mean indices, targeted on the 2026 annual mean. That is the only way to isolate the effect of the geography of the index: if we mixed a monthly-uprated local column against annual-mean regional and England columns, the “+29%” and “+33%” would be contaminated by the change in method rather than showing the change in geography. The two methods agree almost perfectly across most of the country and at the national level (the revenue-neutral rate is 1.28% either way). They differ only where prices are genuinely volatile from month to month – which, in practice, means a handful of prime-central-London authorities. So the annual-mean rebuild puts the average Westminster bill at about £10,980, against roughly £10,430 on the production monthly basis, and Kensington & Chelsea at about £17,790 against £17,670. The comparison across the columns of this table – the whole point of it – is strictly like-for-like and is unaffected; only the absolute level of the “local-authority” column shifts slightly relative to the rest of the article. ↩︎


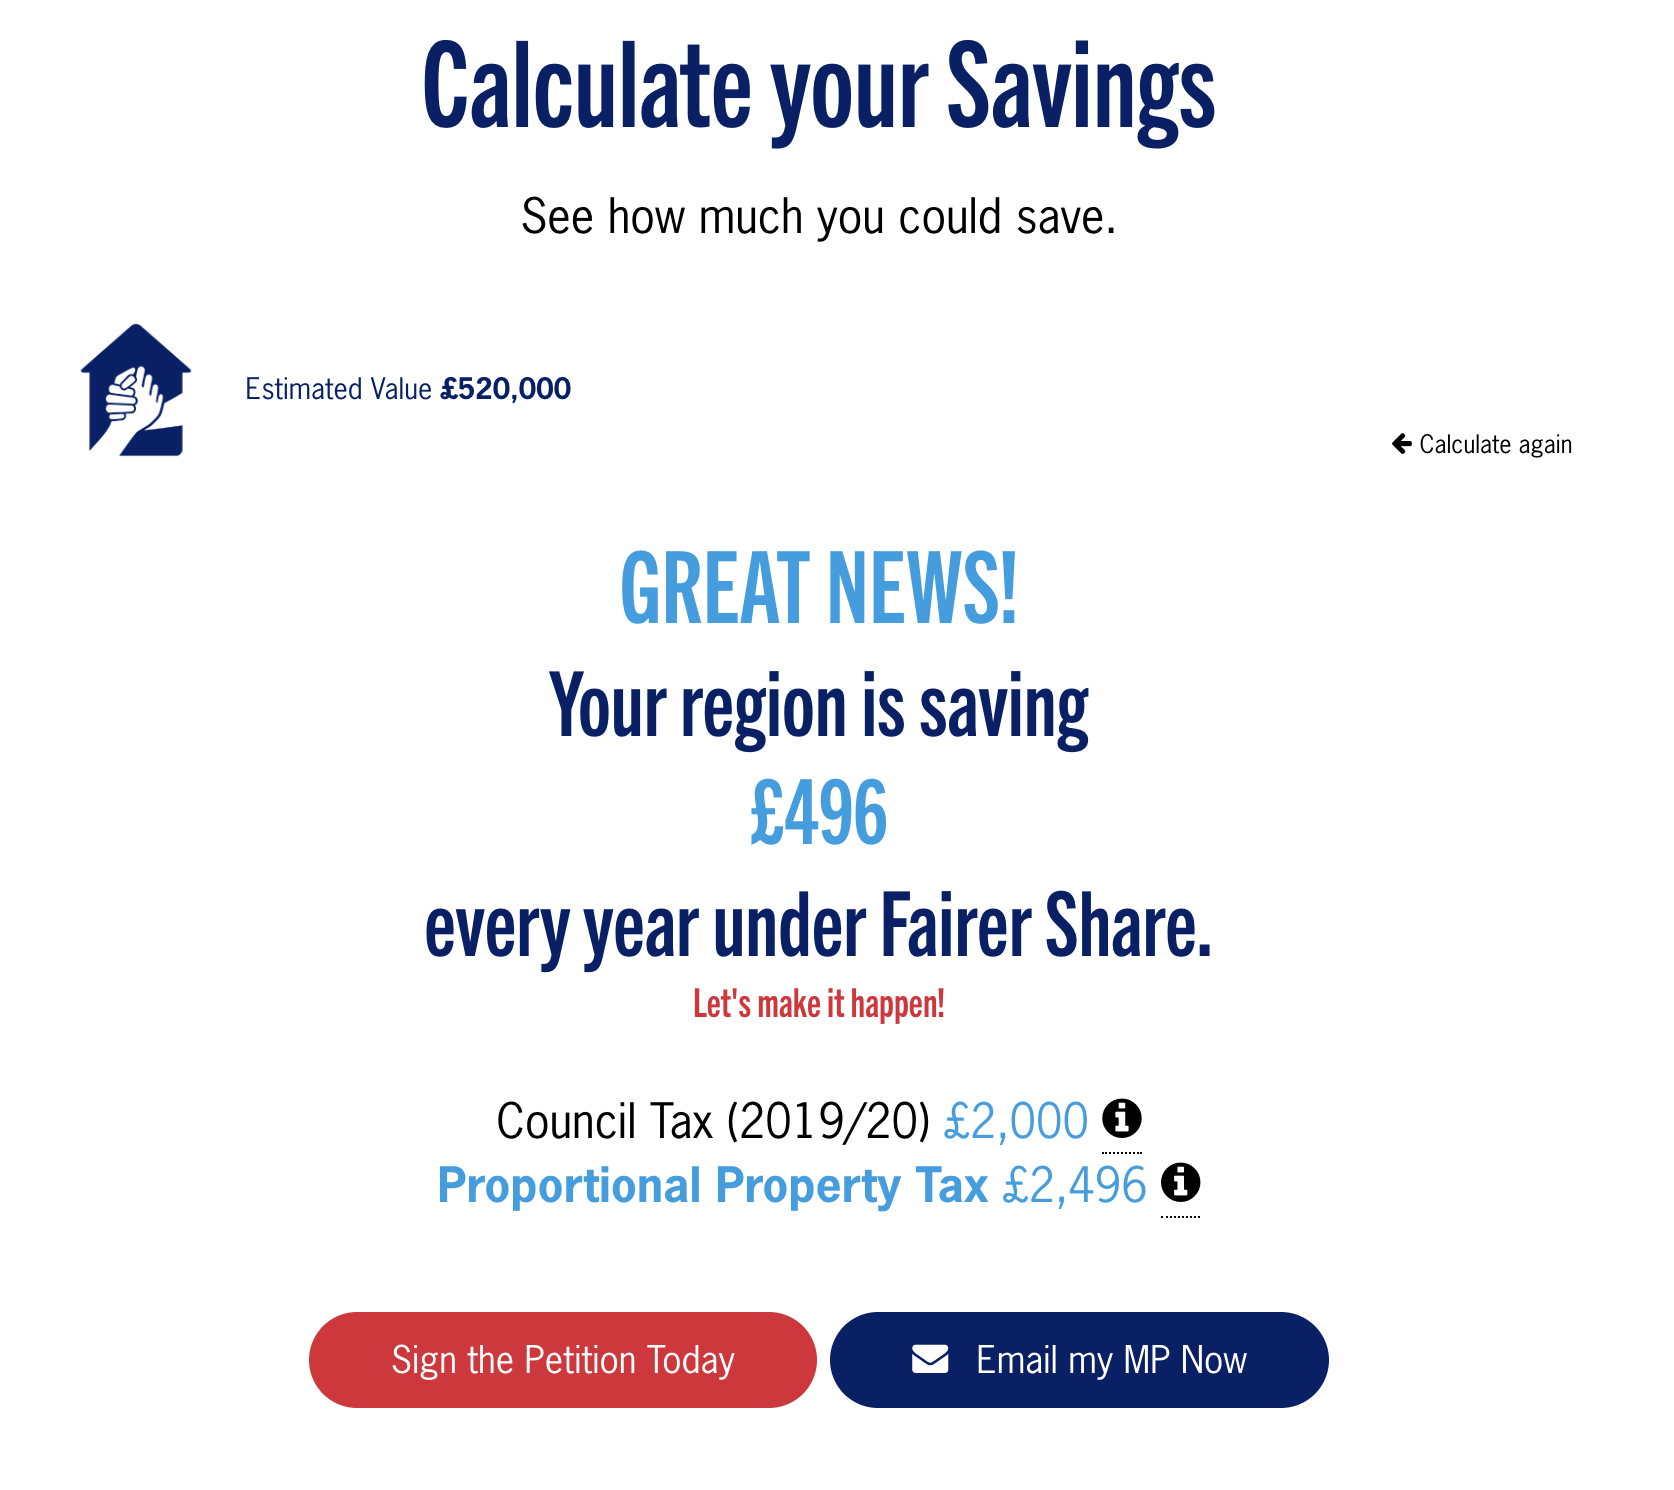
Leave a Reply