
British politics has spent a generation avoiding the same uncomfortable question: what if the government people want costs more than most voters are willing to pay?
The answer, from Labour and the Conservatives alike, has been to tax “other people”. Higher earners. Banks. People with capital gains, second homes, large pensions, non-dom status, inherited wealth or very large fortunes. Taxes have risen, but the average worker has been largely shielded.
This strategy has worked better than many people realise. The UK now raises a fairly typical amount of tax by international standards, but with an atypically low tax burden on ordinary wages. However we may have reached a limit. The pool of “other people” is shrinking, as higher-rate taxpayers are becoming normal voters. Wealth taxes and bank taxes raise limited sums. And the fiscal pressures facing the UK are getting larger, not smaller.
So the question is no longer whether the strategy of taxing “other people” is popular – it’s fairly obvious that it always will be. The question is whether the strategy has run out of road, and what happens next.
In this report:
The politics of taxing “other people”
Few will be surprised that there’s strong public support for increasing taxes that most people don’t pay:1
… and very little support for increasing the taxes that most people do pay:2
Perhaps more surprising is that even the rich believe that “other people” should be paying more tax.
The “Patriotic Millionaires” organisation recently reported, rather triumphantly, that millionaires were in favour of taxing millionaires. What they actually found3 is that the rich are not very different from you and me. People with £1m in assets were strongly in favour of a tax on people with £10m in assets, but took a markedly different view when presented with figures closer to their own wealth:
Voter hostility to paying more tax personally may be even greater than all these headline figures suggest. If you look at the small numbers willing to pay additional tax themselves and then ask them how much they’re actually willing to pay, you find the answer is… not much:4
So the political pattern is clear: voters are often willing to support higher taxes in the abstract, or higher taxes on someone else, but support falls sharply when the tax is broad-based, personal, or large enough to matter.
And the problem with this is that the taxes people want to raise would yield – at their highly optimistic best – around £40bn. The taxes people don’t want to raise currently yield £600bn.5
The UK’s success in taxing other people
The remarkable thing about the United Kingdom is that whilst the level of tax has risen markedly in the last twenty-five years, the tax paid by the average worker on their wages has gone down.
In 2015, the “tax wedge“6 (overall tax) on the average wage reached a historic low, and whilst the overall level of tax has been going up significantly, tax on the average wage has gone up only slightly:7
Often people will look at this and say that other taxes must have increased, but that’s not the case. There has been a real-terms increase in council tax in the last ten years, but the increase is small, and takes the tax back to where it was in the 2010s:8
VAT hasn’t increased since 2011; fuel duty has fallen in real terms. Stamp duty land tax saw significant increases in the 1990s, but changes since 2010 have had only a limited impact on the average person.9
So whilst people certainly seem to think they’re paying more tax than ever before, the evidence suggests that the average voter has not. At least not until very recently (more on that later).
So why the widespread belief that everyone is paying more tax? A plausible explanation is that what people are actually feeling is the lack of growth in real incomes and living standards, the increased price of housing and – for graduates – the impact of student loans (which behave much like a tax).10
The UK is an outlier
There are plenty of countries that have an overall higher level of tax than the UK:
However almost all these countries achieve that by taxing the average worker significantly more.
Tax on the average worker
This chart shows the total tax on average wages in each country (the “tax wedge”) plotted against the overall tax in each country as a percentage of GDP:1112
There is an obvious correlation13 between the amount of tax raised and the amount average workers pay, and very few countries materially depart from it. In 2025, only one country raised more in tax than the UK without charging the average worker more in tax, and that was Iceland, with a population about the same as Cardiff. By 2027, every country that raises more tax than the UK will tax its average worker significantly more heavily than the UK.
Many of these countries also have materially higher indirect tax than the UK:14
Tax on low-paid workers
The charts above focus on tax for the average worker, and so understate the uniqueness of the UK. If instead we look at taxes on a range of wages, the UK stands out – particularly for low-paid workers, whose tax in the UK is significantly lower than for any comparable country:1516
All of this suggests that the UK is already an outlier – and if we want to raise overall tax materially without raising tax on the average worker, our tax system will look very different from every other advanced economy.
Why don’t high-tax countries just tax business and the wealthy?
There is an obvious question at this point. If countries like France, Denmark and Belgium raise much more tax than the UK, why do they tax ordinary workers so much more? Why not simply put much higher taxes on companies, capital gains, banks and the very wealthy?
Part of the answer is that there are limits to how much revenue can be raised from small groups, however wealthy they may be (and I talk more about this below). But there is a second answer, which is more fundamental: taxes on business and mobile capital are not magic money machines. They can raise real money. They can be justified on fairness grounds, and they can be an important backstop to the personal tax system. But push them too far, and you start taxing investment17, wages and consumers, not just shareholders and billionaires.18 That is why the large Continental welfare states do not try to fund themselves by simply loading ever higher taxes onto business and capital. They tax those bases, but they also tax ordinary wages heavily. That’s not an oversight, or an ideological failing – it’s the arithmetic of a large state. The higher your overall level of tax, the more important it is to tax efficiently.
How has the UK done it ?
The short answer is: by taxing high earnings more heavily, mostly without headline income tax rate rises. And – whilst many countries have high levels of tax on high earners – the UK’s top rates now kick in at much lower levels than most other countries’.
Fiscal drag
Successive Governments have frozen the personal allowance and rate thresholds in cash terms, and let inflation and earnings growth do the rest:19
The proportion of full-time workers paying the higher rate has gone up three times since 1992; the proportion paying the additional rate has gone up almost five times since it was introduced in 2010:20
The overall impact
That’s the biggest part of the story, but it is far from the only way Britain has raised tax on people with above-average incomes and wealth. Over the last fifteen years, governments have repeatedly increased taxes on property wealth, with higher rates of stamp duty on expensive homes, second homes and additional properties. They have restricted pension tax relief⚠️ for high earners through measures including the tapered annual allowance, reduced the generosity of dividend taxation⚠️ by increasing rates and cutting allowances, and increased taxes on capital gains whilst sharply reducing the annual exempt amount. The government has also increased taxes on internationally mobile wealthy individuals through the abolition of the non-dom regime, imposed special taxes on banks, continued the long freeze in inheritance tax thresholds, and introduced a new tax on high value residential property. Scotland has seen even higher taxes. All whilst – most less visibly – the wheezes, tricks and loopholes used by the highly paid have been closed down, to a far more significant degree than in most other countries.21
All of this means that, if we look at the Conservative and Coalition governments overall, the highest earning decile paid more tax as a result of policy changes. All other deciles paid less (but the lowest-earning four deciles lose out due to benefit changes, particularly the two-child limit). Here’s the IFS figures:
All of this has made an already top-heavy tax even more dependent on higher earners. In 2024/25, the top 10% of income taxpayers paid around 59% of all income tax; the top 1% paid 27%.22
Can it continue?
The IMF is sceptical that the UK can increase tax further:
Beyond the planned tax ratio increase until 2030, staff analysis suggests that the long-term scope for further revenue increases is becoming limited unless more fundamental tax reforms are envisaged.
I don’t think that’s right. There are many countries with overall higher tax than the UK, and some of those are very economically successful. The question, however, is whether the UK can continue its recent strategy of raising money without raising tax on median workers.
I am sceptical.
Running out of road
The strategy is now simply insufficient to cover the fiscal pressures the UK faces as a result of demographic change and spending pressures (in defence and elsewhere). I expect that’s why the Government felt it had to increase employer national insurance in the October 2024 Budget. This was very much not a tax on “other people”. It raises significant sums but, in the long run, the economic incidence of employers’ national insurance falls on employees.2324
And continuing the present course inevitably means taxing the average person. Our data suggests that, in 2029, one in three full-time workers will start paying higher rate tax. Because earnings rise and fall over people’s careers — and because people move up and down the earnings distribution — around two-thirds of full-time workers will pay higher-rate tax at some point in their working lives.25
Doubling down
The Green Party suggests going further, not just bringing more people into the higher rate but increasing tax on higher-rate incomes by 6%:26
One obvious problem is that this results in some very high marginal rates. Another problem: this is exactly the policy Labour adopted in 1992⚠️ and was widely seen as a significant cause of their defeat. At the time, only 8% of full-time workers paid the higher rate – but others aspired to pay it. And the Green Party is more exposed than Labour was in 1992, when its core support was still the working class. The Green Party’s core support can expect to actually pay the higher rate🔒.
I rather expect that either the Greens will drop this policy, or it could start to cause them significant political difficulty as we approach an election.
A change in public attitudes?
There are signs of a change in public attitudes to tax. The percentage of people saying taxes should be reduced has always been small – 3% even at the height of Thatcherism in 1987. But in the last four years, it’s gone up sixfold to 19%. At the same time, the percentage of people saying taxes should be increased has fallen to 37% – the lowest since the height of the financial crisis.27
All this leaves politicians with a narrowing set of options: raise broad-based taxes and accept the political cost, cut spending, or keep searching for groups who can plausibly be presented as “other people”.28
Can we just tax the rich?
If people paying higher rate are no longer “other people”, then perhaps the answer is to aim higher, and introduce taxes specifically targeting the very wealthy.
That’s certainly the answer coming from the populist left. Let’s say we follow the recommendation in that TUC polling and introduce a wealth tax29, a tax on banks30, and we equalise capital gains tax with tax on wages.3132 Let’s charitably assume each raises the advertised amount. What do their proposals do to the shape of the tax system?
You can increase capital gains tax and bank taxes more or less immediately. That brings in £14 billion – essentially a rounding error when government spends well over £1.2 trillion every year:
We have estimated a wealth tax would take four years to raise any money,3334 after which the total impact of the TUC’s proposed taxes would look like this:
To put all these numbers in context:
- Defence spending: The planned increase in defence spending to 3.5% of GDP by 2035 is estimated by the IFS at £36bn a year in today’s terms.
- Housing benefit: DWP forecasts spending of £37.3bn in 2025/26.
- Triple lock: The cumulative effect of the triple lock costs about £12bn each year.
- Disability benefit: The Resolution Foundation says non-pensioner disability and incapacity benefit spending has risen by £24bn since 2019/20, and the DWP forecasts it will reach £77.1bn by 2025/26.
- NHS: in a recent spending review, the government had to allocate a £29 billion real-terms increase to the NHS’s annual day-to-day budget by 2028–29 simply to keep pace with demand and inflation.
- Debt interest alone is forecast by the OBR to cost £110bn in 2025/26.
So the £38bn figure is mostly illusory but, even if it were real, it’s insufficient to keep pace with current spending demands. Equally illusory are the demands that Amazon and other tech companies can fill the fiscal gap.35
The inconvenient truth is that, whilst the very wealthy are indeed very wealthy, there are not that many of them – so the amount of tax that you can raise is always going to be limited in fiscal terms. And it will never fund (say) German levels of public services.
Running out of road
Taxing the rich will always be politically popular, whether it’s justified as progressive redistribution or political expediency. There is a reason politicians keep promising that somebody else will pay.
The difficulty is that Britain has already spent a generation taxing somebody else, and by international standards we have been remarkably successful. The UK now raises a relatively large amount of tax while imposing a relatively low tax burden on ordinary wages. But this has run its course.
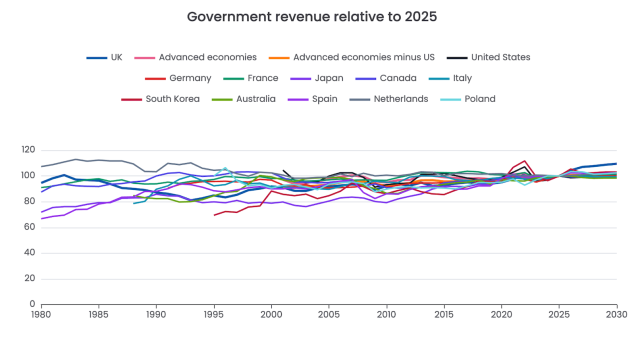
A generation of frozen thresholds means that they are no longer just a tax increase for “other people”; the average worker can expect to be directly affected. The popular new ways of taxing “other people” – targeting billionaires and banks – raise very limited sums in the context of UK public spending. And that ominous uptick at the end of the UK “tax wedge” chart matches the uptick at the end of the “British attitudes” chart.
All this is, in part, a failure of the modern Left. The traditional social-democratic argument was never that we can fund a decent society by finding a few unpopular groups and taxing them ever harder. It was that good public services require broad-based taxation, and that people should be willing to pay for the civilisation they want to live in. Most of the contemporary Left has abandoned that argument. It still wants a European-sized state, but sells it with the fantasy that someone else can pick up the bill.
This has been mirrored by a failure of the Right. It is still just as eloquent at denouncing the tax burden, but has become unwilling to identify spending cuts large enough to make a serious difference. It will argue for welfare cuts, but rarely identifies specific reforms that save more than a tiny fraction of overall spending. And it is generally unwilling to touch the biggest and most popular areas of spending: pensions, the NHS, social care and defence. So the Right ends up with its own version of the same evasion.
And so we end up with political failure. The Left says we can have European spending without European taxes because “the rich” will pay – and so, when it finds itself in power, presides over deteriorating public services. The Right says we can have lower taxes without confronting the spending programmes voters most want to protect – and so, when in power, has raised tax.
Britain may have a viable path in either direction: higher broad-based taxes to fund a larger state, or lower spending to sustain a lower-tax economy. I don’t know which would be more successful, but I know that we cannot have both.
Politicians can keep pretending there are pain-free answers: cutting “waste” on one side, taxing “other people” on the other. That may fool the voters and win elections, but sooner or later, we have to choose. Higher taxes that most people will pay? Or spending cuts that most people will feel?
The strategy of taxing “other people” has run out of road.
Thanks to K and F for help with the modelling.
“Crowd” by James Cridland, CC BY 2.0

What would a land value tax actually do?
What if Andy Burnham lowered the mansion tax threshold to £1.5m?
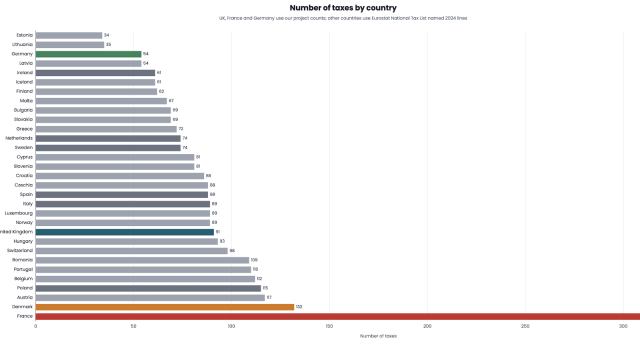
The UK has 90 different taxes. France has 348. Germany has 60. Why?
Why does Britain have more taxes than at any time since 1834?

90 UK taxes. On one chart.
Tax will go up but public services will get worse. This is why.
Footnotes
Source: TUC press release, 4 September 2025. The release says Hold Sway polled 5,024 British adults online from 15-19 August, with quotas and weights applied for gender, age, region, ethnicity, education level and past voting behaviour. The chart uses the support percentages reported in the release for five tax measures: equalising capital gains tax with wage tax, a bank/financial windfall tax, higher gambling taxes, a 2% wealth tax above £10m, and the package as a whole. Labels are shortened in the chart; the hover text uses the fuller question wording. ↩︎
Source: YouGov, “What tax reforms would Britons support?”. The chart uses the support and opposition figures reported by YouGov for increasing VAT, national insurance, the basic rate of income tax and the higher rate of income tax. In the chart, “National insurance” refers to the YouGov national-insurance option and “basic” and “higher” refer to the corresponding income-tax-rate options. ↩︎
Source: Survation survey for Patriotic Millionaires UK, fieldwork 6-14 May 2025. The published summary describes online interviews of UK millionaires with assets over £1m excluding their home, with 511 respondents. The first chart uses the published response split for support for a 2% wealth tax on assets over £10m (although the actual question was much longer than that and, to my mind, much less balanced). The second chart uses the published response shares to the question asking at what wealth level a person has “too much wealth” and it is reasonable to tax them more. See the linked source for full details. ↩︎
Source: Tax Policy Associates/WeThink polling originally published in “Public attitudes to paying more tax to fund the NHS”, 17 March 2024. The chart here uses the income-breakdown table for people who said they were willing to pay more tax, grouped by the additional annual amount they selected: £10, £100, or £500 or more. The original post notes that the answer options were coarse, particularly between £100 and £500, so the chart should be read as broad willingness bands rather than exact maximum amounts. ↩︎
I reach this figure by combining forecast receipts for VAT (£195.8bn) and National Insurance contributions (£206.6bn) in 2026/27 with an estimate of the income tax paid at the basic and higher rates. The OBR forecasts total income tax receipts of £262.8bn in 2026/27. HMRC’s latest analysis shows that around 75% of income tax liabilities arise from income taxed at the basic or higher rates, with the remainder coming from the additional rate, savings income, dividends and other components. Applying those proportions to the OBR forecast gives an estimated £197bn of basic-rate and higher-rate income tax, for a total of around £600bn. ↩︎
The linked article goes into detail as to what the tax wedge is, but two points to bear in mind are (1) the tax wedge looks at all taxes and wages, employer side and employee side because the evidence is that in the long run the cost of for example national insurance is borne by employees. This also lets us compare on a like for like basis between countries with a very large Social Security (like France) and countries with almost none (like Denmark), (2) The “average” wage is not a simple median but a composite, looking at a specific set of occupations and roles. ↩︎
From 2000 onwards this chart uses OECD Taxing Wages data for a single worker without children earning 100% of the average wage. Before 2000, it is a Tax Policy Associates reconstruction: we apply the actual income tax rates, personal allowances and NIC rules for each year to ONS average gross weekly earnings, calibrated to match the OECD’s own 2000 figure exactly. The green line is OBR National Accounts taxes as a percentage of GDP. Dotted lines from 2025 onwards are OBR forecasts (green line) and TPA projections (blue line), not outturns. The sharp dip to below 30% in 2024 is the effect of Jeremy Hunt’s NIC cuts: the employee NIC rate was cut from 12% to 10% in January 2024 and to 8% in April 2024. The equally sharp rebound to above 32% in 2025 reflects the October 2024 Budget changes to employer NIC that came into force in April 2025: the employer NIC rate rose from 13.8% to 15% and the threshold at which it becomes payable was cut from £9,100 to £5,000 a year. These employer NIC changes account for virtually all of the 2.4 percentage-point rise in the tax wedge between 2024 and 2025. ↩︎
Source here is MHCLG’s Average Council Tax per dwelling 1993 onwards live table for England. “Average council tax per dwelling” is total council tax payable divided by total chargeable dwellings, so it reflects the actual dwelling mix rather than a Band D equivalent. Cash figures are converted into 2026-27 prices using the ONS CPIH all-items index: monthly CPIH values are averaged over each April-March council-tax year for 1993-94 to 2025-26. The 2026-27 deflator uses the OBR March 2026 Economic and fiscal outlook detailed economy forecast, table 1.7, CPIH index for 2026-27. ↩︎
In 1995, an average-priced home incurred no stamp duty, because the cash price of £51,000 was below the then £60,000 nil-rate threshold. In 2010, when SDLT still applied on a “slab” basis, an average-priced £175,000 home incurred approximately £1,750 of SDLT (£2,700 in 2026 prices). In 2026, an average-priced £270,000 home incurs approximately £3,400 of SDLT.
Assuming a typical owner-occupier makes between three and five owner-occupied house purchases during their lifetime, this implies a rough lifetime SDLT/stamp duty burden on an average household of approximately £0 in 1995, £8,000–£13,500 (in 2026 prices) under the 2010 regime and £10,000–£17,000 under the 2026 regime. This is not a significant lifetime increase.
All inflation adjustments in this footnote use CPI/CPIH-style consumer-price uprating, cross-checked against the Bank of England inflation calculator and ONS consumer price inflation data. House price figures are from the official UK House Price Index. ↩︎
Although it’s an insufficient explanation of itself: total graduate student loan repayments in 2024/25 totalled £5bn, which is very small compared to overall income tax revenues of £330bn. ↩︎
The scatter chart uses OECD data. The vertical axis is the OECD Taxing Wages average tax wedge for a single worker without children earning 100% of the average wage, using the 2025 OECD observation. The horizontal axis is OECD Revenue Statistics total tax revenue for general government as a percentage of GDP, using 2024 where available and 2023 for Australia and Japan. Ireland is excluded because Irish GDP-based ratios are distorted by profit shifting. The UK figure is lower than some headline UK “tax burden” figures. That is because those headlines often refer either to forecast National Accounts taxes in future years, or to total public sector receipts, which include non-tax receipts. This chart uses the OECD tax revenue figure because it gives a like-for-like comparison against other countries. ↩︎
For the estimated UK 2027/28 point, we took the OBR March 2026 Economic and fiscal outlook forecast that National Accounts taxes will be 37.7% of GDP in 2027-28. For the tax wedge figure, we anchored the calculation to the OECD 2025 UK tax-wedge point rather than inventing a new average income. We then solved for the synthetic gross earnings level that reproduces the OECD UK 2025 tax wedge under the UK income tax, employee NIC and employer NIC rules. Then grow that synthetic earnings figure using the OBR March 2026 average weekly earnings index from 2025 to 2027; finally recalculate the tax wedge using frozen 2027/28-style thresholds and rates. This gives an estimated UK 2027/28 tax wedge of 33.3%. ↩︎
The line is an ordinary least squares line of best fit across those 37 OECD countries, with the tax wedge plotted against tax revenue as a share of GDP. The fitted slope is 1.20: on the fitted line, a country with tax revenue one percentage point higher as a share of GDP has an average-worker tax wedge about 1.20 percentage points higher.
The Pearson correlation coefficient is r = 0.77, which is a positive linear association. The R-squared is 0.60, meaning the fitted line explains about 60% of the cross-country variation in the average-worker tax wedge.
The two-tailed p-value for the correlation is 2.12 x 10^-8 (p < 0.001). In plain English: if there were no linear relationship between the two variables, a correlation this large or larger would be very unlikely in a sample of 37 countries. That does not prove causation; it shows a statistically strong cross-country association. ↩︎
The rate is obvious, but the UK has one of the narrowest VAT bases in the world; Denmark has one of the widest, with few exceptions and special rates. See OECD Consumption Tax Trends 2024 for the rate, and OECD Revenue Statistics category 5111 for the overall revenues as a percentage of GDP. Australia uses 2023 VAT/GDP because the 2024 value was not available in the OECD extract. ↩︎
This is a Tax Policy Associates calculation using each country’s tax rates, thresholds and social security rules, following the OECD tax-wedge methodology, to produce more granular results than the published OECD average-worker points. The calculator uses the OECD Taxing Wages 2026 datasets and country equations, and we have cross-checked it against the OECD published results. The calculation is for a single employee with no children and includes personal income tax, employee social security contributions, employer social security contributions and employer payroll taxes where included in the OECD country-equation approach, divided by total labour cost. The horizontal axis is gross wage as a percentage of each country’s OECD average wage; it is not a population income-decile axis. We’ll be publishing more details on this dataset soon. ↩︎
Spain’s very high tax wedge at 10% and 20% of average wage are not a mistake. The OECD Spain country chapter applies Spanish social security contributions using a statutory minimum contribution base. In the calculator, low gross earnings are therefore still subject to employee and employer social security contributions on that minimum base, with employer contributions particularly important. The effect is a high tax wedge at very low full-year earnings, driven by social security rather than income tax; actual part-time cases may be treated differently if contribution bases are prorated. ↩︎
The Mirrlees Review – the most important modern review of the UK tax system – started from the premise that the tax system should be progressive, but should achieve that progressivity as efficiently as possible. And this means being careful not to load too much of the tax burden onto mobile business profits. The standard concern is that source-based taxes on the normal return to capital can discourage investment. The OECD reached a similar broad conclusion in Tax Policy Reform and Economic Growth, finding that corporate income taxes are generally the most harmful major tax for growth, followed by personal income taxes, consumption taxes, and then recurrent taxes on immovable property. One political objection to this line of argument is to object to the assumption that capital can leave, but people cannot. The assumption, however, reflects reality. ↩︎
In a closed economy, with capital unable to move, a tax on corporate profits might fall largely on the owners of capital. But in an open economy like the UK, investment can move, profits can be shifted, finance can be restructured, and new activity can be located somewhere else. That does not mean corporate taxes are impossible or pointless – it means there is a trade-off. Higher source-based taxes on mobile capital can deter investment, encourage profit shifting, or be passed on in lower wages or higher prices. See Chapter 18 of the Mirrlees Review, “Corporate Taxation in an International Context”. The empirical evidence is complicated, and anyone claiming certainty is overstating the case. Some corporate tax is borne by shareholders. Some may be borne by workers. Some may be borne by consumers. The split depends on the tax, the sector, the degree of market power, labour-market conditions, international mobility and the design of the tax base. For example, Arulampalam, Devereux and Maffini, “The Direct Incidence of Corporate Income Tax on Wages”, using European company-level data, found evidence that part of the corporate tax burden is shifted onto wages. Fuest, Peichl and Siegloch, “Do Higher Corporate Taxes Reduce Wages?”, using German municipal business tax variation, estimated that workers bore a substantial share of the burden. But the literature is not one-way. The Tax Policy Center’s balanced summary, “Who bears the burden of the corporate income tax?”, says shareholders bear most of the corporate income tax burden, but not all of it. ↩︎
The chart shows tax years starting 1990-91 to 2029-30, expressed in 2026-27 prices. The historical personal allowance and higher-rate-threshold series was built from nominal threshold data in the IFS Fiscal Facts historical tax dataset, cross-checked against HMRC’s published rates and allowances. The higher-rate threshold is shown as the effective point at which the 40% rate starts for most taxpayers: the personal allowance plus the basic-rate band. The additional-rate threshold is shown from 2010-11, when the additional rate was introduced, using Table TA.2 of HMRC’s historic income-tax rates statistics; from 2023-24 it is the threshold aligned with the end of the personal allowance taper. The chart does not attempt to model Scottish divergences in income tax rates and bands. The 2026-27 point uses the current frozen nominal thresholds: personal allowance £12,570, higher-rate threshold £50,270 and additional-rate threshold £125,140. The dotted 2027-28 to 2029-30 segments show those nominal thresholds remaining frozen, in line with the “without indexation” counterfactual in Table 3.19 of the OBR’s March 2026 Economic and Fiscal Outlook. To plot the dotted years in 2026-27 prices, we deflate the frozen nominal amounts year by year using the OBR’s own September-CPI uprating series from the same table: 2.12% for 2027-28, 2.07% for 2028-29 and 2.03% for 2029-30. ↩︎
The taxpayer counts in the paragraph and the chart numerator are HMRC outturns from Table 2.1 of its Income Tax Liabilities Statistics for 1990-91 to 2025-26. The percentage chart starts in 1992-93 because the full-time-worker denominator is only available as a complete tax-year average from that year. The dotted 2026-27 to 2029-30 taxpayer-count segments are taken directly from Table 3.18 of the OBR’s March 2026 Economic and Fiscal Outlook, using the “without indexation” row for higher-rate taxpayers and the “aligned to the end of PA taper” row for additional-rate taxpayers. On that basis the OBR projects the number of higher-rate taxpayers rising from 7.58m in 2026-27 to 8.59m in 2029-30, and additional-rate taxpayers rising from 1.31m to 1.53m over the same period. For the denominator, we used ONS EMP01 SA, series YCBE, “Total people working full-time”, from the People sheet. The ONS publishes seasonally adjusted rolling three-month Labour Force Survey estimates, so we converted them into tax-year averages by taking the four non-overlapping quarters: Apr-Jun, Jul-Sep, Oct-Dec and Jan-Mar. For 2026-27 onwards, where ONS full-time-worker outturns are not yet available, we projected the denominator by taking the 2025-26 ONS full-time-worker count and scaling it by total employment growth from the OBR March 2026 detailed economy forecast, table 1.6, “Employment (16+, millions)”. That assumes the full-time share of employment stays constant over the forecast period. This is therefore an estimate and a scale comparison, not a literal measurement of the proportion of full-time workers paying higher or additional rate tax: the HMRC/OBR taxpayer counts include all income taxpayers in those bands, not only full-time workers, and the denominator includes full-time workers who may not be income taxpayers. ↩︎
The impact of successive waves of UK anti-avoidance is reasonably clear in the “tax gap” figures. There is no comparable cross-country data. The claim that the UK has closed avoidance more than others therefore rests on anecdote rather than data, but it reflects my experience and that of the tax practitioners and tax officials across Europe who I speak to. ↩︎
See HMRC Table 2.4, and the House of Commons Library summary of it. The Library notes two important caveats. First, these figures are income tax liability figures, not cash receipts. Second, they are shares among income taxpayers, so they exclude people whose income is too low to be charged income tax. For historical context, the same Library briefing says the top 1% paid 21% of income tax in 1999/00 and the top 10% paid 50%, so the concentration is materially higher than a generation ago. We’ve written about that in some detail. ↩︎
We summarised some of the research here, but in short: moderate and higher-paid workers see reduced pay increases; low-paid workers, where the minimum wage means their wages cannot drop, instead see fewer jobs available. The government’s policy paper says the secondary Class 1 NIC rate increased from 13.8% to 15%, and the employer secondary threshold was reduced. The Autumn Budget 2024 policy costings put the Exchequer impact at £23.77bn in 2025/26, rising to £25.71bn in 2029/30. On incidence, the IFS TaxLab says simple economic theory suggests employer and employee NICs should have the same incidence in the long run, and that both are likely to fall predominantly on employees, while noting the empirical evidence is not clear-cut. The OBR uses pass-through assumptions for employer NICs, including a 76% pass-through assumption in its salary-sacrifice costing. The OECD tax wedge measure also treats employer social security contributions as part of the gap between labour cost and take-home pay. This is not a high-earner-only measure: the lower threshold affects low-paid jobs too. But it is a payroll tax, not a VAT-style consumption tax, and the uncapped rate means the cash liability rises with earnings above the threshold. ↩︎
The Budget also contained smaller, more explicit high-income and capital-income measures too: the salary-sacrifice pension cap, higher rates on dividends, savings and property income, higher capital gains tax rates and the “mansion tax”. ↩︎
We haven’t properly modelled this, but the “back of the envelope” version is that if the average working life is 40 years, 33% of the full-time working population is in the higher rate band, and they pay higher rate tax for 20 years, then the % of the population who pays the higher rate at some point is 0.33 x 40/20 = 66%. Of course higher if the threshold freeze continues. ↩︎
The Green Party refer to this as “removing a restriction” on national insurance, but realistically it’s just an increase in tax on incomes. The link between national insurance and pensions/benefits is a tenuous one, and what we have in reality is a combined income tax of 28% on income up to £50,000, and 42% on income up to £100k, etc. The source for the chart is the Tax Policy Associates tax calculator. ↩︎
This comes from the British Social Attitudes survey, which has been asking exactly the same question for 42 years. The raw data is here. The full question is: “Suppose the government had to choose between the following three options. Which do you think it should choose? Reduce taxes and spend less on health, education and social benefits?; Keep taxes and spending on these services at the same level as now?; Increase taxes and spend more on health, education and social benefits?” ↩︎
I’m not including “borrow more” as an option because the UK’s current position, and the current cost of borrowing, make that unpalatable. ↩︎
They don’t give a figure here for how much a wealth tax would raise, but £24bn is a figure often mentioned. ↩︎
The TUC say that increasing the bank surcharge from 3% to to 16% would raise £4bn. It would not raise anything like this amount. The calculation appears to be a simple static calculation, which is not a sensible way to calculate the revenue from any tax increase, particularly one which would raise the UK tax on banks’ profits to the highest in the developed world. The TUC claims this reverses a recent cut in the bank surcharge, but that is tendentious. There was no cut in the tax paid by banks on their profits. When the rate of corporation tax rose in 2023, the surcharge fell, so the overall rate paid by banks remained the same. This reflects the origins of the bank surcharge – a way of ensuring banks did not benefit from the 2015 cut in corporation tax. You can agree or disagree with the policy, but it was not a tax cut. ↩︎
The proposal that the rate of capital gains tax should be equalised with tax on wages also doesn’t have a figure, but let’s say £10bn, assuming that there’s relief for indexation (otherwise the likelihood is that revenues would fall, not rise). ↩︎
The TUC also suggested raising tax on gaming, but that has already happened. ↩︎
After the initial announcement there would be a lengthy design stage, consultations, drafting legislation, building large-scale systems, etc. As we said in our wealth tax paper, the digital services tax (a reasonably simple standalone tax) took eighteen months between announcement and implementation, and the sugar tax (more complex than the DST but much less so than a wealth tax) took 25 months. These taxes have one thing in common: they are paid by a small number of taxpayers (under 20 in each case), and therefore didn’t require a “systems build” – everything could be done manually. The wealth tax is very different, and the ten years it took for HMRC to implement “Making Tax Digital” set a cautionary precedent for the relatively large new reporting base the wealth tax would create. ↩︎
There is a coherent case that says the purpose of a wealth tax is not to raise money but to reduce inequality. I am sceptical because this claim is rarely accompanied by an analysis of the actual impact of a wealth tax on inequality. However these issues are outside the scope of this article, which is about solving fiscal challenges. ↩︎
There is certainly a real issue here: for years, multinationals were able to shift profits into low-tax jurisdictions, and the international tax system was badly out of date. But a lot of the reporting has failed to catch up with the internal development designed precisely to fix that. First the OECD BEPS project in the 2010s, then Pillar Two, a decade later. Pillar Two introduces a global 15% minimum effective tax rate for large multinational groups, and the UK has implemented it through the Multinational Top-up Tax and Domestic Top-up Tax. That does not mean multinational avoidance has vanished, or that enforcement no longer matters. But it does mean that the obvious international response has, to a large extent, already happened. More fundamentally, the numbers are much smaller than the politics suggests. Amazon’s (non-AWS) profit from outside the US was only $4.7bn in 2025. There is no hidden pot of hundreds of billions sitting in the UK profits of multinationals. ↩︎
Leave a Reply