The hospitality industry is lobbying for a VAT cut from 20% to 10%. The political case is simple and compelling: save pubs, restaurants, cafés and hotels; protect jobs; save high streets. The campaign says it’s self-funding and pro-growth.
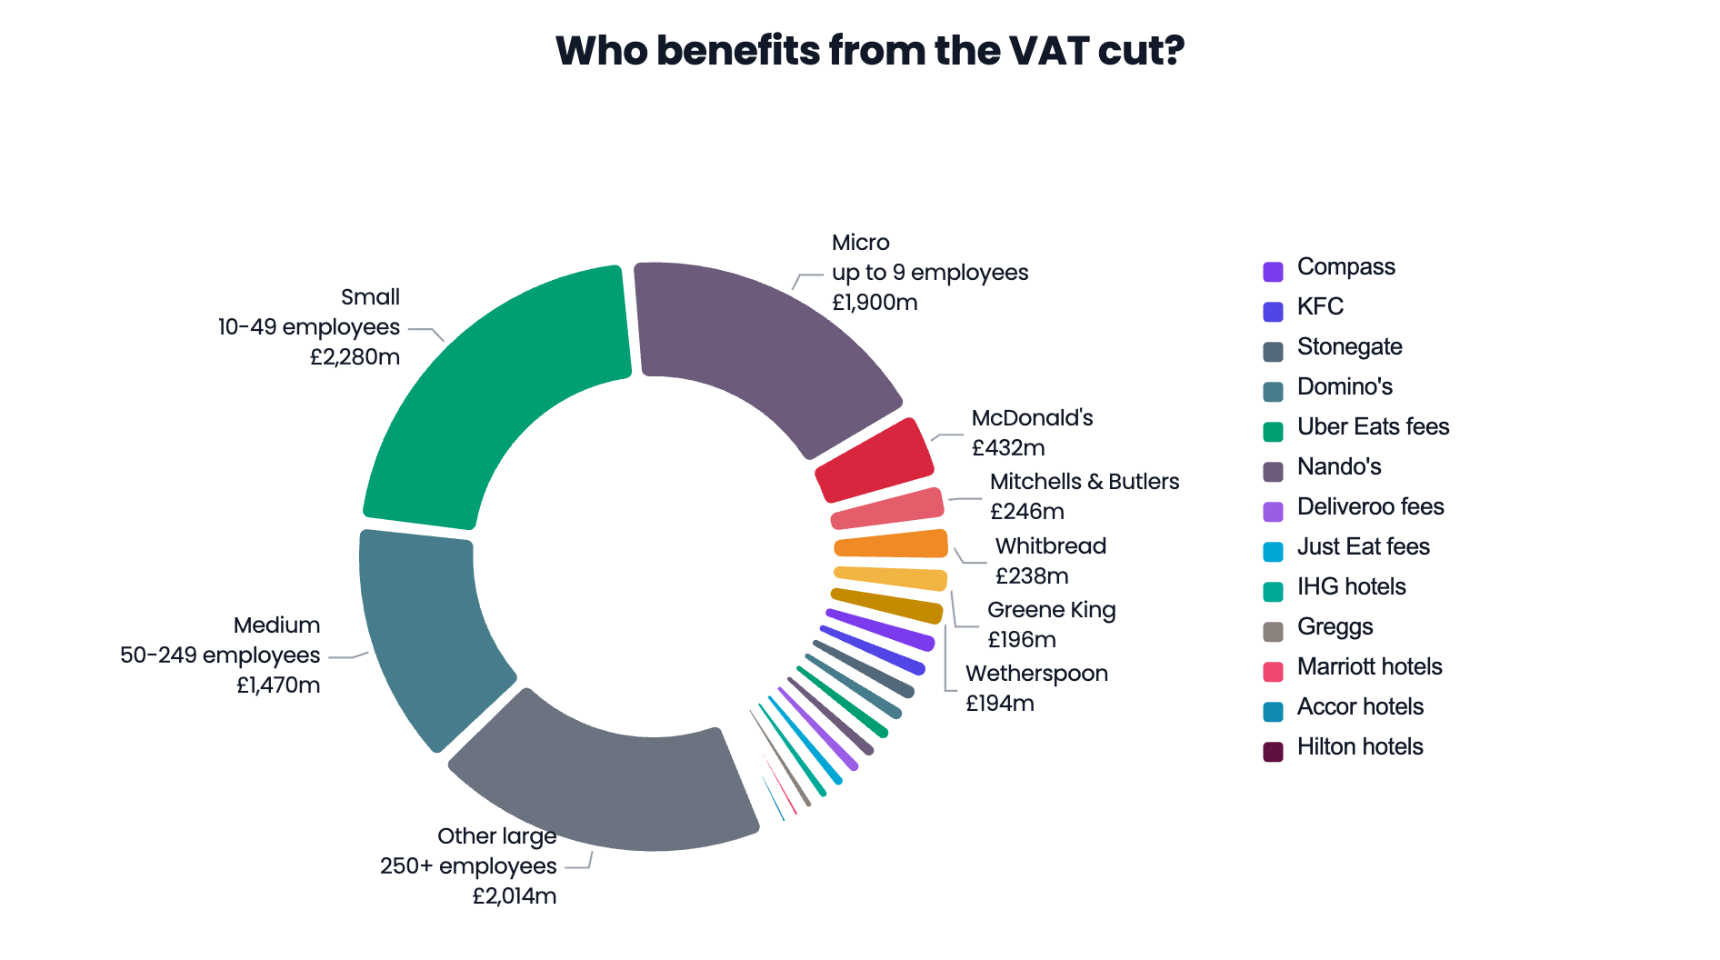
The reality is different. It’s a hugely expensive subsidy, likely costing more than £12bn a year. 45% of hospitality businesses will see no benefit at all. The largest single share of the benefit goes to big business to increase profits (rather than cut prices) – and McDonald’s alone will receive over £400m.
The main campaign is VAT’s The Problem, fronted by Tom Kerridge and backed by UKHospitality and other trade bodies. It asks for a permanent 10% hospitality VAT rate for “pubs, restaurants, cafes, hotels, bars, nightclubs, festivals and many more”, and says the cut will save businesses and pay for itself.1
But the campaign never answers the most basic question: where does the money come from? A £12bn VAT cut has to be funded by higher taxes, lower spending or more borrowing. Each has its own cost. So the test is not whether hospitality would benefit from the money – of course it would. The test is whether this is the best use of £12bn. It plainly is not.
This report summarises the issues, explains the rationale, and then includes a detailed annex explaining our methodology. There’s a shorter version of the argument in The Times on 12 June 2026.
In this report:
Executive summary
There are four big problems with this proposal.
It’s mis-targeted
The hospitality industry faces very real problems. It’s suffered a “cost shock” from recent increases in employer NICs, minimum wage, and business rates.
It’s understandable they want to cushion that shock. But VAT is a strange choice of solution. The most vulnerable businesses, very small ones, don’t pay VAT at all – 45% of all hospitality businesses fall into this category.2
(The hospitality industry commissioned a survey supposedly showing that 75% of hospitality businesses believe a VAT cut is vital for their survival. Given only 55% of hospitality businesses benefit from a VAT cut, the figure cannot be correct.)
There are other strange results. A small VAT-registered business may receive more than twice its recent cost shock. Wetherspoon’s cost shock is about £63m, but a 10% VAT rate, if prices did not fall, would be worth about £193m. And across the sector as a whole, the industry’s own figures showed that employer NICs, minimum-wage increases and business-rates changes together cost hospitality about £3.5bn.
And, overall, the industry is asking for a VAT cut that is three times larger than the cost shock.
This chart shows the impact:3
The cost is huge
The best static estimate of the cost is £10.8bn. But the real cost is likely to be larger, because a permanent reduced rate creates a valuable boundary. “Hospitality-adjacent” businesses will have every incentive to recharacterise activity so that more of their revenue falls within the 10% rate.
Supermarkets, convenience stores and petrol forecourts would add seating and café-style meal deals. Cinemas, festivals, visitor attractions and sports venues would bundle tickets with food and drinks, and push as much value as possible into food and drinks. Sports events would categorise themselves as “festivals”. Serviced apartments and short-let operators would claim to be hotels. This is just what rational businesses do when the tax system draws a valuable line through ordinary commercial activity.4
The proposal creates an entirely new Jaffa Cake problem, on a much larger scale – and we’ve estimated it takes the total cost to somewhere between £12bn and £14bn:
The methodology annex below explains the VAT arithmetic and the boundary-leakage assumptions behind this range.
The largest gains go to big business
This is not a proposal to cut prices. The evidence from previous VAT cuts is that much of the benefit is normally retained by businesses, not passed on to consumers. The unusual element here is that the industry has said explicitly: the cut is intended to stabilise businesses by increasing margins.
The biggest hospitality businesses have the largest sales, so they receive the largest gains:
The methodology annex below explains the turnover allocation, the VAT-registration adjustment and the named large-business estimates.
The growth case is weak
Campaigners say the VAT cut will pay for itself through growth. That is not credible.
If prices fall, the main effect is to shift consumer spending towards pubs, restaurants and hotels and away from other parts of the economy. If (as the industry says) prices do not fall, the cut becomes a producer subsidy: it supports margins, jobs and capital in hospitality (and away from other areas). There’s no free growth here; just the favouring of one sector over others.
And the money has to come from somewhere. A £12bn VAT cut means higher borrowing, lower spending or higher taxes elsewhere. Each has its own economic cost.
So the real question is not whether hospitality would benefit. It’s whether a hospitality VAT cut would do more for growth than alternative uses of the same money. Our view is that almost any serious alternative – cutting stamp duty land tax, abolishing income tax cliff edges, investing in infrastructure, improving skills, or reducing the deficit – is likely to do more for growth.
On our estimates, the “bang for the buck” for this proposal – the long-run GDP benefit per pound of tax-cut cost – is the lowest of any potential tax cut we’ve scored:
From the free-market right to the progressive left, economists who agree on little else agree on this: a broad VAT with a single rate beats a patchwork of sector-specific rates. Help for struggling businesses and households is better delivered directly than indirectly in the VAT system, with a huge deadweight5 cost.6
There are much better ways to help the hospitality industry. Most obviously: reform business rates and (if there is fiscal space to do so) repeal the employer national insurance rise.
But the public should be told the trade-off plainly. A hospitality VAT cut means £12bn a year of tax rises, spending cuts or borrowing.
For that money, we could do much better.
The cost shock
At its core, the industry makes a good case that it’s facing an unprecedented cost shock.
Hospitality was hit in April 2025 by higher wage costs, higher employer NICs and reduced business-rates relief.7 UKHospitality put the annual increase at £3.4bn: £1.9bn in wages, £1bn in employer NICs and £0.5bn in business rates. We think that’s broadly correct as an order-of-magnitude estimate8 – in today’s money, it’s about £3.5bn.
The sector is unusually exposed because it is low-paid and labour-intensive. In 2023/24, about one in five hospitality workers were paid the minimum wage. Hospitality also employs a large share of young workers, who saw especially large minimum wage increases.9
Prices won’t fall
There are two possible outcomes.
The first is that businesses mostly use the VAT cut to cut prices. Meals, coffee, hotel stays and pints become cheaper. People buy more. Demand rises – with a potential impact on growth (albeit usually a weak one).10
The second is that businesses keep prices broadly unchanged and use the money to absorb costs and increase margins. This is what generally happens with VAT cuts – we wrote about that here, and it’s well-understood in the VAT policy world.11 So consumer purchasers pay the same, and most business purchasers see a price increase (because they could previously recover the VAT element of the price, but can’t recover the element that the price increased to replace the VAT).12
We do not have to guess, for two reasons.
First, France and Lithuania ran this exact experiment.
In July 2009 France cut VAT on sit-down restaurant meals from 19.6% to 5.5%. Menu prices barely moved: they fell by less than 2%. Restaurant owners kept the largest share of the money, and their profits rose by around a quarter. When the rate later went back up, prices rose four to five times faster than they had fallen.13
There is also a more recent pandemic example. Lithuania temporarily cut VAT on restaurants and catering from 21% to 9% in July 2021. An IMF analysis found no statistically significant impact on consumer spending on restaurants and catering services.
Second, we can listen to the campaign itself.
Most of the time, when industries lobby for VAT cuts, it’s the policy wonks saying prices won’t fall and the industry claiming that it will. But in this case, the industry is telling us that it won’t cut prices. At a UKHospitality event on 10 June, Tom Kerridge told a UKHospitality event that:14
“We’re at risk of the government framing this VAT cut as savings for customers. We should absorb the cut, and maybe in two or three years we can pass on the savings – this would be to stabilise us and stop us from shutting.”
When the economic evidence tells us prices won’t fall and the industry tells us prices won’t fall, then we can be pretty confident: prices won’t fall. So, any economic claims based upon reduced prices can be safely ignored. The benefit will go to the industry, not consumers.15
There is an important qualification here: the pass-through evidence we cite is evidence about the short and medium term, not the ultimate position after many years. The IMF study uses monthly price data and looks at the dynamics around VAT reforms; the French restaurant study measures the effect thirty months after the 2009 cut. Economic theory gives a reason to expect more pass-through over time in competitive markets, as firms adjust capacity and competition erodes excess profits. But that is a general principle, we can’t be sure it will be the case, and it’s hard to measure.16 So it would be wrong to conclude there will never be greater pass-through in the long run; but the real-world evidence for hospitality VAT cuts does not show large consumer price reductions over thirty-month period for which we have credible evidence.17
The cost
HMRC estimates that cutting the 20% standard rate on accommodation and food and beverage services to 10% would cost £10.5bn in 2026/27. We estimate that festival/live-event and nightclub/club admissions add about £0.3bn, giving a campaign-scope static starting point of £10.8bn.
The VAT arithmetic is straightforward:18
The methodology annex below gives the formula behind this chart, the implied VAT base and the supply-chain VAT point.
Hospitality is a significant part of the UK economy, and so this would become one of the UK’s largest VAT reliefs:
It would, however, be incorrect to assume that the cost will be limited to the £10.8bn static estimate.
VAT works best when the base is broad and the rules are simple.19 A permanent hospitality rate does the opposite. It creates a new boundary between zero-rated food, 10% hospitality and 20% everything else. That means complexity.20 It also means opportunities for businesses in other sectors to sneak across that boundary. Businesses near the boundary will have every reason to change products, contracts, invoices, tills, menus, seating, packaging and marketing so that more of their revenue falls on the cheaper side of the line. The VAT advisers we spoke to could immediately see potential avenues for hospitality-adjacent businesses to exploit.
We have been here before. The UK’s existing food VAT rules are famously absurd. Jaffa Cakes, hot sandwiches, marshmallows, gingerbread men, eat-in sandwiches, cold takeaway food and catering rules all show what happens when VAT draws arbitrary lines through ordinary commercial activity.21
A hospitality rate would multiply those problems.22 These are all large elements of the economy. If the serviced apartments sector styled itself as hotels then that could put £600m of VAT at risk.
We have estimated the cost by starting with the £10.8bn static estimate and then adding an allowance for boundary leakage from adjacent standard-rated activity: standard-rated food and drink edges, alcohol, events and attractions, accommodation extras, package travel, venue catering and other mixed hospitality supplies.
On our central view, £10bn to £18.8bn of adjacent spend migrates, adding £0.76bn to £1.42bn. In a looser or more highly litigated case the extra cost is around £2bn to £4bn. We expect £12bn to £14bn is the most likely range; we conservatively use the £12bn figure in this report.
The methodology annex below sets out the scenario bands, the migration assumptions and the evidence basis for treating the reduced-rate boundary as a leakage risk.
Who benefits?
Large businesses, those with at least 250 employees, account for about 44% of sector turnover. Businesses with at least 500 employees account for about 39%.23 On the raw turnover split, large businesses would receive about £4.60bn of HMRC’s core £10.5bn estimate. After removing below-threshold micro turnover, the large-business share rises to about £4.85bn. We have not allocated the separate £0.3bn festivals/nightclubs admissions add-on by business size, because the public data do not give a reliable size-band split for that activity.
That means about £4.85bn of HMRC’s core estimate goes to large hospitality businesses: restaurants, pubs, hotels, contract caterers and home-delivery platform fees:24
The impact on growth
Campaigners sometimes argue that the tax cut will pay for itself through growth. We do not think that is credible.
It is generally the case that any tax cut or spending increase will have “multiplier effects” as the additional money injected into the economy circulates. The problem is that the money for a VAT cut does not appear by magic – the Treasury has to find it. It can borrow, cut spending or raise other taxes. And that will have a multiplier effect, working in the opposite direction.
So whilst a hospitality VAT cut would put cash into the sector and likely reduce closures, there will be an impact on the sector/people the money is coming from – and that has to be taken into account.
A hospitality VAT cut therefore only has a positive net effect if it beats the alternative use of the same £12bn. UKHospitality hasn’t even tried to make that case. We think it’s very unlikely to be true for a fundamental reason: VAT has a less negative effect on growth than most other taxes (which is why economists tend to favour it25). But the logical consequence of this is that VAT cuts have a less positive effect on growth than most other tax cuts.26
The “bang-for-the-buck chart” near the top of this report puts that into numbers. We estimate that the hospitality VAT cut produces only about 4p of annual GDP benefit per £1 of annual tax-cut cost. The methodology annex below explains the chart calculation and why business-rates reform is not included as a comparator.
If a hospitality VAT cut results in less growth than other uses of £12 to £14 billion, then it is accurate to say that it is anti-growth.
That is, however, just the start. Hospitality can make a good case that it matters to the economy and that it is under pressure. But many sectors can say the same. Retail, childcare, culture, sport, independent retail, personal care, events and domestic tourism would all have arguments for special treatment.
The VAT base has always been an attractive target for lobbyists. Governments have mostly been able to resist because, once a new special rate is created, the precedent is hard to contain. But now other sectors will ask why hospitality received a permanent subsidy and they did not.
Each new special rate creates additional compliance cost27 and revenue leakage. But the larger problem is political. A hospitality VAT cut would create an irresistible lobbying template: identify a sympathetic sector, argue social value and job intensity, then seek a reduced VAT rate.
That is anti-growth in a deeper sense. It turns scarce fiscal capacity away from spending, tax cuts or reforms that could raise productivity, and towards industries with effective lobbyists.
Don’t other countries do it?
The campaign says that many European countries apply reduced rates to restaurants or hotels. That’s true. The OECD says restaurant services are subject to reduced rates in 17 of the 37 OECD countries with a VAT, and hotel accommodation in 26 of them. The UK is unusual in applying the standard rate to both.28
This, however, not a reason to copy them. It’s a reason to ask whether the UK wants to import one of the worst features of old European VAT systems into our VAT system, which is already one of the worst in the developed world.
The context is that the UK is not a clean, broad-base VAT country refusing special pleading from hospitality. The UK VAT base is already full of holes.29 Food, children’s clothes, books, passenger transport, new housing, domestic fuel, education, healthcare, finance, insurance and many other areas are outside the standard-rate base in whole or in part. We would all be much better off with a simpler VAT system, a wider base, and a lower rate.30 We already have one of the narrower VAT bases in the OECD:3132
The case for reduced VAT bases is almost always weak.33 But it’s particularly weak for the UK – adding a permanent 10% hospitality rate would make an already narrow and complicated tax base narrower and more complicated.
Ireland is a useful cautionary example: a 2025 Irish Fiscal Advisory Council working paper found that Ireland’s 2011 VAT cut from 13.5% to 9% was only about 50% passed through to consumers, while the 2020 cut showed little measurable pass-through for takeaway prices; by contrast, the 2019 and 2023 VAT increases were passed through more strongly. The paper’s warning is directly relevant here: temporary VAT cuts can be asymmetric, with prices falling little when VAT is cut but rising when VAT is restored.34 That helps explain why Department of Finance officials warned Irish ministers that the 2026 hospitality VAT cut would be expensive, blunt, poorly targeted and likely to create substantial deadweight. They did it anyway.
What should be done instead?
Better-targeted responses
One answer is to do nothing, and say that if hospitality businesses fail then jobs and capital will migrate to other, more productive sectors.
But if that is not the desired outcome, then we need to look at the actual problems and think about how to fix them.
The Resolution Foundation said that the combined effect of national insurance and the minimum wage increases would reduce total employment by 80,000. Its conclusion was that the rise in minimum wage should be slowed down. That is well outside our expertise; but when the UK’s most prominent left-wing economic think tank says this, others should listen.
As for the employer National Insurance increase, we said at the time it was the worst possible tax increase. It should be reversed.
Business rates should also be reformed. The system has numerous problems, not least the time lag between valuation and payment, which means that often business rates are out of all proportion to the economic value of the premises. Ideally, they’d be replaced with a land value tax.
And if the Government had £12 billion to spend on a tax cut, there are others which offer much more “bang for the buck” in terms of GDP growth effects. The chart at the top sets these out.
This matters most for micro businesses. They are exposed to minimum wage increases (but usually not employer NICs and business rates). However, many are not VAT-registered. Some appear in official business data because they run PAYE, not because they charge VAT. They can suffer the cost shock and miss the benefit. Big business gets the cash.
A VAT cut is superficially attractive and easy to campaign for. That’s all it’s got in its favour. It will not pay for itself. It will not cut prices. It will not target the businesses most at risk – it does nothing for almost half the industry, with most of the benefit going to the largest players.
And it’s expensive and anti-growth.
There are much better things we can do with £12bn.
Annex: our methodology
This methodology section follows the same structure as the report. The cost section explains the headline £12bn to £14bn estimate and the VAT arithmetic charts. The mis-targeting section explains the chart comparing cost shocks with VAT-cut benefits. The who-benefits sections explain the doughnut chart and the named large-business bar chart. The anti-growth section explains the “bang for the buck” chart and why business-rates reform is not included in it.
We use official estimates where they exist, public accounts and market disclosures where they do not, and explicit assumptions where the campaign has not defined the policy boundary.
The code used to generate the charts and some of the figures can be found on our GitHub.
Cost – the starting point
The hospitality industry has made no attempt to quantify the cost of the VAT cut it is seeking.
We start with HMRC’s official static estimate. Parliamentary answer UIN 108537 says that cutting the 20% standard rate on accommodation and food and beverage services to 10% would cost £10.5bn in 2026/27.
The full HMRC schedule in that answer is:
- 15% rate: £5bn.
- 12.5% rate: £8bn.
- 10% rate: £10.5bn.
- 5% rate: £17bn.
- 0% rate: £23.5bn.
We read the estimate as applying to supplies currently taxed at the 20% standard rate, not existing zero-rated supplies. Hot takeaway food and drink is standard-rated if the statutory tests are met. Cold takeaway food and drink is zero-rated unless it is a type that is always standard-rated, or is eaten in a designated area.
Is HMRC’s £10.5bn figure plausible?
HMRC has not published the rationale for the £10.5bn figure. It can be sense-checked as follows:
HMRC’s £10.5bn figure implies about £138.6bn of VAT-inclusive qualifying spend, or about £115.5bn of VAT-exclusive qualifying sales.35
Then three checks:
First, ONS household consumption data are comfortably larger than HMRC’s implied base. The latest ONS Quarterly National Accounts time series gives 2025 household final consumption expenditure on “restaurants and hotels” of £192.9bn at current prices, seasonally adjusted.36 But that includes items plainly outside the hospitality campaign, such as audio-visual equipment, books, newspapers, garden products, pets, veterinary services and games of chance.
The best official proxy we have found is ONS Family Spending workbook 1, Table A1: “Live entertainment: theatre, concerts, shows” is £45m per week and “Admissions to clubs, dances, discos, bingo” is £15m per week, giving £60m per week, or £3.1bn a year. Uprating that to 2026/27 using the OBR GDP deflators gives about £3.3bn; applying the VAT-cut arithmetic for a move from 20% to 10% with prices unchanged, gives an additional static cost of about £300m.39
We therefore use £10.8bn as the static starting point. It is plausible the actual figure should be higher, but a more comprehensive analysis would require more specificity from the VAT cut campaign.
Boundary leakage
A permanent reduced rate creates a valuable line between 20% activity and 10% activity. The question is how much additional adjacent standard-rated activity could be moved, bundled, recharacterised or litigated into the reduced-rate category.
Each additional £1bn of VAT-inclusive spend moved from 20% to 10% costs about £75.8m a year.
The adjacent-base figures are deliberately round scenario bands:
- £75bn is a cautious adjacent-base assumption.
- £125bn is close to the same order of magnitude as HMRC’s implied qualifying base.
- £175bn to £225bn test looser or litigated boundary cases where a wider set of standard-rated supplies is pulled towards the reduced rate.
| Scenario | Adjacent base | Migration | Extra annual cost |
|---|---|---|---|
| Very tight drafting/enforcement | £75bn | 0.3% to 0.7% | £0.02bn to £0.04bn |
| Low leakage | £75bn | 3% to 7% | £0.17bn to £0.40bn |
| Central | £125bn | 8% to 15% | £0.76bn to £1.42bn |
| High | £175bn | 15% to 25% | £1.99bn to £3.32bn |
| Stress/litigated | £225bn | 20% to 25% | £3.41bn to £4.26bn |
Adding those amounts to our £10.8bn campaign-scope static starting point gives: no leakage, £10.8bn; very tight drafting/enforcement, about £10.8bn; low leakage, about £11.0bn to £11.2bn; central, about £11.6bn to £12.2bn; high, about £12.8bn to £14.1bn; and stress/litigated, about £14.2bn to £15.1bn. The article uses £12bn as the headline figure.
The migration percentages reflect our judgment, because there is no published official estimate of how much standard-rated activity would be recharacterised after a permanent hospitality reduced rate. Tighter drafting, anti-bundling rules and visible HMRC enforcement push the result down. Loose drafting, taxpayer litigation, mixed-supply planning and lobbying creep push it up.
This is all consistent with the wider evidence base. The European Parliament’s 2021 VAT study says empirical estimates are scarce but multiple rates create compliance costs and misclassification incentives. The World Bank’s 2024 VAT paper says reduced rates create complexity and opportunities for abuse. The Office of Tax Simplification’s 2017 VAT review identified multiple rates, zero rates and exemptions as long-standing UK VAT irritants, using food-boundary examples such as Jaffa Cakes, eat-in/out sandwiches and gingerbread men.
Mis-targeting and the cost-shock chart
The chart is scaled as a percentage of annual sales, or in the sector-wide row as a percentage of the implied VAT base. Otherwise the sector and Wetherspoon rows would make the micro and small examples unreadable.
Sector row
The sector-wide cost row uses UKHospitality’s April 2025 estimate, uprated in the article to about £3.5bn in 2026/27 terms: £1.942bn wages, £1.022bn employer NICs and £0.511bn business rates.
The sector-wide VAT row uses our £10.8bn static 2026/27 cost estimate. A £10.8bn retained VAT benefit implies a VAT-exclusive qualifying sales base of £119bn, because £10.8bn is 9.091% of that base. The chart therefore shows sector costs of about 3.0% of the implied base and a VAT benefit of 9.1%, a net difference of about £7bn before behavioural effects, price pass-through or boundary changes.
Synthetic micro business
The micro-business example has £89,000 of annual turnover, just below the VAT registration threshold, and employs four adult part-time workers for 16 hours a week. The adult National Living Wage rate rose from £11.44 in 2024/25 to £12.21 in 2025/26, so each worker costs £640.64 more in wages. Four workers cost £2,563 more.
On these assumptions, the business does not pay employer NICs and does not pay business rates because of small business rate relief. But because it is under the VAT registration threshold, it receives no direct benefit from the VAT cut.
Synthetic small VAT-registered business
The small-business example has £600,000 of VAT-inclusive annual customer sales, ten adult minimum-wage employees and a £40,000 rateable-value premises. The wage, NIC and rates shock is about £20,000. If the business kept customer prices unchanged, a 10% VAT rate would be worth £600,000 x (20/120 – 10/110) = £45,455. Net gain: about £25,000.
The staffing assumption is five adult National Living Wage employees at 35 hours a week and five at 16 hours a week. The 2024/25 to 2025/26 wage increase is £1,401.40 for each 35-hour worker and £640.64 for each 16-hour worker, or £10,210 in total.
Employer NICs are calculated using the 2024/25 secondary threshold of £9,100 and rate of 13.8%, then the 2025/26 threshold of £5,000 and rate of 15%, with Employment Allowance increasing from £5,000 to £10,500. On these assumptions, actual employer NIC after Employment Allowance rises from about £3,376 to about £6,286, an increase of £2,910.
The business-rates calculation uses the Government’s own £40,000 rateable-value example. In 2024/25, gross rates of £19,960 less 75% retail, hospitality and leisure relief left £4,990 payable. In 2025/26, the same £19,960 less 40% relief left £11,976 payable. The rates increase is therefore £6,986.
The sources are GOV.UK minimum wage rates, GOV.UK employer NIC changes, the 2024/25 retail, hospitality and leisure relief, and the 2025/26 retail, hospitality and leisure relief.
J D Wetherspoon
J D Wetherspoon is a useful large-business example because it publishes unusually detailed reports. Its FY2025 annual report reported 794 pubs, total sales of £2.1275bn, profit before tax and separately disclosed items of £81.4m, wages of £756.7m, social security costs of £55.6m, 24,329 full-time-equivalent employees and 42,081 average monthly employees.
Wetherspoon’s 2026 interim results said: “The increases in national insurance and labour rates, which will cost approximately £60m per annum, have impacted the company and others in the hospitality industry.” Wetherspoon gives a combined £60m figure for National Insurance and labour-rate increases, not a split.
To split it for the chart, we use the statutory cost increase for a 35-hour adult National Living Wage worker. Wages rose by £1,401.40 a year. Employer NICs before Employment Allowance rose by £965.86. That gives a 59.2% wage / 40.8% employer-NIC split, or about £35.5m wages and £24.5m employer NICs within Wetherspoon’s £60m figure. As a cross-check, applying the same £2,367 combined annual increase to Wetherspoon’s reported 24,329 FTE employees gives about £57.6m, close to the company’s own £60m figure.
The same interim report’s tax table showed UK business rates of £22.5m for the first half of FY2026, compared with £42.2m for the whole of FY2025. Annualising the first-half FY2026 figure gives £45.0m, about £2.8m above FY2025. That is an indicative latest-run-rate comparison, not a precise isolation of rating-policy changes.
Adding the rough £2.8m business-rates increase to Wetherspoon’s £60m wage and employer-NIC figure gives a modelled cost increase of about £63m. The Wetherspoon VAT benefit is calculated as £2.1275bn/11 = £193.4m, using VAT-exclusive reported sales. Net gain: about £131m.
We constructed the small- and micro-business examples after speaking to accountants who work with the sector. They should be meaningfully representative, but are not taken from real accounts.
The point of the chart is not that these are forecasts for every business. It is that the pressure is employment- and property-based, while the VAT cut is sales-based and only helps VAT-registered businesses making taxable sales.
The all-beneficiaries doughnut chart
We use DBT’s 2025 Business Population Estimates, Table 5, for SIC Section I, “Accommodation and Food Service Activities”, as a first-pass proxy for where taxable hospitality turnover sits. It is imperfect: some turnover is outside scope, some VATable hospitality activity sits outside Section I, and DBT turnover does not separately identify existing zero-rated cold takeaway food. But it is much better than allocating the tax cut by business count.
The raw DBT turnover split is:
- SMEs with 0-249 employees: £81.6bn turnover, 56.2% share, implying £5.90bn of HMRC’s core £10.5bn estimate.
- Large businesses with 250-499 employees: £7.6bn turnover, 5.2% share, implying £0.55bn.
- Very large businesses with 500+ employees: £56.1bn turnover, 38.6% share, implying £4.05bn.
- All large businesses with 250+ employees: £63.7bn turnover, 43.8% share, implying £4.60bn.
The Commons Library says 99.6% of hospitality businesses are SMEs and 97.7% are small businesses. That does not contradict the turnover split. SMEs dominate by count; large businesses take a large share of turnover.
We then adjust for businesses that appear in DBT’s data but would not receive a VAT-rate benefit. DBT’s figures include VAT/PAYE-registered businesses and estimated unregistered businesses. The DBT release says the estimates cover businesses registered for VAT and/or PAYE, plus unregistered businesses. The DBT methodology note says unregistered businesses are approximated from Self Assessment businesses below the VAT threshold and without employee costs, all placed in the no-employees size class.
So the doughnut first excludes the £3.398bn of Section I turnover for zero-employee unregistered businesses. We then apply a PAYE-only sensitivity. DBT Table 5 gives 233,080 Section I businesses, of which 60,670 are unregistered, leaving 172,410 VAT/PAYE-registered businesses. HMRC’s Annual UK VAT statistics 2024 to 2025 record 128,500 active VAT traders in Accommodation and Food Service Activities. The gap is about 43,900 businesses. We treat that gap as micro businesses below the VAT threshold, and subtract turnover capped at £90,000 each, £3.95bn, from the micro-business proxy.
We then apply one VAT-base eligibility factor equally to every size band. We do not have robust evidence that cold takeaway and mixed-supply eligibility improves with business size; in some bakery, coffee and food-to-go chains the opposite may be true. A single factor cancels in the share calculation, making the split a clean allocation by registration-adjusted turnover.
On that adjusted proxy, micro businesses receive about £1.90bn of HMRC’s core £10.5bn estimate; small businesses, about £2.28bn; medium businesses, about £1.47bn; and large businesses, about £4.85bn. We do not allocate the separate £0.3bn festivals/nightclubs admissions add-on because the data do not give a reliable size-band split for that activity. Using a single average factor rather than a size-graduated 85%-to-98% range changes any size slice by at most about £0.2bn, around 2% of the core £10.5bn, and does not affect the conclusion.
The doughnut shows eighteen visible named large operators totalling about £2.84bn within the core HMRC allocation, then leaves about £2bn for other large businesses. That residual includes smaller named operators in the bar chart, such as Aramark, plus other large businesses we have not named.
The named large-business bar chart
We assume no pass-through. The gross benefit is, therefore, turnover divided by 11 where turnover is VAT-exclusive, or 7.576% of gross consumer spend where we use VAT-inclusive systemwide spend. We then apply explicit VAT-base eligibility factors where an operator has material zero-rated, exempt, outside-scope or non-hospitality turnover. The central illustrative subtotal is £3.2bn.
The main eligibility assumptions are:
- 100%. delivery-platform fee lines; Mitchells & Butlers, J D Wetherspoon, Stonegate; and the rough IHG, Marriott, Accor and Hilton hotel-system estimates.
- 95%. McDonald’s, KFC UK & Ireland, Domino’s, Nando’s and Burger King UK – reflecting a conservative/high estimate of zero-rated takeaway/delivery milkshakes, plain milk, salads and a few other cold items.40
- 90%. Whitbread/Premier Inn and Travelodge, reflecting UK accommodation dominance but some group or mixed revenue.
- 85%. Greene King, reflecting pub dominance but a brewing/wholesale mix.
- 80%. Costa and Starbucks system-store sales, reflecting cold takeaway and mixed-sales issues.
- 75%. Compass Contract Services and Aramark, reflecting contract catering in scope but facilities-management and mixed-revenue risk.
- 60%. Sodexo, reflecting a larger facilities-management and mixed-revenue risk.
- 50%. Greggs, reflecting cold takeaway and mixed sales.
Delivery platform fees
The bar chart includes only the three named delivery platforms’ fee revenue, not restaurants’ share of delivery orders. The 2024 platform figures are: Uber Eats UK Limited turnover £1.330bn, from its Companies House accounts; Deliveroo UK & Ireland revenue £1.254bn, from Deliveroo’s H1 2025 presentation; and Just Eat UK & Ireland revenue €1.387bn, from Just Eat Takeaway.com’s full-year 2024 results, converted at about £0.85/€ to £1.18bn.
Lumina forecasts the delivery market at £14.3bn in 2025, up 3.1%, and above £15.8bn by 2028. We apply a round 10% uplift to approximate 2026/27. If gross prices are unchanged, reducing VAT from 20% to 10% on VAT-exclusive fee revenue is worth one-eleventh of qualifying turnover. That gives about £133m for Uber Eats, £125m for Deliveroo and £118m for Just Eat. We do not add a separate line for other aggregators.
This is approximate because platform accounts include some grocery, alcohol, convenience and retail delivery. The campaign has not defined exactly what is covered. Excluding platform commission and delivery fees would create distortions, complications and avoidance opportunities. In particular, the obvious solution would be for the platforms to cease charging fees to consumers and instead charge fees to restaurants who could recover the VAT. That is very hard to counter, so we assume platform fees are within the 10% rate.
McDonald’s systemwide estimate
The McDonald’s estimate is systemwide: customer-facing sales of company-owned and franchised restaurants combined, because that is the base on which VAT is charged. We use a top-down method from franchisee remittances. McDonald’s Restaurants Limited (Companies House 01002769) reported turnover of about £1.82bn in 2024, comprising about £905m of company-owned restaurant sales and about £917m of rent, royalties and fees from franchisees, as Business Live reports.
Why include franchisees? We think that’s the correct approach both intuitively and economically. In economic terms, a McDonald’s franchise is not a small independent restaurant that happens to sell burgers. It’s a local operating unit of the McDonald’s system. Franchising is, realistically, a way for McDonald’s to expand using other people’s capital and local management, while retaining central control of the brand, product, systems and economics. It’s just a different way to run a multinational chain.
In the UK, a franchisee typically pays a service fee of about 5% of sales plus rent that varies widely, so the company collects on the order of 17% to 22% of franchisee gross customer sales, depending on rent mix and whether the separate national advertising levy is included. Grossing the roughly £917m of franchise income back up at that rate implies franchised customer sales of about £4.2bn to £5.4bn. Adding the roughly £905m of company-owned sales gives systemwide sales of about £5.1bn to £6.3bn.
Two cross-checks are slightly higher. McDonald’s own franchise financials say 80% of UK franchised restaurants had annual sales of £2.0m to £5.8m from January to December 2025. McDonald’s also says it has about 1,435 restaurants serving almost 4m customers a day; at about £5 average spend, that implies about £7.3bn of annual customer spend.
Taking the top-down figure as the primary anchor, we use a conservative systemwide base of about £5.5bn to £6bn. A 20% to 10% VAT cut retained by the business is worth 7.576% of gross sales, so the retained benefit is on the order of £415m to £455m before a 5% reduction for zero-rated takeaway/delivery items (milkshakes, plain milk, cold food); the chart therefore shows about £430m. Because most McDonald’s UK restaurants are run by franchisees, this benefit would initially be shared between McDonald’s and its franchisees (with the split dependent on the terms of the franchise agreements). We therefore attribute the estimate to the McDonald’s system as a whole.
Contract catering
The campaign has not gone into detail on contract catering. Treating contract catering differently from consumer-facing catering would create boundary and avoidance problems, so we assume it benefits from the cut. That is consistent with UK SIC 2007, where class 56.29 includes industrial catering, food service contractors, concessions and canteens/cafeterias, and with HMRC’s contract-catering VAT manual.
For contract caterers we start from full Companies House turnover and then apply the eligibility factors above pending a more precise VAT-base split between catering and facilities-management revenue: Compass Contract Services (U.K.) Limited reported £2.403bn turnover for the year ended 30 September 2024; Sodexo Limited reported £1.437bn turnover for the year ended 31 August 2025; and Aramark Limited reported £367m turnover for the period ended 27 September 2024.
Hotels
The hotel-system estimates are deliberately rough because large global hotel groups often franchise, manage or licence hotel brands rather than own all UK hotels. The ways in which the industry is owned and managed are varied and complex. UK company accounts therefore do not capture systemwide taxable accommodation and food-and-beverage sales.
- IHG. Estimated at £109m, the midpoint of a £95m to £123m range. IHG reports 2025 total gross system revenue of $35.2bn. We apportion by rough UK hotel/room shares from IHG’s UK hotel count and global presence, convert at about £0.76/$, then divide by 11.
- Accor. Estimated at £78m on a rooms-only basis. Accor’s 2025 results report 326,977 rooms and €70 RevPAR in Europe and North Africa, and say the UK accounts for 12% of that region’s room revenue. That gives about £0.86bn of UK room revenue after conversion at about £0.86/€, and £0.86bn/11 is about £78m.
- Marriott. Estimated at £80m, the midpoint of a rough £60m to £100m range. Marriott’s UK destination page lists 157 UK hotels, but we did not find a clean UK system-sales disclosure, so the estimate assumes 140 to 170 rooms per hotel and £85 to £110 RevPAR.
- Hilton. Estimated at £65m, the midpoint of a rough £40m to £90m range. Hilton’s UK page lists its UK locations and brands, and trade reporting says Hilton has more than 200 operating and pipeline hotels across the UK and Ireland, but we did not find a clean UK operating-hotel count or system-sales disclosure.
We are cautiously assuming that Airbnb and similar accommodation platforms would not be in scope for the VAT cut on their platform fees. It should be practical to exclude Airbnb from this because it would not have obvious avoidance opportunities; in contrast with food delivery platforms, Airbnb hosts usually cannot reclaim VAT.
Other named sources and omissions
For the other named estimates, the main public sources are: the KFC 60th anniversary report, Yum’s 2025 Form 10-K and Propel’s KFC UK reporting; Whitbread annual reports; Mitchells & Butlers FY2025 results; Morning Advertiser reporting on Greene King; J D Wetherspoon preliminary results; Guardian reporting on Greggs; MCA Insight reporting on Stonegate; Domino’s 2025 annual report; Starbucks UK accounts; Yahoo Finance reporting on Nando’s; Endole’s Costa turnover data and World Coffee Portal’s Costa estate reporting; Travelodge 2025 results; and Burger King UK reporting from Restaurant Online and The Independent.
Major omitted groups and channels include Center Parcs, Butlin’s, Haven, other holiday parks, SSP and airport/station caterers, CH&CO and other contract caterers, PizzaExpress, Pret, Subway franchisees, Popeyes, Wingstop, Tortilla, Loungers, Fuller Smith & Turner, Young’s, Marston’s, Punch, Admiral Taverns, private-equity-backed franchise operators and large regional groups. Propel’s Top 500 material says its Top 500 hospitality operators generate more than £30bn in turnover across 51,000 sites.
We are also excluding serviced apartments, because they don’t seem to be intended to benefit from the proposed VAT cut. The boundary between a serviced apartment and a hotel can be extremely fine and (as we have said) it would likely be exploited.
The bang-for-buck chart
The chart uses the same framework as our Reform UK overtime tax analysis: annual whole-economy GDP benefit per pound of annual fiscal cost.
For the hospitality VAT proposal, we use the midpoint of the article’s £12bn to £14bn annual cost range: £13bn. We then use a generous sustained whole-economy GDP benefit range of £0bn to £0.5bn a year, and take the top end of that for the chart. That gives £0.5bn/£13bn = 3.8p, rounded to 4p of GDP per £1 of tax cut.
This is much lower than a simple hospitality-sales calculation. A lower VAT rate could increase hospitality sales if some of the tax cut is passed through to prices. But much of that extra pub, restaurant and hotel spending would be displaced from supermarkets, retail, leisure, domestic holidays, foreign holidays, savings or other household spending. That can increase the size of the hospitality sector without increasing the size of the UK economy.
This is the logic behind the OBR’s treatment of tax policy. The OBR’s dynamic scoring explainer distinguishes direct behavioural effects, temporary aggregate-demand effects and durable supply-side effects. Its current generic tax multiplier is only 0.33 in year 0, then 0.30, 0.23, 0.14, 0.05 and zero by year 5. Durable supply-side effects are included only where evidence suggests a significant, additional and lasting effect on labour supply, capital or productivity.
The OBR’s older fiscal multipliers box used a similarly modest VAT impact multiplier of 0.35 and assumed the effect would taper over five years as monetary policy, the exchange rate and real wages adjusted. The OBR’s policy-costings briefing paper makes the same distinction: scorecard costings include static and first-round behavioural effects, while wider macroeconomic effects are assessed at the level of material individual measures and the policy package as a whole.
The tax-design literature points the same way. The IFS-led Mirrlees Review favours a broad, largely uniform VAT base, and the IFS chapter on taxing goods and services says a uniform rate avoids distorting consumers’ choices between goods and services. That is why VAT is often regarded as a relatively efficient revenue-raising tax. But the implication cuts both ways: if a broad VAT is less economically damaging than many other taxes, then a narrow VAT cut is also less growth-enhancing than many other tax cuts. It mostly changes relative prices and sectoral allocation.
Our £0.5bn upper-end estimate allows some benefit for avoided closures, tourism and short-run demand. It does not count spending moved from one part of the economy to another as net GDP. It is also not a reduction in the Exchequer cost estimate: the tax cut still has to be financed, and the financing also has economic effects.
Why business-rates reform is not in the chart
We have not put business-rates reform in the chart because of the difficulty of coming up with a simple figure.
A simple business-rates cut is not the right comparator because much of the long-run benefit is likely to be passed through to landlords. Proper reform may well have a GDP benefit, but only if it fixes the structure: frequent revaluations, liabilities that track real rents, and less punishment for investment. We have not found a credible published GDP estimate for that package, and producing one is beyond the scope of this analysis.
The incidence point is central. The IFS submission to the Treasury Committee on business rates says evidence suggests a significant share of business-rates changes is capitalised into rents over time. It cites work by Bond and others, and Cambridge Econometrics work on Enterprise Zones, as evidence that reliefs can accrue largely to property owners rather than occupiers. That is why we do not treat a simple business-rates cut as a high-GDP tax cut.
The better case is structural reform. Centre for Cities recommends annual revaluations, better rent evidence including discounts and incentives, partial landlord liability, and removing plant and machinery from valuations. It also identifies the real-world problem of liabilities remaining high after rents have fallen. The IFS/Mirrlees chapter on taxation of land and property makes the underlying economic point: taxing land is efficient, but taxing buildings and improvements can deter investment.
There are some adjacent estimates, but none gives the chart-ready number we would need for a package of frequent revaluations plus rent-linked liability. A 2025 British Property Federation/EY report models a £100m business-rates cut, explicitly allowing rents to adjust after three years, and estimates £88m of first-year GVA and £774m cumulative GVA over ten years. But it is a property-sector commissioned input-output exercise and models a cut, not full reform.
A 2025 BT report uses an OBR cost-of-capital framework to argue that a higher large-property multiplier would reduce investment and potential output, but again that is not an estimate of a pro-growth reform package. Academic work on business-rates reliefs is also cautionary rather than conclusive: Gobey and Matikonis find small-business property tax relief did not increase job growth, and their later productivity paper finds reductions in business property taxes were associated with lower productivity growth.
Our conclusion is narrow: serious business-rates reform may be a better-targeted response to a property-cost problem than VAT relief, but we have not seen robust modelling of its net GDP effect.
We also haven’t included minimum wage in the chart because whilst changes to the minimum wage may well have growth effects, they are outside our expertise as tax and tax policy specialists.
Many thanks to T for help with the modelling, and to B, O and L for the benefit of their VAT expertise. Thanks to M for the discussion which prompted this report.
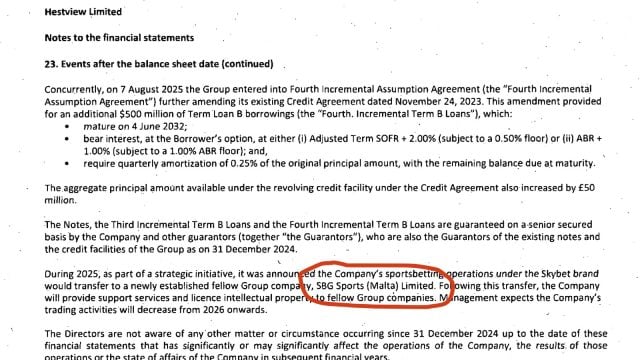
Betting on tax avoidance – is Sky Bet avoiding £55m tax per year?
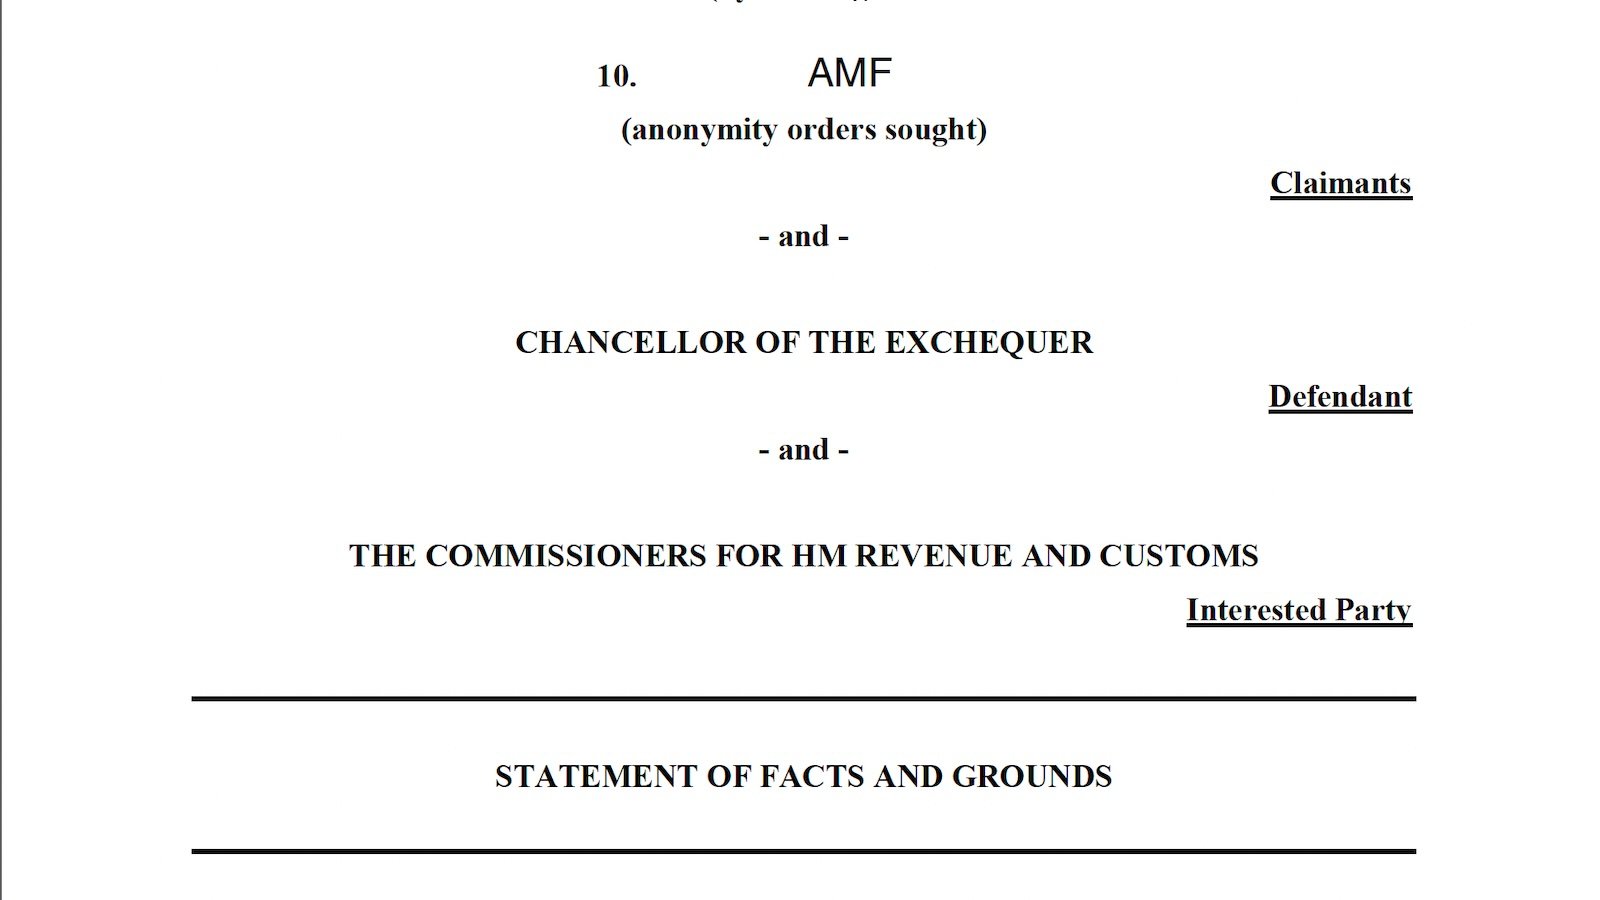
The private school VAT challenge: weak arguments, but radical consequences
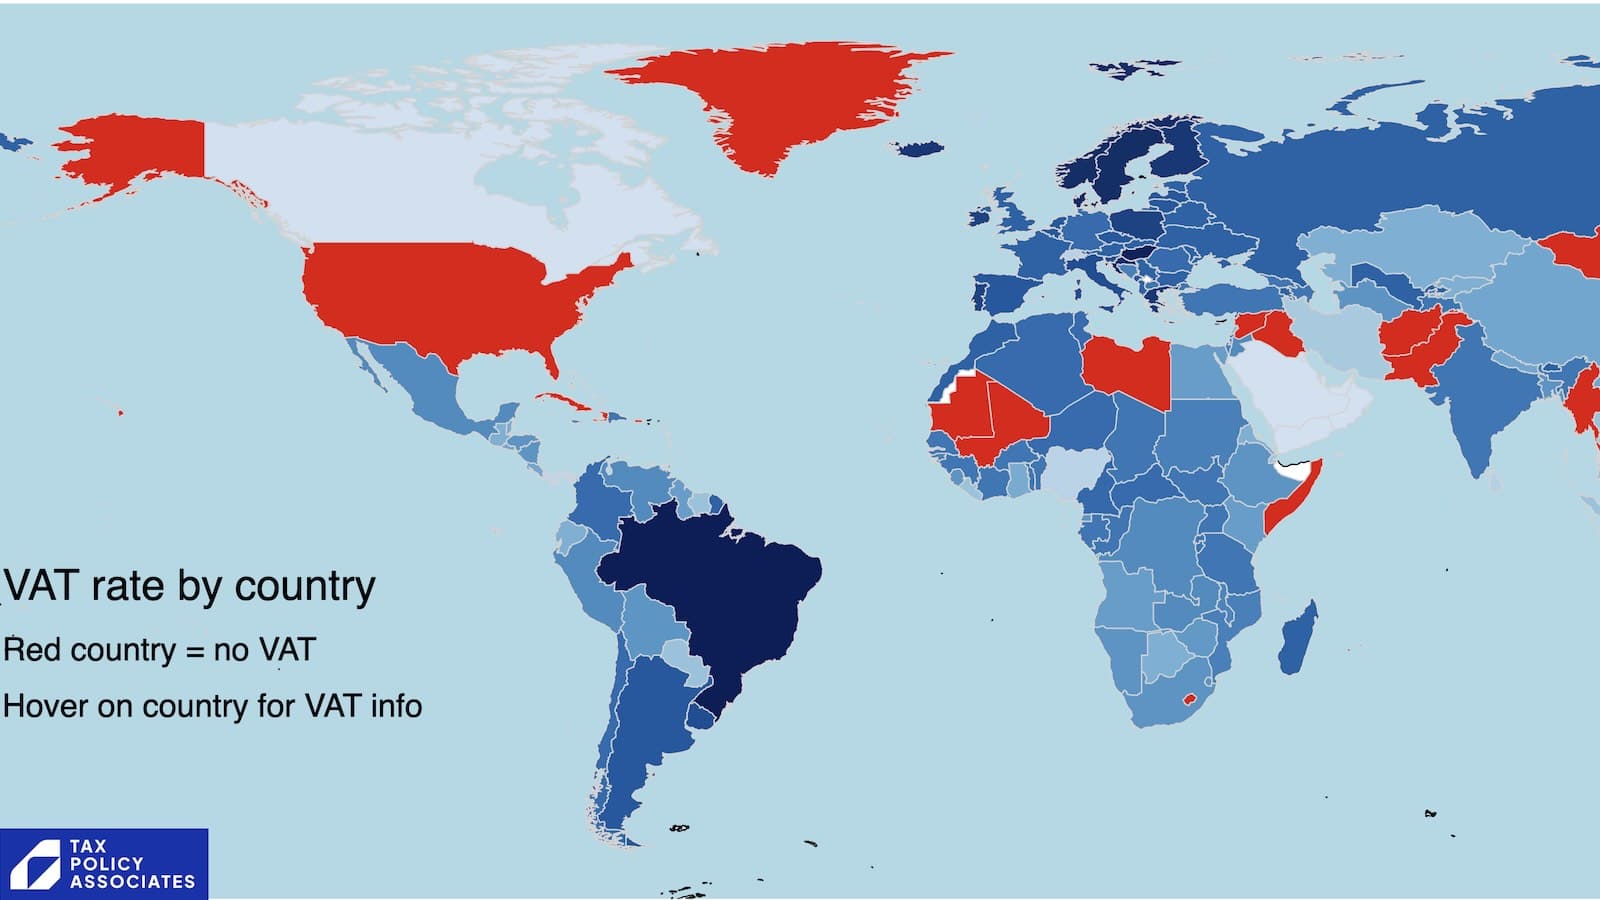
No, VAT isn’t a tariff – here’s what Trump (and others) get wrong

How the Independent Schools Council created a misleading headline on VAT

Avoiding VAT on school fees – the risks parents and schools are taking
The loophole that enables secret lobbying by foreign companies
Footnotes
We reviewed the campaign website, toolkit and trade materials, including UKHospitality, BII, CODE Hospitality and press coverage. The campaign reported 100,000 signatures in under 72 hours; it’s currently at over 200,000 signatures. There are additional petitions on the UK Parliament website. ↩︎
This 45% is the share of hospitality businesses that are not registered for VAT, and so would see no direct benefit from a cut in the VAT rate. DBT’s 2025 Business Population Estimates, Table 5, for SIC Section I (Accommodation and Food Service Activities) record 233,080 hospitality businesses, of which 60,670 are zero-employee unregistered businesses that by definition are not VAT-registered. Of the remaining 172,410, DBT counts businesses registered for VAT and/or PAYE, whereas HMRC’s Annual UK VAT statistics record only 128,500 active VAT-registered traders in the sector. The gap of about 43,900 businesses is consistent with micro firms that are PAYE-registered, because they employ staff, but below the £90k VAT-registration threshold. Adding the 60,670 unregistered to the roughly 43,900 below-threshold businesses gives about 104,600 businesses, around 45% of the 233,080 total, with no VAT to cut. They will probably all be micro businesses of nine employees or fewer. ↩︎
The chart compares the recent cost shock from minimum wage, employer NICs and business rates with the VAT-cut benefit. The micro-business example has £89,000 of turnover and four adult part-time workers, so it is hit by the minimum-wage increase but receives no VAT benefit because it is below the VAT threshold. The small-business example has £600,000 of VAT-inclusive sales, ten adult minimum-wage employees and a £40,000 rateable-value premises; its wage, NIC and rates shock is about £20,000, while the VAT benefit is £600,000 x (20/120 – 10/110) = £45,455. Wetherspoon reported FY2025 sales of £2.1275bn and said National Insurance and labour-rate increases would cost about £60m a year; we add an indicative £2.8m business-rates increase, giving a modelled cost shock of about £63m. The VAT benefit is £2.1275bn/11 = £193.4m. Full assumptions and calculations are in the methodology annex below. ↩︎
The examples here are more than speculation – we spoke to lawyers and accountants who advise businesses at the existing margins. The existing food and catering rules already show businesses and HMRC fighting over product design, marketing, packaging, heating, seating and consumer use. HMRC’s Catering and takeaway food notice says supermarket seating areas can be “premises”, and that cold food sold by a business with on-site facilities has to be apportioned between on-premises consumption and takeaway. HMRC’s hot takeaway manual gives the pasty example: a pasty baked and left to cool naturally can be zero-rated, but the same pasty kept under heat lamps, put in heat-retentive packaging or marketed as “hot” becomes standard-rated. The Subway/Sub One litigation concerned whether toasted sandwiches were zero-rated food or standard-rated hot takeaway/catering; HMRC records that the Court of Appeal dismissed the taxpayer’s arguments. In Procter & Gamble/Pringles, the VAT treatment of Pringles turned on ingredients, similarity to potato crisps and product characteristics; HMRC also records a Pringles Dipper product, designed for dipping, which the tribunal held zero-rated. HMRC’s Innocent smoothies guidance records the taxpayer arguing that smoothies were “liquefied fruit salad” rather than beverages; the tribunal considered how, where, when and why they were consumed. In HMRC v Innovative Bites, the Mega Marshmallows dispute involved marketing, packaging, product size, supermarket positioning and seasonal sales; the assessments were £472,928. In WM Morrison Supermarkets v HMRC, Morrisons sought repayment of VAT on Organix and Nakd bars, arguing they were not standard-rated confectionery; the disputed repayments included just over £1m for “Nakd” bars and £97,000 for “Organix” bars. And there’s a long-running cake/biscuit/flapjack boundary, including Jaffa cakes, traditional flapjacks, marshmallow teacakes and related cases. ↩︎
“Deadweight” because the benefit of a VAT cut goes to everyone, not just the people who actually needed it. ↩︎
The case against sector-specific and reduced VAT rates is unusually broad across the political spectrum. On the progressive left, the classic starting point is Anthony Atkinson and Joseph Stiglitz’s “The Design of Tax Structure: Direct Versus Indirect Taxation”, which showed why, where redistribution can be done through the direct tax system, there is generally no good case for trying to achieve it through differentiated taxes on particular goods and services. More recently, work associated with the IFS, ODI, the Commitment to Equity Institute and the World Bank — Ross Warwick, Tom Harris, David Phillips, Maya Goldman, Jon Jellema, Gabriela Inchauste and Karolina Goraus, “The redistributive power of cash transfers vs VAT exemptions” — finds that preferential VAT rates are expensive and poorly targeted, with richer households benefiting most in cash terms, and that recycling revenue through universal or cash transfers can do more for poverty and inequality. Rita de la Feria and Artur Świstak make a similar progressive case in “Designing a Progressive VAT”: keep a single-rate, broad-base VAT, but repay VAT to lower-income households rather than using exemptions and reduced rates. The Resolution Foundation similarly argues for base-broadening tax reform and consistency across tax rates, with the proceeds used for progressive objectives such as child poverty reduction. The IFS-led Mirrlees Review (“Tax by Design”) argues for a broad, uniform VAT base, with redistribution delivered through the income tax and benefit system rather than through reduced VAT rates. The OECD’s “The Distributional Effects of Consumption Taxes in OECD Countries” finds reduced VAT rates are a poor and badly targeted instrument, often giving at least as much cash benefit to richer households as to poorer ones. The IMF reaches similar conclusions on pass-through and targeting in “Estimating VAT Pass Through” (Benedek, de Mooij, Keen and Wingender, 2015). On the free-market right, the Adam Smith Institute argues for widening the VAT base and scrapping exemptions and zero rates, and the Tax Foundation favours a broad base and a single rate. The World Bank and the European Parliament’s research service reach the same conclusion. All these groups and individuals disagree about the overall size of the state. But they all agree that carving a single sector out of the standard VAT rate is bad policy. ↩︎
Other sector changes include energy price rises, alcohol duty changes, the Tips Act from 1 October 2024 and forthcoming employment rights reforms; these matter, but wages, NICs and rates are the quantified core of the 2025 cost shock. ↩︎
UKHospitality’s April 2025 estimate is here. It decomposes the annual increase into £1.9bn of wage costs, £1bn of employer National Insurance contributions and £500m of business rates. It also said seven in ten hospitality businesses would have to reduce employment levels, a third would reduce trading hours and 15% believed they would have to close at least one site. We treat this as industry evidence, not official statistics, but our sense-check suggests the broad order of magnitude is reasonable. First, we uprate the £3.4bn to 2026/27 terms using the OBR’s March 2026 GDP deflator forecast: the OBR says GDP deflator growth is expected to slow to 2.2% in 2026. £3.4bn multiplied by 1.022 is £3.47bn, which we round to £3.5bn. Secondly, the wage number is supported by official payroll data. The ONS/HMRC PAYE RTI seasonally adjusted dataset, sheet 26, shows aggregate pay in accommodation and food services of about £44.01bn in April 2024 to March 2025 and about £45.88bn in April 2025 to March 2026: an increase of about £1.87bn, close to UKHospitality’s £1.9bn wage figure. This is useful, but not a perfect policy-only counterfactual, because it includes ordinary wage drift, changes in hours, workforce composition, bonuses and behaviour. Thirdly, the NIC figure is plausible but more model-dependent. The April 2025 change increased the employer NIC rate from 13.8% to 15%, reduced the ordinary secondary threshold from £9,100 to £5,000 and increased the Employment Allowance to £10,500, per GOV.UK. UKHospitality separately said that more than 774,000 hospitality workers would be newly brought into employer NICs. That is broadly consistent with HMRC payrolled-employments data: in April 2025 accommodation and food service had about 181,600 under-18 payrolled employments and 667,400 aged 18 to 24; treating roughly three-sevenths of the 18-24 group as aged 18-20 gives about 468,000 under-21 employments, close to UKHospitality’s “just over 450,000” post-change exempt group. The Resolution Foundation’s 2025 analysis says the Employment Allowance fully offsets the NIC rise for only 8% of low-paid workers overall, so it does not obviously invalidate a large sector estimate. Fourthly, the business-rates figure is plausible but least independently verifiable. The 2024/25 RHL guidance says the 75% retail, hospitality and leisure relief was worth an estimated £2.4bn, and the 2025/26 guidance says relief fell to 40%, capped at £110,000 per business. Public data does not appear to split the relief loss between retail, hospitality and leisure, so we cannot independently verify UKHospitality’s £0.5bn hospitality-only allocation. Overall: £3.5bn seems a justifiable figure, but we wouldn’t regard it as definitive without further independent work. ↩︎
The House of Lords Library briefing says hospitality had about 2.1m payrolled employees in November 2025, down about 59,000 from November 2024; 77,000 vacancies in food and accommodation in September to November 2025; median hourly full-time pay of £14.04 compared with £19.67 for all UK full-time workers; economic output of £69.5bn in 2023, around 2.8% of UK output; and 21.6% of hospitality workers paid the minimum wage in 2023/24. The IFS estimated hospitality employer costs increased by 7.7% nominal between 2024 and 2025, compared with 6.4% across the whole economy, and said hospitality employs 28% of all 18-20-year-olds and that workers aged 20 and below make up 24% of hospitality workers. The Resolution Foundation estimated the combined 2025 NIC/minimum wage shock increased the labour cost of a part-time adult minimum-wage worker by 14.2% and judged the overall employment effect at around 80,000 fewer jobs across the economy. It also said only 8% of low-paid workers work for employers where the Employment Allowance changes fully offset higher employer NICs. ↩︎
In part because, as discussed above, changes in VAT rates tend to just switch spending from one product/service to another. In part, it’s the deadweight problem. Much of the benefit of the VAT cut goes to people who were already going to restaurants, pubs and hotels. Only the extra spending caused by the price cut is non-deadweight – and that will be small. ↩︎
There is a general reason to be sceptical that VAT cuts are passed through to consumers. The IMF paper by Benedek, de Mooij, Keen and Wingender on estimating VAT pass-through and the NBER paper by Benzarti, Carloni, Harju and Kosonen on asymmetric VAT incidence both point in that direction, particularly for narrow VAT cuts. ↩︎
This is a point our team had not come across but was identified by John Paddington on BlueSky. It’s a rather unintuitive point, but in principle it means VAT cuts increase costs for some businesses. Businesses, of course purchase catering and hotel rooms – so this point will have a real effect. In theory, businesses (particularly large ones) ought to be able to negotiate discounts to take them back to how they were. We’d love to see someone look into this issue further. ↩︎
The French sit-down restaurant cut is the closest real-world precedent to a permanent hospitality reduced rate, and it was studied closely. Youssef Benzarti and Dorian Carloni, “Who Really Benefits from Consumption Tax Cuts? Evidence from a Large VAT Reform in France” (American Economic Journal: Economic Policy, 2019; AEA listing), find the reduction from 19.6% to 5.5% was largely retained by restaurant owners rather than passed to diners. The Institut des politiques publiques summary, “Who benefited from the July 2009 sit-down restaurant value-added tax cuts?”, reports that prices fell by about 1.9% thirty months after the cut; that restaurant owners pocketed around 56% of the tax cut, with profits up about 24%; that employees received about 18.6% and suppliers about 12.1%; and that prices rose four to five times more after the later 2012 and 2014 VAT increases than they had fallen after the cut. That asymmetry between cuts and rises is the subject of Benzarti, Carloni, Harju and Kosonen, “What Goes Up May Not Come Down: Asymmetric Incidence of Value-Added Taxes” (NBER, 2017). A 20% to 10% UK cut is smaller than the French cut, but the direction of the evidence is the same: most of the money is retained, and little reaches consumers. ↩︎
Our source for this is someone present at the event. ↩︎
What happens next is an incidence question. The legal recipient is the business charging VAT. If prices are unchanged, the first-round cash benefit is retained by that business. The ultimate economic benefit may then be divided through commercial contracts and market power: lenders benefit if debt service improves; landlords benefit if rent arrears are cleared or future rent pressure eases; shareholders or private-equity owners benefit through higher enterprise values; franchisees, franchisors and master franchisees share gains according to royalty and rent structures; staff may benefit if some saving funds wages or prevents redundancies; suppliers may benefit if venues absorb food and energy inflation rather than forcing price concessions. ↩︎
As the European Commission reduced-rates study put it, small VAT effects can “drown” in the many other factors moving prices. ↩︎
See Dora Benedek, Ruud de Mooij, Michael Keen and Philippe Wingender, Estimating VAT Pass Through, IMF Working Paper 15/214, which uses monthly data and finds reduced-rate pass-through around 30% on average; Youssef Benzarti and Dorian Carloni, Who Really Benefits from Consumption Tax Cuts? Evidence from a Large VAT Reform in France, AEJ: Economic Policy 2019, finding that French restaurant owners captured more than 55% of the VAT cut; and Copenhagen Economics for the European Commission, Study on reduced VAT applied to goods and services in the Member States of the European Union, 2007, pp. 40-42, discussing long-run pass-through, industry differences, and the difficulty of measuring small VAT effects against other price movements. ↩︎
If a customer pays £100 today, £16.67 is VAT and £83.33 goes to the business. At 10% VAT, if the customer still pays £100, the VAT is £9.09 and the business keeps £90.91.
In other words: if prices do not fall, the business keeps an extra £7.58 on every £100 of VAT-inclusive sales. Each additional £1bn of VAT-inclusive spend moved from the 20% category into the 10% category costs about £75.8m a year. ↩︎
This would not be a simple change. The 2026 temporary 5% summer VAT cut for children’s meals and attractions is a small preview. HMRC had to define qualifying children’s meals by how they are marketed, presented and priced, and then exclude smaller adult portions, discounted adult meals, shared meals and takeaway meals. HMRC’s Revenue and Customs Brief 5 (2026) applies a temporary reduced rate from 25 June to 1 September 2026 to children’s meals, children’s tickets and certain attractions. It says whether a meal qualifies depends on how it is marketed, presented and priced, and excludes smaller portions, discounted adult meals, shared meals and takeaway meals. A permanent 10% hospitality rate would be larger, more valuable and open-ended, so the boundary pressure would be much greater. ↩︎
The current UK system already has difficult boundaries between zero-rated retail food, standard-rated catering, hot takeaway food, confectionery, alcohol, mixed supplies and premises-based consumption. A permanent 10% hospitality rate creates a three-rate food world: zero-rated retail food at 0%; reduced-rate hospitality food at 10%; and standard-rated food, drink, alcohol and edge cases at 20%. ↩︎
HMRC’s Food products VAT Notice 701/14, which says most food is zero-rated but there are exceptions, and that food supplied in the course of catering, including hot takeaway food, is standard-rated; HMRC’s Catering and takeaway food VAT Notice 709/1, which requires apportionment evidence where premises sell cold food both for takeaway and on-site consumption; HMRC’s bakery guidance in Notice 701/14, which distinguishes bread, biscuits, cakes and confectionery and lists Jaffa cakes as zero-rated; HMRC internal manual VFOOD6260, which discusses Jaffa Cakes and says there is no generally accepted definition of cake or biscuit; HMRC internal manual VFOOD4320, which discusses Subway and toasted sandwich litigation; and the Supreme Court case page for Mega Marshmallows, where permission to appeal was refused in 2025 in a dispute about whether large marshmallows were confectionery. The Office of Tax Simplification’s VAT routes to simplification identified multiple VAT rates, zero rates and exemptions as sources of complexity and used examples including Jaffa Cakes, eating in/out on the same sandwich and gingerbread-man chocolate decoration. ↩︎
Likely pressure points include: food retail versus catering; events, tickets, admission, catering and venue hire; accommodation plus extras; serviced apartments, short lets and mixed accommodation packages; retail goods or services sold as part of “experience” or hospitality packages. Practical redesign examples include supermarkets and convenience stores adding seating, heating, table service, loyalty-club “meal experiences” or café bundles; bakeries and sandwich shops adjusting hot/cold, eat-in/takeaway and menu presentation; retailers bundling café credit, food hall access, demonstrations or tasting sessions into product sales; attractions and events bundling admissions with meals, drinks, hospitality suites or “experience” packages; accommodation providers and serviced apartments emphasising hospitality services rather than property rental; and employers and caterers restructuring workplace food contracts. This creates litigation risk and ordinary compliance work: tills, menus, invoices, contracts, package pricing, staff training and VAT return coding. ↩︎
We use DBT’s 2025 Business Population Estimates, Table 5, for SIC Section I, “Accommodation and Food Service Activities”, as a first-pass proxy. The methodology annex below gives the raw split and caveats. ↩︎
The campaign has not defined exactly what is covered. Excluding platform commission and delivery fees would create complications and avoidance opportunities that would be hard to deal with; we therefore assume they are within the 10% rate. Treating contract catering differently from consumer-facing catering would create similar boundary problems, so we assume it benefits from the cut. Detailed calculations and caveats are in the methodology annex below. ↩︎
More precisely: VAT is generally seen as less harmful to growth than income/corporate taxes. A good starting point is the OECD’s paper Taxation and Economic Growth, which sets out a hierarchy of taxes for growth: corporate taxes are the most harmful, followed by personal income taxes, and then consumption taxes, with recurrent property taxes least harmful. The IMF says in Efficiency Aspects of the Value Added Tax that a well-designed VAT can raise revenue with relatively limited distortions, and describes VAT as a highly efficient revenue-raising tool, whilst warning against using it for industrial policy or other non-revenue objectives. A further IMF paper, The Value Added Tax and Growth: Design Matters, makes the same point in a more nuanced way: VAT is most growth-friendly when revenue is raised through base-broadening and improved C-efficiency, rather than by increasing the standard rate, and where VAT revenue is used to reduce more distortive taxes such as income taxes. The Mirrlees Review/IFS case for VAT reform was not that VAT is perfect, but that a broader and more uniform VAT base would distort consumer choices less; the IFS chapter Broadening the VAT Base says that broadening the VAT base can generate an efficiency gain by reducing distortions between taxed and untaxed consumption. This view is also common across the political spectrum: the Adam Smith Institute describes VAT as “one of the least economically harmful taxes” because it taxes consumption rather than investment; the US Tax Foundation says in Consumption Tax vs. Income Tax that income taxes impose steeper economic costs than consumption taxes; and Brookings/Hamilton Project economists say in Raising Revenue with a Progressive Value-Added Tax that a VAT has efficiency advantages because it does not distort saving, investment or financial decisions. Almost everyone agrees that reduced rates, exemptions and thresholds make VAT worse. But that only strengthens the point here. The economic case for VAT is a case for broad, uniform VAT as a relatively efficient tax base. It is not a case for carving out a large sector-specific reduced rate and pretending the lost revenue creates free growth. ↩︎
In other words: a fiscal multiplier measures the extra domestic demand created when the state injects money into the economy. But if a hospitality VAT cut is funded by higher domestic taxes, lower domestic spending, or borrowing that later has to be serviced by higher domestic taxes or lower domestic spending, then the policy is mostly shifting purchasing power from one multiplier-bearing activity to another. The OBR’s own multiplier framework assumes that VAT changes have a short-run multiplier, but also that ordinary public spending, welfare spending and investment have multipliers too — indeed the OBR’s 2010 framework used larger impact multipliers for investment and day-to-day public spending than for VAT. That is why the relevant question is not “does hospitality spending have a multiplier?” Of course it does. The question is whether moving several billion pounds from the rest of the economy into hospitality creates a materially larger multiplier than the spending or taxation it displaces. There is little reason to think it would. The NIESR review of fiscal multipliers notes that government spending multipliers are generally larger than tax multipliers because spending enters output directly, while tax cuts work only indirectly through household income, with some of the gain saved rather than spent. The ODI review of the fiscal multiplier literature makes the same basic distinction: public investment and consumption directly add to aggregate demand, while transfers and tax cuts affect output only through what households and firms then choose to do. And, in the specific case of a VAT cut, the mechanism is even weaker unless the cut is passed through into lower prices. The IFS’s discussion of temporary VAT cuts says they are most effective only when firms can meet extra demand, consumers are willing to spend, and businesses pass the cut on to prices; empirical evidence from the UK’s 2020 hospitality VAT cut found only partial and short-lived pass-through to hotel prices, around 20% to 50%, while the ONS found that the effect of the VAT reduction on restaurant prices was small compared with Eat Out to Help Out (and in this case, the main spokesman for the VAT cut has said the industry should not pass on the benefit). So the case for a hospitality VAT cut as a growth policy depends on a very specific proposition: that the money used to fund it would otherwise have gone somewhere with little or no domestic multiplier. There are examples of that — the cleanest is debt interest paid to overseas gilt-holders, which is a leakage from UK demand; the OBR says debt interest is now over £100bn a year, and the Commons Library says around a third of gilts are held overseas. But that is the exception, not the rule – and obviously there is no way to magically reduce debt interest and use it to fund a VAT cut. Most UK government spending is wages, procurement, welfare, pensions, health, education, defence or investment — all of which have some domestic multiplier. A hospitality VAT cut therefore should not be presented as creating growth; at best, it reallocates demand towards hospitality, at very high fiscal cost, and only produces net growth if the activity it displaces had a materially lower multiplier, which is unlikely. ↩︎
The European Parliament 2021 study says concrete empirical estimates are scarce, but multiple VAT rates create compliance costs and incentives to exploit rate differences. The World Bank 2024 paper says the case for reduced VAT rates is weak and that simplification would reduce administrative and compliance costs and opportunities for abuse. CIOT’s stated aim in a VAT consultation response includes achieving a more efficient and less complex tax system. A permanent hospitality reduced rate moves in the opposite direction. The precedent cost is not only fiscal. It creates a durable lobbying template: identify a sympathetic sector, argue social value and job intensity, then seek a reduced VAT rate rather than direct, transparent spending support. A three-rate food world would also likely increase compliance costs most for small businesses, because large chains can invest in tax advice, product design, till systems and contract restructuring. ↩︎
OECD, Consumption Tax Trends 2024, chapter 2: “Tourism is also a sector that benefits from reduced rates in most OECD countries”; hotel accommodation is reduced-rated in 26 out of 37 VAT countries, and restaurant services in 17 countries. The OECD also notes that several pandemic-era restaurant/hotel VAT cuts “do not appear to have had a statistically significant impact on consumer spending in these sectors”. ↩︎
The Office for Budget Responsibility says only around half of household expenditure is subject to the 20% standard rate, with around 2.5% taxed at the 5% reduced rate and large areas zero-rated or exempt. VAT forecast methodology: “The standard rate of VAT is 20 per cent, with around half of household expenditure subject to this rate”; “around 2.5 per cent of expenditure is taxed at this reduced rate”; other goods and services, including books, newspapers, children’s clothing and many foods, attract no VAT because they are exempt or zero-rated. ↩︎
Professor Rita de la Feria and Michael Walpole have described an “overwhelming body of legal and economic evidence” against multiple VAT rates: they create legal difficulties, economic distortions, and uncertain social or distributional benefits. Their explanation of the European experience is the opposite of the lobby’s argument. Europe has many reduced rates not because they work well, but because old VAT systems inherited political compromises which then became very hard to remove. See The Impact of Public Perceptions on General Consumption Taxes, pp. 1-2. The paper says that European attempts to reduce rate differentiation and broaden the base have met “significant resistance”, with more goods and services subject to reduced rates than fifteen years earlier. In another paper, Blueprint for Reform of VAT Rates in Europe, de la Feria says UK food cases are “particularly telling”; treating competing products differently creates distortions; reduced VAT rates “erode the tax base” and may “subsidise inefficient production”; and it is unclear whether they achieve their stated social and distributional objectives. ↩︎
Our calculation from OECD Revenue Statistics VAT revenue data, accessed via DB.Nomics, OECD VAT/GST rates, and World Bank indicator NE.CON.TOTL.ZS, “Final consumption expenditure (% of GDP)”. Formula: (VAT revenue as % of GDP / standard VAT rate) / total final consumption as % of GDP. The “UK with hosp. cut” row subtracts a £12bn annual cost from UK VAT receipts, converts that into a standard-rate-equivalent base reduction using the 20% standard rate, and applies the same 2022 GDP and final-consumption denominator. The United States is excluded because it has no federal VAT. Canada is excluded from the chart because the OECD standard rate is the 5% federal GST while VAT-style revenue includes harmonised/provincial systems, making simple division misleading. This is a rough standard-rate-equivalent measure, not the OECD VAT Revenue Ratio; tourism, public-sector purchases, input taxation in exempt sectors, GDP denominators and reduced-rate mixes affect comparisons. An earlier version of this chart used household and NPISH final consumption expenditure as the denominator. On reflection, we think total final consumption is clearer, because VAT/GST also bears on public-sector and other non-household final consumption; the earlier denominator produced the odd-looking result that New Zealand’s broad GST base was 114.5% of household consumption. ↩︎
The OECD’s VAT Revenue Ratio, which compares actual VAT receipts with a broad-base standard-rate VAT on final consumption, puts the UK at 0.49 in 2022, below the OECD average of 0.58. Only nine OECD VAT countries were below 0.50. See Consumption Tax Trends 2024, Annex Table 2.A.7 and section 2.9. The VAT Revenue Ratio combines the effects of exemptions, reduced rates, fraud, evasion and planning. Our measure is different because it is a simple standard-rate-equivalent base calculation; it is useful for showing the scale of the tax base, but it is not a collection-efficiency measure. ↩︎
The people benefiting from narrow bases are disproportionately those on higher incomes. Reduced rates on essentials can be mildly progressive as a share of income or expenditure, but richer households still often receive as much, or more, cash benefit because they spend more. Reduced rates for non-essential sectors such as restaurants, hotels and cultural activities are worse: the OECD says they “clearly benefit richer households more than lower-income categories of the population, and often considerably so”. See OECD, Consumption Tax Trends 2024, section “Reduced VAT rates can have a high cost compared to their effectiveness”. See also World Bank, VAT Rate Structures in Theory and Practice (2024), which concludes that the case for reduced VAT rates is weak, that they are poorly targeted, and that targeted cash transfers should be preferred where available. ↩︎
The paper estimates pass-through of 50% for the 2011 cut, 6% for the 2020 cut (takeaway prices only), 88% for the 2019 increase, and 36% for the 2023 increase. ↩︎
At 20% VAT, a £100 VAT-inclusive customer bill contains £16.67 VAT. At 10%, the same £100 bill contains £9.09 VAT. If gross prices do not fall, the business keeps the £7.58 difference. That is 7.576% of VAT-inclusive sales, or 9.091% of VAT-exclusive sales. If accounts turnover is VAT-exclusive, the retained benefit is therefore turnover divided by 11. ↩︎
See the ONS Quarterly National Accounts dataset, current CSV file, series “11 Restaurants and hotels CP SA £m”. The current data file is available from ONS at Quarterly National Accounts current CSV. The 2025 annual figure in that series is £192,872m. This is not the same thing as the VAT policy base: it is a national accounts household-consumption category, not a VAT return extract. But it is a useful scale check. HMRC’s implied £139bn gross base is about 72% of that ONS restaurants-and-hotels consumption figure. That is plausible, because the ONS category is not identical to “currently standard-rated accommodation and food and beverage services”. It includes a broad national-accounts consumption category, while the VAT base has to exclude or adjust for items such as below-threshold businesses, existing zero-rated supplies, and classification differences.
Second, ONS business turnover data point in the same direction. The ONS Annual Business Survey reports 2024 turnover for SIC Section I, “Accommodation and food service activities”, of £135.9bn: £38.8bn in accommodation and £97.1bn in food and beverage service activities.36See ONS, Annual Business Survey, UK non-financial business economy, sections A-S, 2024 results, Table 13, Section I. The workbook gives Section I turnover of £135,863m in 2024, comprising accommodation, £38,811m, and food and beverage service activities, £97,052m. The ABS is a business survey of the non-financial business economy; it is not a VAT base model, and turnover by SIC section will not map exactly onto the supplies described in the Parliamentary answer. HMRC’s implied current VAT-exclusive base of about £115.5bn is about 85% of that ABS Section I turnover figure. Again, that is a credible order of magnitude: some Section I turnover will not be standard-rated output VAT, some businesses are below the VAT threshold, and some potentially in-scope catering or hospitality activity may sit outside Section I.
Third, the DBT Business Population Estimates give a similar check. DBT’s 2025 detailed tables put turnover in SIC Section I at about £145.3bn.37See DBT, Business population estimates for the UK and regions 2025, and the linked detailed tables, Table 5. The release says the estimates are broken down by industry, employee size band, legal status and geography, and that turnover data are provided to calculate shares of turnover across sectors. The detailed tables are available from GOV.UK as BPE 2025 detailed tables. HMRC’s implied VAT-exclusive base of £115.5bn is about 80% of that DBT turnover figure. That is consistent with a substantial but not total standard-rated VAT base within accommodation and food services.
So, whilst we cannot audit HMRC’s £10.5bn figure, we can say it is plausible.
The figure is incomplete
The £10.5bn covers “accommodation and food and beverage services”, because that was the scope of the Parliamentary question.
The scope of the exemption the industry demands is wider – “pubs, restaurants, cafes, hotels, bars, nightclubs, festivals and many more”.
It’s unclear quite how far this goes.
The whole ONS recreation and culture category is very large. The ONS records 2024 household expenditure on recreation and culture of £158.5bn. Applying the same 20%-to-10% VAT arithmetic to the whole category would produce an additional cost of about £12.0bn, taking the total to about £22.5bn before leakage.38ONS Consumer Trends, worksheet 09CN, 2024 annual data: recreation and culture, £158,522m. A 20%-to-10% VAT cut is worth 7.576% of current VAT-inclusive spend, so £158.522bn x 7.576% = about £12.0bn. ↩︎
- ↩︎
- ↩︎
It’s important to not add nightclub or festival food and drink sales into this – those should largely already be within HMRC’s “food and beverage services” base. Industry figures point the same way but are less clean for our purpose: UK Music’s Hometown Glory 2025 says 2024 music tourism direct spending included tickets, food/drink, travel, merchandise and accommodation, so it cannot be added wholesale without double-counting; IBISWorld’s Festivals in the UK page says festival revenue includes on-site services such as food and drink; and IBISWorld’s Nightclubs in the UK page puts nightclubs in SIC I56.301, reinforcing that much nightclub revenue is already beverage-service revenue rather than a separate admissions base. ↩︎
The original version of this report didn’t exclude these items – our apologies, and thanks to Leon Samuel Burton for identifying the error. ↩︎
Leave a Reply