
Mayors across England are to be given the power to charge a tourist tax on overnight stays, expected to be around 5%. It would apply to British and foreign visitors alike.12
The proposal has already generated competing claims about its impact. So we’ve built an independent, fully open model to answer three questions: how much will the tax raise, who will pay it, and what will it do to England’s hospitality industry? You can see exactly how the model works, change its assumptions, and test the results for yourself.3
Our central estimate is that a 5% tourist tax across England raises about £600m a year.4 We are reasonably confident in the overall revenue estimate: changing the behavioural assumptions makes surprisingly little difference to it. Trips by British tourists generate 63% of receipts in our central case, although the British/foreign split is less certain than the overall total.
The consequences for tourism are much harder to estimate. Our central assumptions imply about six million fewer nights in taxed accommodation and a fall of about £700m in gross visitor spending, of which about £400m is diverted abroad or no longer arrives. The remainder is (we expect) diverted to other spending in the UK. These numbers are much more speculative because they rest upon assumptions that are highly uncertain – how strongly visitors respond, whether they cancel or merely change their trips, and where their spending goes instead. They should therefore be treated as illustrative estimates, not precise forecasts. You can see directly in the model quite how sensitive it is to these assumptions, and substitute your own.
So whilst our model is informed by the considerable body of research into existing tourist taxes in Europe and the United States, we’ve tried to be explicit about every assumption we’ve made. That research shows diverse outcomes, some reflecting differences in the taxes, some reflecting differences in the tourist destinations, and some undoubtedly reflecting the difficulty and uncertainty inherent in this kind of work.
Combining our more cautious and more generous assumptions (reflected as the two illustrative presets in the model) gives receipts between £494m and £977m and lost spending between £46m and £1,550m. These are illustrative scenarios, not upper and lower limits.
Here’s the model – below that is a detailed explanation of why we think this is the correct approach, what the assumptions mean, and why we believe their starting points are appropriate.
These buttons jump to different sections of this report:
The proposed tax
The proposed tax is simple: a percentage of the accommodation bill per night. That’s different from many countries where the tax is a flat charge per night. The idea, of course, is to protect budget holidays.
The innovative element, for the UK at least, is that this is a tax entirely devolved to mayors and other local authorities, with the revenues retained locally.5 Whether to apply a tax and the rate of the tax is up to local mayors (or the new “foundation strategic authorities” in places without a mayor, such as the Cotswolds).6 There isn’t a cap7, and in theory the rate could be anything, but ministers expect it not to exceed 5%.
The tax would cover commercial visitor accommodation, with British and foreign tourists treated alike. Hotels, B&Bs, guesthouses and platform lets such as Airbnb are all in scope. Campsites, touring pitches and hostels can be exempted locally but are not exempt by default.8 Non-commercial accommodation would be outside the tax, with registered gypsy and traveller sites, temporary accommodation and charitable shelter given as examples. A threshold is also planned to keep occasional informal providers outside the tax.9
Calculating tourist tax revenues
Given that the tourist tax is a percentage of the accommodation bill, it should be simple to calculate the revenues. Just multiply the average rate by the total spent on accommodation by tourists staying in England.
The problem is that you can’t get the answer directly from any published statistics. There’s a domestic survey that asks people what they spent on accommodation and publishes a total, but doesn’t split by accommodation and region. There’s an overseas survey records the whole cost of the trip (without separating-out accommodation cost).10 The ONS Tourism Satellite Account then estimates spending by product using those surveys and other sources. Our estimate uses the surveys and the accounts and compares the result – but these aren’t independent data sources (and that has consequences we discuss later).
The first approach is what we use in our model – it builds up from the surveys:
- Each type of accommodation is given a share of trip spending (40% for a hotel stay, 45% for a rented cottage or flat, 30% for camping), set so that British visitors’ total accommodation spending reproduces the figure the Great Britain Tourism Survey publishes separately.11 The model lets you change these percentages.
- Overseas visitors are different: nearly half their nights are with friends or family, and shopping is a far bigger part of what they spend, so their shares are scaled to the Tourism Satellite Account, which puts their accommodation at 19.6% of what they spend in the UK.12
The second approach is best viewed as a limited sense-check on the first:
- We simply take the Tourism Satellite Account’s own figure for tourism consumption of accommodation.
- Then scale it to England, to 2024 volumes and to today’s prices.
- Then allow for accommodation excluded from the tax, either nationally or by local choice. We deduct 8%, but no source measures the right percentage, so we show a range: at 4% the accounts give £14.4bn and at 12% they give £13.2bn.13
Here’s the result:14
| How the liable accommodation bill is estimated | England, 2024 volumes, 2026 prices, incl VAT | Tax at 5% on a common basis |
|---|---|---|
| Built up from the visitor surveys (the model) | £14.5bn | £606m |
| Tourism Satellite Account, scaled to England | £13.2bn to £14.4bn | £548m to £598m |
Our survey figure sits between 1% and 10% above the accounts, and above them on any reading of that 8%. That gives some reassurance that our accommodation shares are not wildly wrong, though not much more than that.15
There are then two further adjustments we have to make. One of those is easy, and the other one is very difficult.
The easy one is VAT. The table above assumes every provider charges it, so every bill is divided by 1.2 before the tax is applied. That isn’t true for many Airbnb hosts and small B&Bs, whose whole bill is taxed, so allowing for them pushes receipts up. Our model lets you vary the share of the accommodation bill that carries VAT, with our central estimate at 85%.16
The difficult one is how tourists respond to the tax, the “behavioural response”.
If you tax something, you generally get less of it – so if we tax UK tourism, we can expect less UK tourism. But how much less?
There’s plenty of research on existing and historic hotel and short-let taxes, but it’s frustrating and limited in many respects. A complicating factor is that there are two families of study. One asks how many rooms get booked when the room price goes up.17 The other asks how visits or spending change when the whole cost of a trip goes up.18 The numbers in the second family look much bigger, but they get applied to a much smaller price change, because a 5% tax on the room is only about 1.5% of the cost of a trip. Our analysis in our model is therefore careful to distinguish the two families.
Our model starts with what we think is a defensible central estimate for the behavioural response, and lets you adjust it. Some evidence suggests local and foreign tourists don’t behave the same way, so the sliders in our model start at different values and let you adjust them separately.19
It matters a lot less than you might think. The modelled revenue changes only slightly, even with dramatic changes to the behavioural response.20 That’s because the reduction in tax caused by any reduction in visitor stays is much less than the amount that the tax raises. A tax that cuts demand by 2% still collects 98% of what it would have done.
We are, if you like, nowhere near the top of the Laffer curve. But the reduction in visitor stays is a very real effect with very real consequences, discussed below.21
The revenue figure changes much more when you change the accommodation share, because a larger share means a larger bill to tax.
How much does the tax raise prices for British tourists?
Our model’s central estimate is that, at a 5% rate, trips by British tourists generate £379m of receipts and trips by overseas tourists £224m.22 That’s 63% from trips by people who live here, which is a lot of domestic money for a tax being sold as a way to “raise money from the 42 million international visitors who came to the UK”.
Asked whether ministers had considered a version aimed only at international visitors, Number 10 refused to say. We expect they didn’t because a discriminatory tax would be problematic from a legal perspective, and burdensome to hotels from an administrative perspective.
Note: we say trips by British tourists are generating 63% of the revenue, not that 63% of the tax comes from British tourists. This is because hotels and other providers may have to cut their prices somewhat, i.e. absorbing some of the tax themselves. The “economic incidence” of the tax is, therefore, shared between tourists and providers. Our model starts with the assumption that three-quarters of the tax is passed on to visitors, but you can change this.
For an individual family the sums are modest, but not nothing. Take a room that would otherwise cost £100 a night, VAT included. If three quarters of a 5% tax is passed on to the customer, that’s £3.75 a night, or about £26 for a week.23 Whether that’s trivial or objectionable is a political question rather than an economic one.
What’s the impact on hotel businesses?
The impact is going to vary widely between different businesses, but it’s helpful to set out some illustrative examples.
The chart below looks at the impact of the tourist tax (in terms of both reduced income and absorbing some of the cost of the tax itself). It puts this in the context of recent increases in the minimum wage, employer national insurance and business rates. We construct three notional examples: a small B&B, a 20-room hotel and a large hotel chain. We believe they are fairly representative, but that involves subjective judgement on the part of our industry contacts and research team.24
The tourist tax would take about a quarter of starting profit in the two smaller examples and 11% in the chain:25
We would, therefore, hope that the government looks carefully at the impact on the smallest businesses. They’ve been largely protected from other recent changes (thanks to small business rate relief and the Employment Allowance), but face a significant hit to their (limited) profits from the tourism tax.26
It’s a challenging problem to solve. Any small-business relief needs careful design: a cliff-edge threshold could discourage growth and shift the burden onto otherwise similar competitors.27 One answer would be to give each business28 an allowance, with the first £1,000 (say) of the tourist tax it collects retained by the business and not paid across as tax. That avoids a cliff-edge and cushions the impact on small businesses. For some very small operators, it could more than offset the cost. Such an allowance could be expensive: an illustrative calculation puts the annual cost at around £100m if the tax applied throughout England, given the large number of second homes used for holiday lets.29 So it would make sense to restrict the allowance to actual hotels and B&Bs, not second homes/holiday lets.
The question is how to do that. One approach would be to restrict the allowance to properties assessed for business rates rather than council tax. That’s an existing test rather than a new one: a holiday let only enters the rating list if it’s available 140 days and actually let 70 days a year. Most of these properties pay no rates at all because of small business rate relief, but they are on the list, and it’s a good proxy for a commercial operation rather than an occasionally-let second home. It would reduce the cost by somewhere between about a third and a half.30
What’s the economic impact?
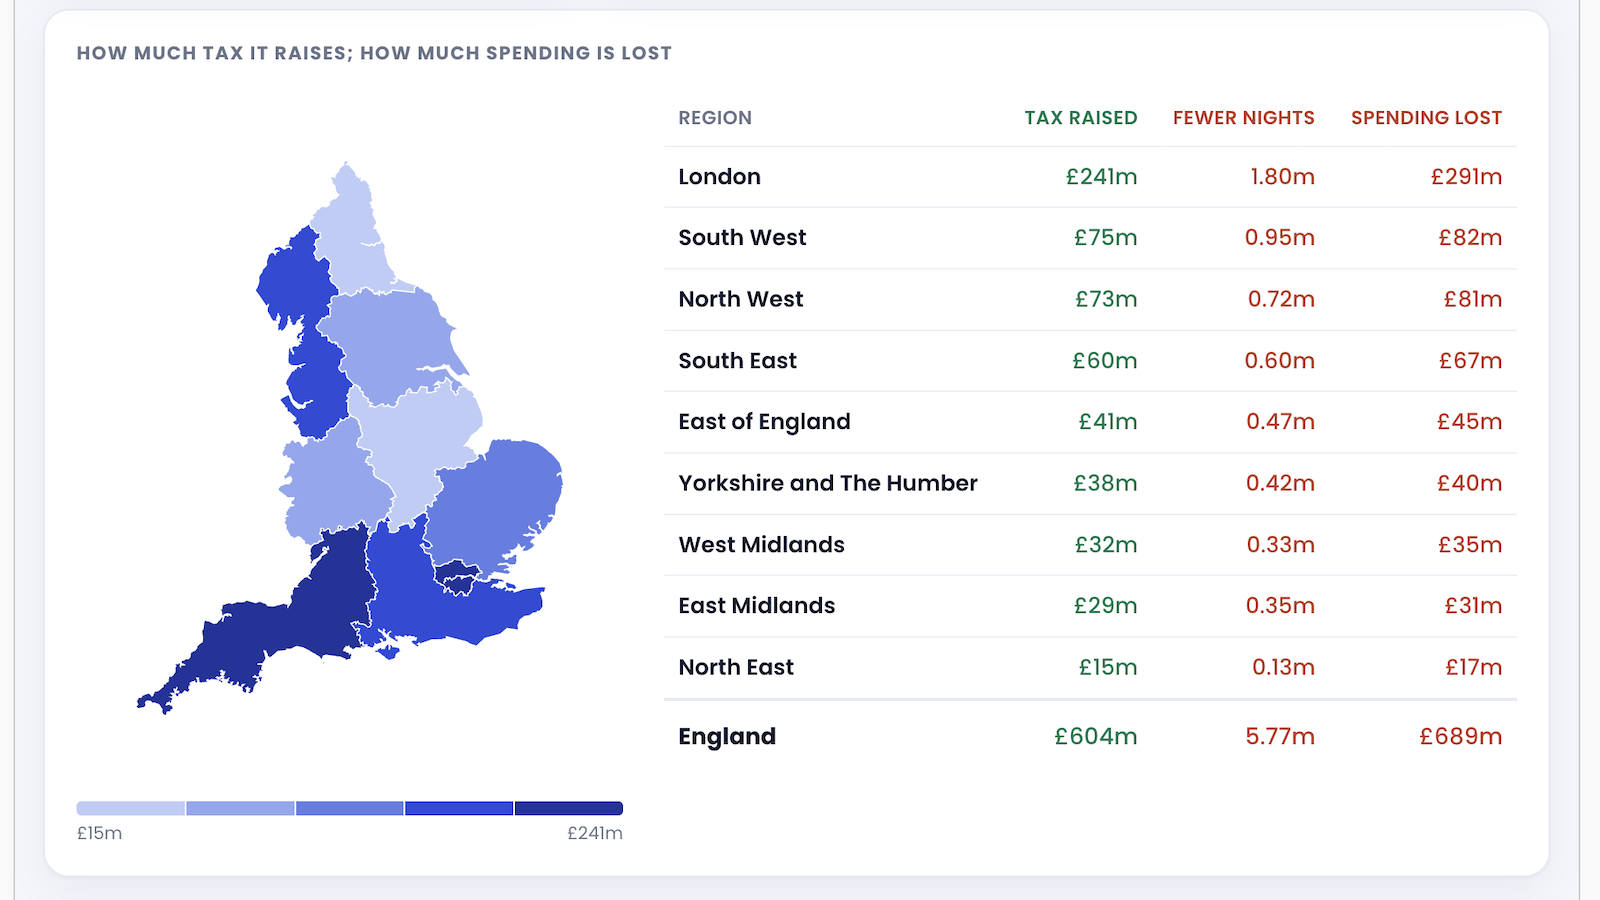
In our central scenario, a 5% tax raises £603m after visitors respond, and visitors book 5.8 million fewer nights in taxed accommodation, about 2% of the nights that would carry the tax. The spending that’s lost with those vanished nights is £689m (noting again that this is highly sensitive to the assumptions).
That’s a bigger number than the receipts, but it would be a category error to subtract one from the other and conclude that the tax loses money. The two numbers measure different things.
We think this is a better way to look at it.
| Central scenario, 2026 prices | Tax collected | Visitor spending displaced |
|---|---|---|
| Total | £603m | £689m |
| From trips by British tourists | £379m | £402m |
| From trips by overseas tourists | £224m | £287m |
| Of the displaced spending, leaves the UK | £387m | |
| Of the displaced spending, stays in the UK | £302m |
£287m is our modelled reduction in spending by overseas visitors in England, and we assume all of it is lost to the UK.31
£402m is our modelled reduction in spending on trips by British tourists in England. That money is lost to the businesses serving those trips, but some of it will appear elsewhere in the UK, whether in other hospitality businesses or in a different sector entirely. Some of that money will leave the UK as people take a holiday abroad instead. We assume a quarter of this deterred spending goes abroad, which gives £101m.32 Add that to the overseas spending that no longer arrives and the total diverted abroad or no longer arriving is £387m. The remaining £302m is displaced to other spending within Britain.
Given the approximations and assumptions, it’s best to use round numbers here and conclude that the loss to English tourism is around £700 million, of which about £400 million is diverted abroad or no longer arrives. It would be a bad mistake to use the £700m figure as an overall economic cost. The £400m is also gross spending, not a measure of lost GDP or the overall economic cost.33 And compared to the overall size of the UK economy, about £3.1 trillion, it’s a very small number.
These figures are highly dependent on how responsive visitors are to the price change. Here’s what happens when you use the different price elasticities found in the research:
| What the visitor reacts to | Price elasticity used | Tax raised | Visitor spending lost | Of which leaves the UK |
|---|---|---|---|---|
| The room price (our default) | −0.5 foreign, −0.625 British | £603m | £689m | £387m |
| The room price | −0.13 foreign, −0.1625 British | £613m | £179m | £101m |
| The room price | −0.7 foreign, −0.875 British | £598m | £964m | £542m |
| The whole trip | by purpose of visit | £610m | £426m | £200m |
| The whole trip | Peng, −1.489 for the destination | £602m | £940m | £460m |
Two things stand out from that table. The spending lost swings by a factor of five, from £179m to £964m. But (as we noted above) the tax raised barely moves at all, staying between £598m and £613m, because a tax that cuts demand by 2% still collects 98% of what it would have done. The argument about elasticities is an argument about the damage and not about the money.
Other published numbers
There are some other numbers being discussed in the public debate about the new tourist tax, and we thought it would be helpful to summarise what they are and how they compare with our figures.
UKHospitality/Oxford Economics
Easily the most substantive estimate is by Oxford Economics, commissioned by UKHospitality and published in May 2026.
The Oxford Economics study puts gross receipts from a 5% tax at £1,388m in 2026, rising to £1,595m in 2030, of which domestic visitors contribute £708m rising to £818m.34 That is more than double our £603m.
Oxford Economics’ modelling is more sophisticated than ours. It forecasts tourism to 2030, estimates how overseas visitors respond to prices, and follows spending changes through supply chains. We deliberately do much less. But their report doesn’t disclose enough for outsiders to check all those calculations.35 That’s problematic for any research, but particularly when it’s commissioned by an industry body with a direct interest in the outcome.
The differences between our results and Oxford Economics are substantial:
| Measure | Our central case: 2024 volumes, 2026 prices | Oxford Economics: 2026 scenario | Oxford Economics: 2030 scenario |
|---|---|---|---|
| Levy receipts | £603m | £1,388m | £1,595m |
| Receipts from British tourists’ trips | £379m | £708m | £818m |
| Fewer accommodation nights | 5.78m | 10.87m | 11.87m |
| Reduction in visitor spending | £689m | £1,473m | £1,787m |
| Reduction in GDP | Not estimated | £1,827m | £2,241m |
There are some immediate points of difference:
- We assume the levy applies before VAT, following Scotland. Oxford Economics describe theirs as applying “on top of VAT”. If they mean the VAT-inclusive bill, that could account for around £100m of the difference.36
- Oxford Economics’ figures imply that overseas visitors spend about 37% of their money on accommodation, against about 20% in the national accounts. That difference alone could mean hundreds of millions in tax receipts.37 The report doesn’t explain this difference.
- There’s a specific problem with the receipts figure that we can’t figure out. The report’s own baseline puts accommodation spending at £26bn. Five per cent of £26bn is £1.3bn. Yet receipts are said to reach £1,595m by 2030, which needs almost £32bn of spending for the rate to apply to. On the face of it, the tax collected is more than 5% of the thing it’s collected on.38
- Oxford Economics’ separately reported domestic and inbound spending reductions add to £1,872m, while their reported combined result is £1,787m. It’s unclear where the £85m difference comes from.39
The biggest difference appears to be how much accommodation spending they expect the tax to reach. The published information doesn’t let us reconcile their estimate with ours.40
It would be helpful if Oxford Economics could clarify these points and set out their methodology in more detail.
There are two further aspects of the Oxford Economics report, and the way UKHospitality has used it, which we don’t think can be justified.
First, the GDP calculation counts the damage from reduced tourism, but leaves out what happens when councils spend the tax receipts and British households spend their unused holiday budgets elsewhere. It therefore cannot tell us whether the tax makes the economy better or worse off.41 As the Treasury Green Book states, policy analysis needs to distinguish genuine change in economic activity from activity merely moved from one place to another. The figures UKHospitality is using in press releases are not justifiable – there will not be a “£2bn hit to the economy” unless the tax revenues, and diverted spending, all go up in smoke.
Second, UKHospitality’s publicity emphasises £688m of reduced Treasury receipts: a forecast fall in other taxes as tourism activity declines. It also reports £1.6bn of new tax on holidaymakers, but leaves out the combined result. Its own model predicts £907m more revenue across central and local government in 2030.42
Other published figures
There are other figures being mentioned which we think are much less reliable than UKHospitality’s:
- The Taxpayers’ Alliance claims that a £10 per night tax could cost the economy over £13bn and deter 42 million domestic overnight visits. It gets there by applying opinion poll responses to visitor numbers and spending. As we said recently, asking people whether a tax would stop them booking a holiday is a poor guide to what they will actually do.43 None of the studies cited here finds a tax-induced collapse on that scale.44 We don’t think the polling supports the claimed economic loss.
- PwC carried out a study for the European Commission in 2017 which modelled a hypothetical 3% occupancy tax in every member state that didn’t have one. It projected 23,140 lost jobs in the UK, the largest absolute job-loss figure in the study. They obtain the figure by applying the percentage fall in producer revenue to employment.45 Some degree of approximation is inevitable, and we are certainly guilty of it ourselves, but assuming employment falls in exact proportion to revenue takes it too far: businesses can adjust through hours, vacancies and margins as well as headcount. More seriously, money lost to the sector is not disappearing. Most of it will remain in the UK economy, but go elsewhere, either as redirected tourist spending or as new local authority spending, financed by the tax. Any calculation of the jobs impact needs to take account of new jobs created as well as old jobs destroyed. We therefore don’t think PwC’s number should be used.
- The Times, in an explainer for readers, said: “There are more than 130 million overnight stays in England each year, all of which would be liable for the charge when it is introduced”. This appears to be an error.46 England had over 500 million overnight nights in 2024, not 130 million: 249.9m from overseas visitors and 250.6m from British residents.47 Not all of these would be taxed: nearly 200 million of those nights are spent with friends and family, or in a second home. Our assumed scope leaves about 268 million taxable nights.
We’d very much welcome additional analysis from independent researchers.
Will we see tax competition between regions?
This is an unusual tax for the UK because it is genuinely being devolved. Neighbouring authorities are free choose different rates or decide against a tourist tax altogether.
So we won’t see one tax at all. We’d see a separate tourist tax for every strategic authority that chooses to charge one, each set by local leaders facing a different tourist economy and a different set of incentives.48 Each tax may have different exclusions. In theory, at least, each tax could have a different rate. Some will charge 5%, but some may charge nothing at all, either because they think it will hurt them or because they’d rather their neighbours went first.
This creates the potential for tax competition, which some view as dangerous and others as positive. Early indications are that we will see coordination rather than competition, but that may change. Many localities already compete, particularly when trying to attract large conferences.
The tourist tax doesn’t apply if you visit Manchester. It applies if you sleep in Manchester. So somewhere just outside Manchester (Wilmslow or Alderley Edge, perhaps) might decide to grab a bit more tourist revenue and poach Manchester’s hotel nights. Bradford-on-Avon may see an opportunity to poach hotel stays from Bath.
One can identify many such examples. The Peak District is split down the middle: the Derbyshire side, with Bakewell and Buxton, sits inside a mayoral authority, and the Staffordshire Moorlands side doesn’t. And London is ringed by towns that are a short train ride from a mainline terminus and outside the mayor’s boundary: Watford, Slough, Windsor, Dartford.
However, with one exception, which we’ll mention below, we see the actual potential for competition here as limited. There was already a big price difference between central hotels and hotels on the fringe. The tourist tax will just slightly exacerbate competitive pressure that already exists.
There is some evidence from other countries of small competitive effects between different regions. Along the Italian coasts, strings of resorts sit next to each other and set their own rates, and there is evidence of “substitution effects” towards resorts with lower taxes, though only on one coast.49 A similar effect has been found in Texas.50 This has also been used to explain why the responsiveness of tourists towards Georgia’s tourist tax is higher than for Hawaii’s tourist tax, because travellers to Georgia can sleep in another state, and travellers to Hawaii usually can’t.
However, larger studies have found very few effects of this type. Californian cities set their own rates and hotels sit on either side of city lines, making for a neat natural experiment. There was, however, no significant effect found.51
Some of the difference in findings may be down to how visible taxes are.52 Some of the US research concerns booking systems that showed pretax prices, with the tax appearing only at checkout. A tax shown late in the booking process may have less influence on the initial choice.53.
So, how much tax competition becomes a factor may depend on how visible the tax is. But, unlike in many countries, any UK tax would have to be visible when people book. Tax competition may, therefore, be more of a factor in the UK than elsewhere.
Evidence from published research
There’s a considerable body of published research on the impact of tourist taxes.
What the evidence doesn’t tell us
Tourist taxes are small, and their expected effects will therefore be small. Statistical studies are generally not good at picking up small tax-driven effects, particularly when they’re across complex visitor economies that are subject to significant seasonal and annual variation.54
A small percentage change can mean a substantial sum across a £57bn visitor economy, while being hard to separate from the effects of weather, exchange rates and other changes in hotel trading.
For example, treating Manchester’s £1 charge as roughly 1% of a room bill, our central assumptions and the approach in our model imply a fall in nights of about 0.4%. An effect that small may be difficult to detect in monthly data.
So a study finding no statistically significant effect doesn’t, by itself, confirm or disprove our estimate. The question is how the predicted effect compares with the study’s own margin of error. The Mancher study’s central estimate is that rooms sold fell by 0.3%. We predict 0.4%. But the uncertainty around that estimate is roughly eight times the size of the effect either of us is describing, so the study could never have seen it.55
The studies, therefore, do not establish a single, reliable estimate for England – but we can use them to inform the model’s inputs and to check its predictions.
What the evidence tells us
As a broad principle, we would say that the studies we reviewed generally find modest effects on hotel trade, sometimes indistinguishable from zero.
That is true of Manchester’s £1 charge, the only English study we have located and a smaller charge than a 5% tax on a typical hotel room,56 of Hawaii’s 5% room tax,57 of a panel of Italian municipalities,58 of the Balearic sustainable tourism tax,59 and of eight American destinations.60 Swenson, using establishment-level data across Californian cities with different rates (the best identification in the American literature), is blunt: “Hotel occupancy tax rates in California cities had no measurable impact on hotel revenues or employment.”61
One of the most striking findings was in a study funded by the American Hotel & Lodging Educational Foundation. Hudson and colleagues concluded: “Hotels appear to have absorbed any tax increases with little impact to their businesses, but there was concern among stakeholders as to how the lodging tax was spent.”62
As one might expect, things are different for group bookings, such as conferences, which are both highly organised and highly price-competitive. Sharma, Perdue and Nicolau, looking at more than 100 American urban submarkets, found that the effect on revenue per available room “was non-significant for transient but significant and negative for groups”, suggesting group bookings are more responsive to tax differences than individual bookings.63 So if anything holds English mayors back from introducing tourist taxes, it could be the conference trade, and the rules won’t let them exempt it.
There’s also research on “incidence”, the question of who absorbs the cost of the tax: visitors or accommodation providers. The two cleanest incidence studies, on a Georgia room tax and on Airbnb tax enforcement across American cities, both find hoteliers and hosts absorbing roughly a quarter to a third of the tax.64 Our model uses 75%, near the middle of that range. So the simple take, that the tax is paid by tourists, isn’t right. Some of it is paid by the accommodation sector.
The Scottish Government’s 2021 evidence review found no direct evidence for Scotland.65 Evidence on accommodation taxes also points to differences between destinations.66
There’s also a strand of theory arguing that taxing tourism is unusually efficient, because foreigners pay it. 67 But England’s tourist tax applies to everyone, not just foreigners, so it doesn’t get that benefit.
So if studies find only very limited effects, why does our model predict an effect?
Our model predicts that a 5% tax cuts nights in taxed accommodation by 2.2%, and total visitor spending in England by 1.2%.68 Some studies may struggle to detect effects of that size. We cannot assume that all would.69
The paradox is that a fall of around 1.2% in £57bn of visitor spending is nearly £700m, which is not such a small number.
We think our model and its assumptions are justified by the research, and we set out why in the methodology below. But we could easily be wrong.
Check back here in 2032.
Caveats and limitations
- The accommodation share is the biggest assumption. The domestic survey records accommodation spending, but the published breakdown does not give us everything needed to allocate it across accommodation types and regions. The overseas data used here records trip spending. For British visitors we calibrate the split so that total English accommodation spending falls within a range based on the figures the Great Britain Tourism Survey publishes separately (£6,657m of direct accommodation spending, plus part of £4,994m of packages, both 2024 figures), and the model re-checks that on every run. For overseas visitors we anchor to the ONS Tourism Satellite Account. But no source gives the split by accommodation type directly.
- Several assumptions have no direct measurement behind them: the share of accommodation bills that carry VAT (85%), the share of lost accommodation demand counted as lost trip spending (three quarters), the share of deterred British spending that goes abroad (a quarter), the share of deterred overseas spending retained elsewhere in the UK (zero), and the share of the national accounts’ accommodation total that the tax doesn’t reach (8%, which is what sets the 1% to 10% gap between our two estimates of the base). We think our central choices are reasonable, but they are judgments, and you can change them in the model. The two presets combine our more cautious and more generous settings. They illustrate how far the answer moves; they aren’t confidence limits.
- Our estimates use 2024 visitor numbers and spending uprated to 2026 prices by CPI. We do not forecast the visitor numbers or prices for the first year of the tax.
- 63% of receipts are from trips by British tourists in the central case. That is a share of receipts associated with trips, not the share of the burden borne by those tourists. Changing only the overseas accommodation assumption to its upper setting gives an overseas majority of about 51%.
- Our headline splits lost spending into money that leaves the UK and money that doesn’t. That rests on assuming a quarter of deterred British spending goes abroad and that no deterred foreign visitor switches to Scotland or Wales. Set the British share to zero and £287m leaves rather than £387m. Set it to zero and also let 30% of deterred overseas visitors go elsewhere in the UK and it’s £201m. Assume half of deterred British spending goes abroad and it’s £488m. You can change both.
- Our response assumptions draw largely on evidence from other countries and periods. The English study of Manchester’s £1 charge found no significant effect, but that charge is smaller than 5% on a typical hotel room. Evidence from Edinburgh’s 5% levy should provide a closer UK comparison.
- We assume the tax is charged at the same rate everywhere and that the response to it is linear in the rate. Neither is likely to be exactly true, and things would be very different if, for example, a locality applies a 10% rate. And our overall figure will obviously be an overstatement if some localities don’t apply the tax or apply it at lower rates.
- The web app splits both British and overseas visitors across nine English regions. These are not the strategic authorities that will set the tax.
- Regional overseas estimates use smaller survey samples than the England total, so the regional results are less reliable. Allocating visitors to individual strategic authorities would require further work.
- Domestic trips that the survey cannot place in a region (national parks and unspecified destinations, 5.1 million nights) are left out. Including them adds about £8m, so it’s not terribly material.
- Northern Ireland is outside the scope of this model, which estimates an English tax.
- We use 2024, the latest full year with published results for both surveys. Both sets of estimates are still classed as “official statistics in development” and may be revised.70 A fault in the domestic survey may have understated overnight trips, but we don’t yet know what correcting the historical figures would mean for spending in taxable accommodation.71 Our choice of 2024 doesn’t mean that our estimate is conservative.72
Methodology
We’ve published all the code implementing the model and the web app on our GitHub.
The model is based on these key parameters:
| Assumption | Central value | Status | Basis | What it moves |
|---|---|---|---|---|
| Tax rate | 5% | Policy | Modelled rate; the government proposes local discretion with no national cap | Everything, roughly in proportion |
| Accommodation share of British visitors’ trip spending | 40% hotels, 45% rentals, 30% camping | Calibrated | Chosen to fall within a range based on the GBTS published accommodation spending figures (£8.3bn to £10.4bn) | Receipts: −£48m at the bottom of the band, +£76m at the top |
| Accommodation share of overseas visitors’ spending | 19.6% of UK spend | National accounts estimate | ONS Tourism Satellite Account, Table 1 | Receipts: −£17m at the low end, +£121m if British visitors’ shares are used instead, or +£176m at the model’s upper setting. Also decides whether British or overseas trips generate the majority |
| Share of accommodation bills that carry VAT | 85% | Judgment | Hotels are registered; many Airbnb hosts and small B&Bs sit under the £90,000 threshold. Nothing measures the split | Receipts: −£18m at 100%, +£29m at 60% |
| Share of the tax passed on to the customer | 75% | Judgment informed by evidence | Incidence studies suggest roughly 70% to 86% (Georgia, Airbnb, Hiemstra and Ismail). PwC assumes 60% | Receipts barely; spending lost £551m to £790m |
| Room-price elasticity, overseas visitors | −0.5 | Evidence range | Published hotel and short-let demand estimates, −0.13 to −0.7 | Receipts £598m to £613m; spending lost £179m to £964m, varying both elasticities and keeping British visitors 25% more responsive |
| Room-price elasticity, British visitors | −0.625 | Judgment on direction | Set 25% above overseas, after Biagi and colleagues found domestic demand fell and international did not | Spending lost −£80m if set equal to overseas |
| Share of lost accommodation demand counted as lost trip spending | 75% | Judgment | Lost paid nights need not mean lost trips: visitors may shorten their stay or switch accommodation. There is no direct measurement of this share | Spending lost £230m at 25%, £918m at 100%; receipts unchanged |
| Share of deterred British spending that goes abroad | 25% | Judgment | Nothing measures it. DCMS’s UK model shows domestic and foreign holidays are substitutes (substitute-price elasticities 0.84 to 2.83) but not what share goes abroad. Oxford Economics assume 3%, also a judgment | Leaves the UK: £287m at 0%, £299m at 3%, £488m at 50% |
| Share of deterred overseas visitors who go elsewhere in the UK | 0% | Judgment | We assume no substitution to elsewhere in the UK. There is no direct measurement | Leaves the UK: £301m at 30% |
| Campsites and touring pitches | Taxed | Policy reading | In scope unless an authority exempts them (government response, 4.3) | Receipts −£27m if exempted everywhere |
| Hostels, halls of residence, boats | Not taxed | Scope assumption | We exclude this mixed survey category. Commercial stays in halls or boats would not automatically be exempt | Receipts +£28m if all taxed |
| Domestic trips with no recorded region | Excluded | Editorial | 5.1m nights the survey can’t place in an authority | Receipts +£8m |
| Share of the national accounts’ accommodation total the tax doesn’t reach | 8% | Judgment | Used only in the cross-check; nothing measures it | Whether the survey figure sits 1% or 10% above the accounts |
| Prices | 2026, uprated from 2024 by CPI | Measured | ONS CPI 141.5 against 133.9, a factor of 1.0568 | Our model’s £ figures by 5.7%; volumes unchanged |
| Visitor volumes | 2024 | Measured | Latest complete year of both surveys; not projected to 2028 | First-year receipts depend on prices, visitor numbers and local adoption |
The methodology then works like this.
1. The data
We assemble the critical data sources like this:
- Overseas visitors come from the ONS International Passenger Survey for 2024, in the regional release published by VisitBritain. British visitors come from the 2024 Great Britain Tourism Survey trip-level file, using its England-weighted columns, so that Scottish and Welsh residents visiting England are counted and English residents’ trips to Scotland are not.
- Both are reduced to a grid by origin, journey purpose and accommodation type, holding nights, trips and total trip spending. The Python model’s default grid splits domestic trips across the nine English regions and uses a single England total for overseas trips: 195 rows. The web app splits both across the nine regions. Its data file has 363 rows, including domestic trips with no recorded region, which are excluded from results by default. The nine English regions of the IPS reconcile to its England total to within 0.002% on nights and on spending, so no cell is counted twice.73
- Recorded 2024 spending is £27,114m inbound and £26,806m domestic. Every figure from here on is multiplied by 1.0568, which is ONS CPI for 2026 so far (141.5) against 2024 (133.9), so those become £28,652m and £28,328m in 2026 prices. Nights and trips aren’t uprated, because uprating is about the value of money and not about how many people came. Totals: 249.9m inbound nights and 250.6m domestic, 500.5m in all.74
2. What the tax reaches
Accommodation is grouped into five types.
- Three are liable: serviced accommodation (hotels, guest houses, B&Bs), commercial rentals (self-catering and platform lets) and camping or caravanning.
- Two are not: someone’s private home, whether a friend’s or a second home, because there is no commercial bill;
- The residual “other” group, covering hostels, university halls and boats. We exclude this mixed category as a modelling assumption. The government’s response permits local hostel exemptions, but does not automatically exclude commercial visitor stays in halls or on boats.
That leaves 267.7m liable nights out of 500.5m.
3. From trip spending to an accommodation bill
We need accommodation shares to turn the published trip spending into the breakdown required by the model. GBTS provides an accommodation total, but not the full breakdown we need by accommodation type and region. For each row:
bill = trip spending × accommodation share of that type × (0.649 if the visitor is from overseas)
The shares are 40% for serviced accommodation, 45% for commercial rentals, 30% for camping, 25% for the residual and 2% for a private home.
For British visitors they are set so that total English domestic accommodation spending reproduces the figure GBTS publishes separately: £6,657m of direct accommodation spending plus £4,994m of package spending, of which some part is accommodation. Taking a third to three quarters of the package gives a band of £8,305m to £10,402m, and the shares above produce £9,234m, inside it.
Overseas visitors get a lower share, because their spending pattern is different: surprisingly (at least to us) nearly half their nights are with friends or family and shopping is a far larger part of what they spend. The ONS UK Tourism Satellite Account 2023 puts their accommodation at £6,131m of £31,203m spent in the UK excluding air fares, or 19.6%. Scaled to England’s 85.8% share of inbound spending and to 2024, that is £5,813m, and 0.649 is the multiplier on the domestic shares that reproduces it (£5,813m in the model).
Across all accommodation types this gives a £15,368m accommodation bill, of which £14,540m is liable to be taxed.
The national-accounts anchor described above puts the liable bill between £13,157m and £14,353m (depending on that pesky 8% assumption).
4. The tax
We assume the tax is charged on the price before VAT and then itself attracts VAT.75
Survey spending is what the visitor actually paid, so it is VAT-inclusive, and the bill is divided by 1.2 for the share of it that carries VAT, which we take to be 85%.76
Providers who absorb part of the tax do so by cutting their own price, so with pass-through p and rate t the pre-tax price falls to (1 + p × t) ÷ (1 + t) of what it was: 0.9881 at the defaults.
The taxable base is £12,332m, and at 5% the tax raises £616.6m before anyone changes their plans.
5. How visitors respond
Three steps: work out the price rise a visitor sees, multiply by an elasticity to get the change in demand, then apply that change. The model has two complete specifications and never mixes them.
The hotel-bill reading (default). Not all of the tax reaches the visitor, because hotels and hosts absorb some of it. We assume 75% is passed on. The incidence studies suggest roughly 70% to 86%; PwC uses a lower assumption.77 Salience is set to 1, meaning visitors see the whole of what is passed on. The price rise is therefore rate × 0.75 = 3.75%. The elasticity is a room-price elasticity, −0.5, between the four published estimates of −0.13, −0.44, −0.48 and −0.778, and demand is measured in nights. Each row’s elasticity is multiplied by a responsiveness factor for where the visitor lives: 1.0 for overseas visitors and 1.25 for British ones, because the study we found separating the two, Biagi, Brandano and Pulina, found domestic demand fell after a visitor tax while international demand did not. Weighted across liable nights this gives an average elasticity of −0.576 (−0.625 British, −0.5 overseas) and a fall in demand of 2.16% (2.34% British, 1.88% overseas). Because a lost night in a hotel is not always a lost trip, only three quarters of the lost accommodation demand is counted as lost trip spending.79
The whole-trip reading (illustrative). The price rise is diluted by the accommodation share of what the visitor spends in the destination, so 1.50% for a British visitor and 0.99% for an overseas one across the rows that carry the tax, and we apply whole-trip demand elasticities as proxies for changes in visits: either the purpose-level set (business −0.35 and visiting friends and relatives −0.80 from Peng, other −0.61 and rural holiday −1.23 assigned using Blake and Cortes-Jiménez for DCMS, 2007, urban holiday −0.70 blending PwC with DCMS, the holiday figure blended by each region’s share of holiday nights spent camping) or Peng’s −1.489 for a destination as a whole. Every lost visit is a lost trip, so the three-quarters factor above does not apply.80
6. The outputs
Tax raised = taxable base × rate × (1 + change in demand), row by row = £603.2m
Nights lost = liable nights × proportionate reduction in demand = 5.78m
Visitor spending lost = total trip spending on liable rows × proportionate reduction in demand × 0.75 = £688.8m, of which £286.6m is overseas visitors and £402.3m is British
Leaves the UK = overseas spending lost + British spending lost × 0.25 = £387.1m
Spent elsewhere in the UK = British spending lost × 0.75 = £301.7m
7. The presets
The “cautious” preset is an illustrative lower-revenue case: accommodation shares scaled by 0.92, inbound multiplier 0.60, all bills VAT-registered, pass-through 86%, room elasticities of −0.70 inbound and −1.05 British, every unit of lost accommodation demand translated into lost trip spending, half of deterred British spending going abroad and no inbound spending retained elsewhere in the UK. Camping is exempt. It gives £494m raised and £1,550m of gross spending lost.
The “generous” preset is an illustrative higher-revenue case: shares scaled by 1.1265, inbound multiplier 1.16, 60% of bills VAT-registered, pass-through 60%, both room elasticities −0.13, a quarter of lost accommodation demand translated into lost trip spending, no British spending diverted abroad and 30% of deterred inbound spending retained elsewhere in the UK. Hostels and halls are in scope. It gives £977m raised and £46m lost.
All the code implementing the model and our web app is available on our GitHub.
Many thanks to G for the original model and code, and B, V and O for their industry expertise that helped build it. Thanks to K and C for working on this month’s update to the model and on the draft of this report. Thanks to B for their review.
ONS International Territorial Level 1, January 2025, © Crown copyright and database right 2025, under the Open Government Licence v3.0. Contains OS data © Crown copyright and database right 2025.
And thanks to the authors of Apache ECharts and the other open source tools we rely upon so heavily.
The hidden reach of inheritance tax: one in five pensioner households
What would a land value tax actually do?
What if Andy Burnham lowered the mansion tax threshold to £1.5m?
Has Britain run out of “other people” to tax?
The UK has 90 different taxes. France has 348. Germany has 60. Why?
Why does Britain have more taxes than at any time since 1834?
Footnotes
The government expects local leaders to set out plans for spending the revenue by March 2028, subject to Parliament approving the legislation. Its consultation response, paragraph 1.5.2, does not fix a common start date for the tax. ↩︎
Scotland and Wales have already legislated for their own visitor levies and are not covered here. Edinburgh has been charging since July, at 5% of the accommodation cost and capped at five nights. Cardiff will start charging on 1 April 2027; other Welsh councils will decide whether to follow. The Welsh rates are 75p or £1.30 per person per night, depending on the accommodation. ↩︎
The model is built on the 2024 International Passenger Survey for inbound visitors and the 2024 Great Britain Tourism Survey for domestic ones, with the accommodation share of spending anchored to the ONS UK Tourism Satellite Account. We developed the model last year but didn’t publish it because the tax didn’t seem to be a realistic prospect at the time. Now it’s become current we’ve updated the model… we give this background to make clear that this is not something we created overnight, but represents a significant amount of work. ↩︎
Our model’s figures are in 2026 pounds, as are all figures in this report (unless we indicate otherwise). The visitor surveys, on which our model is based, are for 2024 (the last complete year) so we’ve uprated all the money by CPI (but not changed the visitor numbers). ONS CPI all items, series D7BT: 133.9 for 2024, against a 2026 average of 141.5 across the seven months published so far, so a factor of 1.0568. We considered uprating by hotel prices specifically, but that would introduce a further hard-to-verify assumption in a model that is already heavily pregnant with assumptions. ↩︎
The Times reported that the revenues won’t be able to be used for cutting residents’ council tax, although it’s not clear to us that this is a real limitation. Money doesn’t have labels on it, and it may well be that council tax would be at a different level were it not for tourist tax revenues. That perhaps explains why this point isn’t anywhere in the consultation. It may be a political gloss rather than a rule. ↩︎
The design is set out in the government’s response to its consultation, September 2026. Scope is at 4.3, the absence of a national rate cap at 5.3.5, the absence of local night caps at 5.3.7, and one rate per authority at 5.3.8. ↩︎
A cap on the rate is different from a limit on the number of nights charged. Edinburgh’s tax (live since July) is 5% of the net accommodation cost, and after five nights there’s no additional tax. Cardiff starts charging in April 2027 under Wales’s legislation, with rates of 75p or £1.30 per person per night. Allen Simpson of UKHospitality made the point: “What we’re talking about here is an open-ended power for mayors to set tourism taxes at any level they want. And remember that if you go to Paris, if you go to Rome, if you go to Berlin, you’re paying a small tourism tax, but it’s capped”. This may not matter if 5% turns out to be a de facto cap. ↩︎
See paragraphs 4.3.1 and 4.3.4 of the consultation response document. ↩︎
The government’s wording is that accommodation “not provided on a commercial basis will not be in scope; this could include, for example, registered gypsy and traveller sites, temporary accommodation, and charitable accommodation for shelter or refuge”. Strategic authorities may additionally exempt “tent pitches, touring caravan pitches and dormitory-style accommodation like hostels in their areas, subject to local consultation”. The logic is that a tax on the accommodation bill needs a commercial bill to attach to. ↩︎
Overseas visitors come from the ONS International Passenger Survey, which interviews travellers at ports and airports and is published in regional detail by VisitBritain. British visitors come from the Great Britain Tourism Survey, a continuous survey of GB residents run for VisitEngland, VisitScotland and Visit Wales. GBTS asks respondents to break trip spending down by category, accommodation included (question TS32 in the survey’s background quality report, page 14), and the annual tables publish the accommodation total, which is what we calibrate against below. What they don’t publish is that total by accommodation type. We’d encourage VisitEngland to release it – we assume they have the information. Both surveys are official statistics and both are for 2024. ↩︎
These shares are calibrated, not observed: no source gives the split by accommodation type. The control total is the GBTS England annual tables, which report £6,657m of direct accommodation spending plus £4,994m of package spending, of which some part is accommodation. Taking a third to three quarters of the package gives a band of £8,305m to £10,402m, and our shares produce £9,234m, inside it. (Those are 2024 figures, because that is what the survey publishes.) The model re-runs this check on every run and says so if a change pushes it outside the band. A rented cottage gets a higher share than a hotel because self-catering visitors buy fewer meals out; camping gets a lower one because the pitch is cheap relative to everything else. ↩︎
ONS UK Tourism Satellite Account 2023, Table 1: accommodation services £6,131m out of £34,801m of inbound overnight expenditure, or £31,203m once air fares, which the International Passenger Survey does not record, are removed. ↩︎
The government’s response, section 4.3, permits local exemptions for campsites, touring pitches and hostels, and proposes a threshold for occasional informal providers. Commercial visitor stays in university halls, on boats or in a private home are not automatically exempt. Our 8% deduction is a scope assumption, not a measured total of statutory exemptions. ↩︎
The right-hand column puts both estimates on the same footing, treating every bill as VAT-registered and everything as static, which is why the first row shows £606m rather than the £603m we actually estimate. ↩︎
The two approaches lean on some of the same data, so agreement between them is weaker evidence than it looks. There is a third route that initially, we thought it looks independent, but when you think about it, you realise it isn’t. Start from the accommodation sector’s turnover in the Annual Business Survey (£38.8bn) and cut it down using the satellite account’s ratios, and you get much the same answer. But work the algebra through and the accommodation-output figure you divide by cancels against the one you multiply by, leaving the same tourism-consumption anchor as the second route, so all the Annual Business Survey really contributes is a 2023 to 2024 growth rate. ↩︎
The VAT registration threshold is £90,000 of turnover. Essentially every hotel and serious guesthouse is above it; a large share of Airbnb hosts and small B&Bs are below it and charge no VAT, so for them there is no VAT to strip out and their whole bill is taxed. Nothing measures the split, and 85% is our judgment. It makes quite the difference: at 100% the tax raises £586m, at 60% it raises £633m. The direction is counter-intuitive but right, because a bill with no VAT in it is a bigger base. ↩︎
Four studies, all four marked on the slider in the model. Canina and Carvell (2005) find −0.13 and Hiemstra and Ismail (1993) find −0.44, both as cited by Collins and Stephenson (2018), who themselves report −0.7 for hotel rooms in Georgia. Bibler, Teltser and Tremblay find −0.48 for Airbnb nights after a tax. The −0.5 we use as our central figure means a room that costs 1% more loses half a percent of its bookings. ↩︎
The central source is Peng and colleagues (2015), a meta-analysis of 195 studies, which gives −1.489 for a destination as a whole. Our purpose-level set mixes that with a 2007 DCMS study and PwC’s work for the European Commission: business −0.35 and visiting friends and relatives −0.80 come from Peng. We assign DCMS’s −0.61 to “other” trips and −1.23 to rural holidays, with urban holidays −0.70 blending PwC with DCMS. DCMS estimates spending responses: −0.61 is for inbound tourism overall and −1.23 for inbound holidays generally, not rural holidays specifically. We use these as proxies for changes in visits, assuming real spending per visit stays constant. Assigning them to these categories, and transferring estimates between overseas and British visitors, are further assumptions. Peng also combines studies using different measures of tourism demand. These whole-trip settings are illustrative. It’s a hand-assembled set rather than any one study’s, so calling it “PwC’s”, as people often do, gives it more unity than it has. ↩︎
The study we found separating the two is Biagi, Brandano and Pulina (2017), who applied synthetic control to a Sardinian municipality that introduced a visitor tax and found “the introduction of a visitor tax leads to a decline in domestic tourism demand. In contrast, there is no effect on international tourism inflows”. It’s one small study on one municipality and we wouldn’t want to over-rely on it, but it seems a reasonably intuitive result to us. So we set British tourists 25% more responsive than foreign ones. ↩︎
Across the five scenarios shown below the revenue only moves between about £598m and £613m. ↩︎
This is one reason why we regard the Laffer curve as an unhelpful guide to tax policy. It tells us what tax rate maximises revenue, not welfare. Indeed, the revenue-maximising rate is generally reached only after taxation has caused substantial economic harm: it is the point at which the additional revenue from a higher rate is finally cancelled out by the resulting behavioural response. This makes the Laffer curve of limited conceptual value, even if we can determine where precisely the peak of the curve is (for any particular tax and set of circumstances). For more on this, see Trabandt and Uhlig in their widely cited 2011 paper revisiting the Laffer curve. ↩︎
The British share of receipts depends heavily on how much we estimate overseas visitors spend on accommodation. The surveys tell us their total spending in England, but we need to estimate how much goes on accommodation, which attracts the tax, and how much goes on things like shopping and restaurants, which don’t. Our central estimate uses the national accounts to establish overseas visitors’ accommodation spending. That produces £224m of tax receipts from their trips, against £379m from British visitors’ trips: a British share of 63%. Our estimate of British visitors’ accommodation spending is separately checked against published Great Britain Tourism Survey figures.
You can set the accommodation percentages to anything you like. ↩︎This is an illustrative room bill, not an estimated average family holiday – ONS data suggests the average hotel room costs £120, but of course many people stay in other forms of accommodation. ↩︎
These are constructed English businesses, not estimates for particular companies or statistical averages. Annual sales, excluding VAT, are £85,000, £800,000 and £1bn; room sales are £85,000, £600,000 and £750m. For the B&B, we start with £30,000 available to the owners before interest and tax, then deduct a notional wage for their work: 35 hours a week between them, for 52 weeks, at the 2024/25 adult minimum wage of £11.44. That is £20,821 for labour and £9,179 profit. We increase the labour allowance to £22,222 when the minimum wage rises to £12.21. This allowance excludes employer NICs and pensions for the self-employed owners; costs for their two employees are separate. The hotel’s starting operating profit is £64,000 (8% of sales) and the chain’s £200m (20%), both after staff and management costs. These are rounded assumptions informed by published accounts. All starting profits are before the illustrated changes, interest and tax. ↩︎
The tourist tax effect combines the tax absorbed on retained bookings with the profit lost on bookings that disappear. Respectively, those two amounts are £990 and £1,488 for the B&B; £6,987 and £10,500 for the hotel; and £8.73m and £13.13m for the chain. We apply the same illustrative visitor mix to each: two thirds of room sales to British visitors, one third to overseas visitors. A 5% tax with 75% pass-through raises customer prices by 3.75%; the model’s domestic and overseas room-price responses imply 2.19% fewer bookings for this mix. We assume costs such as laundry, supplies, commissions and energy fall by 20p for each £1 of room sales lost, so the other 80p reduces profit. Rent, rates and staffing remain. For context, Knight Frank’s 2025 review reports a 67% rooms departmental margin outside London, with payroll accounting for about half of departmental costs. On these assumptions, the booking effect is larger than the absorbed tax. The latter is room sales × (1 − 2.1875%) × 0.05 × 0.25 / 1.05: no tax is absorbed on bookings that have disappeared. This is a static illustration with a demand response, and not in any sense a forecast. Staffing, owners’ hours and non-room sales stay fixed; we allow no further price rises or efficiency savings – in reality, we could well see both. Actual visitor mixes, cost savings and losses of food and drink sales would change the result – again, we could see some or all of this.
The April 2025 increases are annualised comparisons of 2024/25 and 2025/26 rules, without inflation uprating. We use the adult minimum wage, employer NIC rules and Employment Allowance, and hospitality rates relief. The guesthouse has two employees working 16 hours a week; the hotel has eight working 35 hours and six working 16 hours, all on minimum wage for 52 weeks. The chain has 10,000 hourly employees sharing a £175m wage bill, which rises in line with minimum wage, and 2,000 salaried employees sharing £75m, whose pay is unchanged. All are assumed liable for employer NICs. The B&B’s minimum-wage segment also includes the £1,401 increase in its notional owner-pay allowance. This is an economic cost, not a statutory wage payment to the owners. The segment includes additional employer pension costs (3% of qualifying earnings, with the small businesses’ part-timers newly enrolled when annual pay passes £10,000) and, for the chain, the additional Apprenticeship Levy. The guesthouse has full small business rates relief; the hotel has a £60,000 rateable value. The chain starts with a £40m rates bill and reaches the £110,000 group relief cap in both years, so its rates increase comes from the multiplier rising from 54.6p to 55.5p. We don’t include the April 2026 rates changes. ↩︎
There’s a proposed exemption for occasional, informal providers, but nothing for small commercial hotels and B&Bs. ↩︎
We fear the de minimis threshold mentioned in paragraph 4.3.1 of the government’s consultation response will either be too small to be relevant to small businesses, or become a problematic cliff-edge. ↩︎
Together with connected entities – this is where things could get complicated, although we’d hope £1,000 isn’t enough to motivate avoidance structures. ↩︎
Frontier Economics estimates 147,000 dedicated holiday-let properties in England; VisitEngland counts approximately 34,000 hotels, B&Bs and camping establishments. Assuming two holiday lets per business or connected group, plus 25,000 other qualifying businesses, gives approximately 100,000 allowances of £1,000. The ownership assumptions are illustrative. ↩︎
There are 66,500 business-rated self-catering properties in England, against Frontier Economics’ estimate of about 147,000 dedicated holiday lets. ↩︎
In principle a deterred overseas visitor could come to Britain anyway and go to Scotland or Wales instead, since the tax is England-only. We assume they don’t. This is a pure assumption and we have no data to support it, but people we spoke to in the hospitality industry thought that people choose England, Scotland or Wales as a destination and don’t flip between them over the price of a room. Edinburgh already charges a tax and Cardiff will do so from April 2027, but there is no uniform tax across Scotland or Wales. Our assumption remains that deterred overseas spending is not retained elsewhere in the UK. If you disagree, simply adjust the “% of deterred foreigners who stay in the UK” slider. ↩︎
That’s pure judgment on the part of the industry experts we spoke to. The 2007 DCMS model of UK domestic tourism (Table 28, p.42) finds that domestic spending rises when foreign holidays get dearer, with substitute-price elasticities of 0.84 for holidays, 1.54 for business and 2.83 for visiting friends and relatives, which the authors read as VFR having “a higher element of substitutability with foreign holidays”. So British and foreign holidays are substitutes, and materially so. But those coefficients describe changes in domestic spending, not spending abroad, so they can’t tell us what share of the money a tax deters from an English hotel ends up in a Spanish one. Heffer-Flaata and colleagues found accommodation taxes abroad barely move British travellers, which says how many react rather than where they go. Oxford Economics assume 3% (p.19); that’s a judgment too. The model lets you set it anywhere from none to half. Set it to 3% and the amount leaving the UK is £299m; set it to zero and £287m; set it to half and £488m. ↩︎
Part of every tourist pound goes on imports, and some of the staff and buildings that served those visitors may find other uses. The big questions are always: how much and how quickly? Considerable work would be required to turn our model’s output into a GDP figure, but we are doubtful that would be worthwhile given how small a fraction of GDP it is. ↩︎
Tourism Levy Impacts in England, Oxford Economics for UKHospitality, May 2026, table on printed page 23: gross levy receipts £1,388m in 2026 and £1,595m in 2030; domestic £708m and £818m; international £680m and £776m. The method is set out on pages 16 to 19 and in Appendix C. UKHospitality’s summary page links the full report. ↩︎
The technical appendix, pp.29–30, describes the forecasting framework and reports gravity-model coefficients and rounded p-values. It does not report standard errors, alternative specifications or detailed diagnostic results. An R² above 0.9 indicates a good overall fit; it does not establish that the estimated response to prices is reliable. The report also says year effects address stationarity, but it supplies no test results supporting that claim. These omissions don’t mean the estimates are wrong, but they mean it’s very hard for anyone to independently scrutinise them. ↩︎
Applying 5% to the whole bill in our model, with demand and other assumptions unchanged, raises about £703m rather than £603m. This illustrates the size of a possible VAT difference; it does not establish Oxford’s treatment. Their wording is on p.16. We follow Scotland’s approach, but England’s calculation rules remain under discussion. ↩︎
Their £776m of overseas receipts in 2030 implies £15.52bn of taxable accommodation spending, or 37.1% of their £41.784bn of overseas spending after the tax. The 2023 UK Tourism Satellite Account, Table 1, gives £6.131bn of accommodation spending out of £31.203bn excluding air fares: 19.6%. Applying that share to Oxford’s spending total gives about £411m of receipts, £365m less. This is all illustrative, the comparison spans different years and geographies, and requires consistent VAT and spending definitions (which we don’t have). ↩︎
The £26bn is on p.15, in a panel explicitly labelled as an England forecast for 2030. Its total visitor spending and paid nights are not directly comparable with our 2024 overnight figures. Differences in scope or VAT treatment may also explain the accommodation figure, but the report does not show how it leads to £1,595m of levy receipts on p.23. We’d welcome a reconciliation. ↩︎
Our arithmetic: £1,055m on p.20 plus £817m on p.18, compared with £1,787m on p.23. The published figures do not show the adjustment needed to reconcile them. ↩︎
On the other hand, our different assumptions about how visitors respond make little difference to estimated tax receipts. Oxford Economics apply the levy as a proportion of total trip spending: see Appendix C. Applying their published response coefficients and assuming the tax is fully passed on, while retaining our accommodation spending estimates, produces approximately £611m of receipts against our central £603m (a comparison using our data, not a reproduction of their model). ↩︎
The report models losses through tourism businesses and their suppliers. It acknowledges excluding benefits from levy-funded improvements on pages 16 and 17. It allows some switching to day trips and stays with friends, but doesn’t capture the wider effects of replacement household spending or spending funded by the levy. The size of those offsets needs estimating. We cannot assume they cancel out the losses or exceed them. ↩︎
The report’s p.23 gives £1,595m of levy receipts less £688m of other tax losses, leaving £907m. The press announcement gives the two components but omits that net increase. ↩︎
Research on hypothetical bias finds substantial differences between what people say they would pay and what they pay when money is at stake. See List and Gallet (2001), Murphy and others (2005), and Bertrand and Mullainathan’s “Do People Mean What They Say?” (2001). These studies explain why stated intentions need checking against behaviour; they do not provide a correction factor for this particular poll. ↩︎
The evidence discussed below covers Hawaii and Georgia, California, Italy, the Balearics and eight American destinations. Their taxes and settings differ, so this is not a direct test of a £10 English levy. Nor is the £13bn spending estimate directly comparable with Oxford Economics’ GDP estimate for a 5% levy. ↩︎
That’s explicit: PwC say “By construction, the percentage impact on producer revenue is equivalent to the percentage impact on GVA and employment.” No labour market behaviour was modelled at all. ↩︎
If “stays” was meant to mean trips rather than nights, the England figure is about 126 million (just under 90 million domestic trips, plus 36 million inbound visits), but this is the wrong measure, since a trip is charged per night. ↩︎
Inbound nights from the ONS International Passenger Survey via VisitBritain; domestic nights from the Great Britain Tourism Survey. Both use 2024 data. The domestic figure leaves out 5.1 million nights the survey records against national parks or no region at all, because they cannot be placed in an authority; including them takes England to 505.6 million. ↩︎
The power goes to mayoral strategic authorities and to the new “foundation strategic authorities” in areas without a mayor. The government’s consultation response does not fix the eventual number, because the map of strategic authorities is still being completed, and each authority may set only one rate (section 5.3.8). ↩︎
Biagi, Brandano and Pulina, “Tourism taxation: a synthetic control method for policy evaluation”, International Journal of Tourism Research 19(5), 2017, summarising Candela, Castellani and Mussoni (2013). A town’s own tax reduces its arrivals, with an estimated tax elasticity of about -0.06. Its neighbour’s tax raises its arrivals, with an elasticity of about +0.07. Cavallero and Zagler, “The beach: tourism tax competition along the Italian coasts”, Journal of Economics 145(1), 2025, Table 2. The own-tax coefficient runs from -0.034 to -0.068 across specifications and is significant in five of seven; the coefficient on the neighbouring town’s tax runs from +0.066 to +0.075 and is significant in every specification that includes it. Two different pieces of evidence are in play here and they don’t say the same thing. The Adriatic substitution finding is the older Candela, Castellani and Mussoni result, which we have only through Biagi’s summary. Cavallero and Zagler’s 2025 results are for the Tyrrhenian coast, where they find towns “loose tourists to municipalities in the (south)east, if those reduce their tourism tax rate”; on the Adriatic they “do not find similar behavior”, and having failed an autocorrelation test there they say they “would not endorse an interpretation of the results obtained”, which is the right call. The models have a within R-squared below 1%, but that does not by itself tell us how precisely the tax effect is estimated. ↩︎
Seul Ki Lee, “Revisiting the impact of bed tax with spatial panel approach”, International Journal of Hospitality Management 41, 2014. Using a random effects spatial panel on the Midland-Odessa market, Lee reports “significant evidence of competitive disadvantage created by the adoption of bed tax for Midland hotels in 2007, and also a possibility of error in pricing strategy by these hotels”. Lee thinks the Midland hotels priced badly, so it’s not just a tax effect. ↩︎
The coefficient was 0.0001, on 65,794 establishment-years with fixed effects. Swenson, “Empirical evidence on the economic impacts of hotel taxes”, Economic Development Quarterly 36(1), 2022, Table 3, Model 2. ↩︎
Swenson first made this point. ↩︎
Although a visitor can still reconsider; one of the authors of this report recalls having done exactly that, although she may not be a typical consumer. ↩︎
Hudson and colleagues had to model seasonality explicitly “due to its ability to cause volatility for hotel demand and revenue” (Tourism Economics, 2021, citing Ampountolas 2018). Swenson notes that the establishment-level data he uses tends to “underreport volatility” (Economic Development Quarterly, 2022). Cavallero and Zagler’s tax-competition models explain under 1% of the within-town variation in arrivals (Journal of Economics, 2025). ↩︎
The usual yardstick in this kind of study is how closely the synthetic comparison tracked the real city before the policy arrived. For rooms sold that error is 3.2%, against a measured effect of 0.3% and a predicted one of 0.4% (Table 4). It’s important to note that the paper is not neutral. Its impact statement tells hoteliers and “their lobbies” that they “should adopt a favorable stance towards implementing minor taxes levying overnight stays”, because consumers “appear insensitive to these types of taxes”. The authors’ opinions on taxation have taken them well past their own evidence, which can’t rule out a 6.4% fall in room revenue. ↩︎
The closest analogue anywhere to the English policy: a per-night charge, in an English city, introduced in 2023 and promoted by the hotels themselves through a business improvement district. Anguera-Torrell, Aznar-Alarcón and Boto-García build a synthetic Manchester from 13 other UK cities on monthly STR data from January 2021 to September 2024, with interrupted time series and synthetic difference-in-differences as robustness checks, and report no significant effect on rooms sold, average daily rate, occupancy, total room revenue or revenue per available room. Tourism Management 109, 2025. All five estimates are negative: -0.3% for rooms sold, -1.9% for average daily rate, -1.8% for occupancy, -6.4% for total room revenue and -2.6% for revenue per available room (Table 4). None is statistically significant, because each is smaller than the error with which the synthetic comparison tracked Manchester before the tax arrived. That is a real null find rather than an underpowered test: it survives interrupted time series, synthetic difference-in-differences, dropping Liverpool from the comparison group because it levies a charge of its own, and pushing the window back to 2010. Tourism Management 109, 2025. ↩︎
Bonham, Fujii, Im and Mak (1992) used interrupted time series and found a negligible effect on real hotel revenues; Bonham and Gangnes (1996) redid the exercise using cointegration and reached the same place. ↩︎
Cavallero and Zagler, Journal of Economics 145(1), 2025, open access. We discuss this one at more length in the section on tax competition above, because its subject is really the boundary question rather than the aggregate one. ↩︎
Heffer-Flaata, Voltes-Dorta and Suau-Sanchez, Journal of Travel Research 60(4), 2021, using panel data on UK city pairs to Spain, France and Italy from 2012 to 2018. They find the impact of the Balearic city taxes on UK arrivals to be statistically insignificant. ↩︎
Hudson, Meng, So, Smith, Li and Qi, Tourism Economics 27(1), 2021, combining monthly STR data with stakeholder interviews. ↩︎
Swenson, “Empirical evidence on the economic impacts of hotel taxes”, Economic Development Quarterly 36(1), 2022. ↩︎
The same paper’s results “did not fully support the hypothesis that when a city’s hotel tax greatly increases above that of an easily accessible competitor, it will result in an economic loss to the city with the disproportionate tax rates”. ↩︎
Sharma, Perdue and Nicolau, Journal of Travel Research, 2022, on more than 7,000 observations across over 100 US urban submarkets from 2013 to 2018. The loss is in volume rather than in rate, because “hotels are not reducing their prices in response to tax increases and, as a result, are suffering losses in group room demand as groups shift their business to other destinations”. One oddity: the abstract offers the opposite mechanism, suggesting hotels “may be more inclined to offer discounts to groups, thereby absorbing some of the tax increase”. The results section finds they did not. We cite the results. ↩︎
Bibler, Teltser and Tremblay, Review of Economics and Statistics 103(4), 2021, exploit the staggered rollout of agreements under which Airbnb starts collecting occupancy tax at the point of sale, so compliance jumps to 100% on a known date in a known place. They find “booking prices fall by 3.2% when a tax enforcement agreement is in place”, against an average enforced rate of 11.2%, so renters bear about 72% of it. Collins and Stephenson, Journal of Regional Analysis and Policy 48(1), 2018, find about 70% on Georgia’s $5 per night hotel fee. Hiemstra and Ismail (1993) find 86%, and PwC’s study for the European Commission uses 60% as its baseline. ↩︎
The Scottish Government commissioned a review of the evidence from Jason Li Chen, Gang Li, Anyu Liu and Nigel Morgan at the University of Surrey, published June 2021 as “Review of Evidence of Elasticities Relevant to Tourism in Scotland“. It finds that “the overall median PED for inbound tourism is on the borderline between elastic and inelastic (-1.02), while the overall average PED indicates a relatively elastic demand (-1.26)”, that “between VAT and accommodation occupancy taxes, past literature argues that the latter tend to have a more moderate effect on tourism demand, but they are likely to induce a psychological impact on tourists and could affect repeat tourism”, and that “business travellers and non-coastal holidaymakers tend to have a price-inelastic demand, while leisure travellers particularly coastal holidaymakers are likely to have a price-elastic demand”. But “a significant gap in the existing literature is that there is no direct evidence for Scotland.” That was the position in 2021, before Manchester’s charge had been evaluated. As far as we can find, Manchester is still the only English study, and its £1 charge is smaller than a 5% tax on a typical hotel room. ↩︎
Heffer-Flaata and colleagues study UK travellers and find no statistically significant effect on arrivals in Paris, Milan or Palma de Mallorca, although they find reductions in some smaller destinations. That does not establish that the larger destinations were unaffected. The country-level figures in their Table 4 are regression coefficients, with demand logged and the cash amount of the tax unlogged. They cannot be compared directly with ordinary price elasticities to conclude that visitors respond less to taxes than to other price changes. ↩︎
Gooroochurn and Sinclair built a computable general equilibrium model of Mauritius and concluded that “unlike other levies, tourism taxes can increase domestic welfare since international tourists bear most of the welfare loss associated with higher revenue”, and that “a narrow policy, taxing the highly tourism-intensive sectors, extracts significantly more revenue from tourists than a broader policy where all tourism-related sectors are taxed”. Annals of Tourism Research 32(2), 2005. ↩︎
The central case gives 5.78m fewer nights out of 267.7m taxable nights, and £689m less spending out of £57.0bn. ↩︎
For example, Rosselló and Sansó’s 2017 paper on the Balearic tax forecast a small reduction in total tourist stays. Heffer-Flaata and colleagues subsequently found no statistically significant effect on UK arrivals and described their finding as disagreeing with the earlier predictions. These are different measures and visitor populations. A proper comparison would also need confidence intervals: an insignificant estimate alone does not establish that a small predicted fall was wrong. ↩︎
ONS changed the International Passenger Survey design in July 2024, so the annual 2024 figures combine two methodologies. Its September 2026 update advises against comparing the annual total directly with earlier or later years. ONS has already published provisional figures for the first half of 2025; full-year 2025 estimates are planned for October 2026. The Great Britain Tourism Survey carries the development classification for all years from 2022 onwards. The 2025 domestic trip workbook omits the destination-region field included in the 2024 workbook. It records visitors’ region of residence, which is different. We therefore cannot use it to reproduce our regional breakdown by accommodation type and trip purpose (and the separately published regional totals do not provide that combined breakdown). We can use the trip workbook for an England-wide comparison, but updating the regional model would require additional data or assumptions (and we were reluctant to add further assumptions unnecessarily). Full-year 2025 inbound figures are also not yet available. ↩︎
The methodological note accompanying the Q4 2025 domestic release explains that, before October 2025, a technical fault prevented some respondents from completing the questionnaire after saying they had taken an overnight trip. Fixing it changed the reported patterns of trips, nights and spending. The adjustment factors use information about survey completion and dropout, are calculated by region and quarter, and are applied before standard weighting. In their final form they scale recent data to align it with the historical series. VisitBritain and its partners plan to review the effect on historical estimates. The note gives neither a direction nor a size for any resulting revision. Losing respondents who travelled suggests a possible understatement of trips, but their accommodation choices and spending also factor in. So we cannot infer that taxable accommodation spending, or our estimated receipts, must be revised upwards. ↩︎
We conducted an exploratory substitution of 2025 domestic figures which produced higher receipts. We hoped that could isolate the survey fault, but it did not – prices, travel patterns and accommodation mix also changed between years. ↩︎
VisitBritain’s area column mixes sub-regions, super-regions and “Rest of England” in a single list, so just adding it together means everything is counted three times. Every label is therefore classified by tier and only one tier is summed. We checked that London plus Rest of England equals Total England on the raw data. ↩︎
The one place this is deliberately not done is the calibration in step 3, because the control total it checks against is a published 2024 figure. Both sides of that check stay in 2024 money, and a test asserts it. ↩︎
That is how Scotland’s Act works, confirmed in a Scottish Government freedom of information release: “if the cost of accommodation was £100 and the Visitor Levy was 3% (£3), then the VAT due on this transaction would be calculated on the total amount of £103”. We assume England will follow. ↩︎
The VAT registration threshold is £90,000 of turnover. Essentially every hotel is above it, and a large share of Airbnb hosts and small B&Bs are below it and charge no VAT, so for them there is nothing to strip out. Nothing measures the split, and 85% is our judgment. ↩︎
Bibler, Teltser and Tremblay find booking prices fall 3.2% against an average enforced rate of 11.2%, so about 72%. Collins and Stephenson find about 70% on Georgia’s hotel fee, and report Hiemstra and Ismail (1993) at 86%. PwC’s study for the European Commission uses 60% as its baseline. ↩︎
Canina and Carvell (2005) at −0.13 and Hiemstra and Ismail (1993) at −0.44, both as cited by Collins and Stephenson, who themselves report −0.7 for Georgia hotel rooms. Bibler, Teltser and Tremblay report −0.48 for Airbnb nights. ↩︎
The 75% is a judgment, not a measured result. A visitor who switches from a hotel to friends or family may still make the trip and spend money. Oxford Economics also assume some visitors switch accommodation or make day trips, but their assumptions don’t establish a numerical bound for ours (p.19). Collins and Stephenson suggest cross-border substitution could explain Georgia’s lost hotel nights; they don’t measure what share crossed the border. England also has borders with untaxed destinations. The model offers settings from 25% to 100% to show the significance of this assumption. ↩︎
PwC (2017), p.143: “our elasticities are for the impact on tourism demand to a change in price, rather than more specifically the impact on accommodation demand to a change in price”. Peng, Song, Crouch and Witt (2015) use the destination’s price index relative to the origin’s as the price variable. These estimates concern destination prices, so we do not apply them to a room-price shock. But their measures of demand are not all the same. DCMS’s −0.61 measures overall inbound spending and −1.23 measures inbound holiday spending, not rural holiday visits. Using spending elasticities as visit elasticities assumes constant real spending per visit. Assigning those estimates to “other” and rural holidays, and transferring estimates between overseas and British visitors, are our modelling judgments. Peng’s meta-analysis also combines studies using different demand measures. The results show what follows from these proxy assumptions. ↩︎


Leave a Reply