
We’ve found the first hard evidence that the mansion tax is impacting the property market – house sale prices are bunching just below the £2m mansion tax threshold. Since the tax was announced, the share of nearby sales priced just below £2m has risen sharply, while the share at exactly £2m has fallen.
We think this is evidence of a response to the tax – but possibly a smaller one than the OBR anticipated.
The more significant question is whether the mansion tax has reduced property values more widely. Other than bunching, we see no evidence of this (at least not yet). That’s because available data makes our tests underpowered, and they are simply unable to detect the effects that the OBR expected.
This article is therefore mostly presenting a negative result; however, we feel it’s important to publish negative results as well as positive results. All the code we used for this analysis is available on our GitHub.
There is clear evidence of bunching
The November 2025 Budget introduced the “mansion tax” – formally the “high value council tax surcharge”. It’s an annual charge on homes worth £2m or more, which applies a fixed charge at different thresholds:
| Band (April 2026 value) | Mansion tax |
|---|---|
| Below £2m | None |
| £2m to £2.5m | £2,500 |
| £2.5m to £3.5m | £3,500 |
| £3.5m to £5m | £5,000 |
| £5m+ | £7,500 |
The tax starts in April 2028, but the valuations are as at April 2026.
The tax creates an obvious incentive to claim your value is just below the chargeable thresholds.1 We should expect to see fewer transactions at, for example, £2 million, and more transactions at, for example, £1.99 million. Economists call this a “bunching” effect.
We looked for evidence of bunching by comparing completed sales from December 2025 to July 2026 with the same eight months a year earlier. This chart shows what each £10,000 price band gained or lost, as a share of sales between £1.7m and £2.3m:2
The £10,000 immediately below £2m goes from 0.44% of these sales to 2.27%, roughly five times its previous share. By contrast, we see half as many sales at exactly £2m (from 5.69% to 2.70%). Both changes are larger than we’d expect from chance alone.3
Estate agents Hamptons reported a similar pattern in offers earlier this year. Their report doesn’t give the sample counts or uncertainty estimates needed to assess it statistically.4
How certain is the result?
Prices often cluster at round numbers anyway. We therefore tested whether the change at £2m was unusual, using other round numbers for comparison.
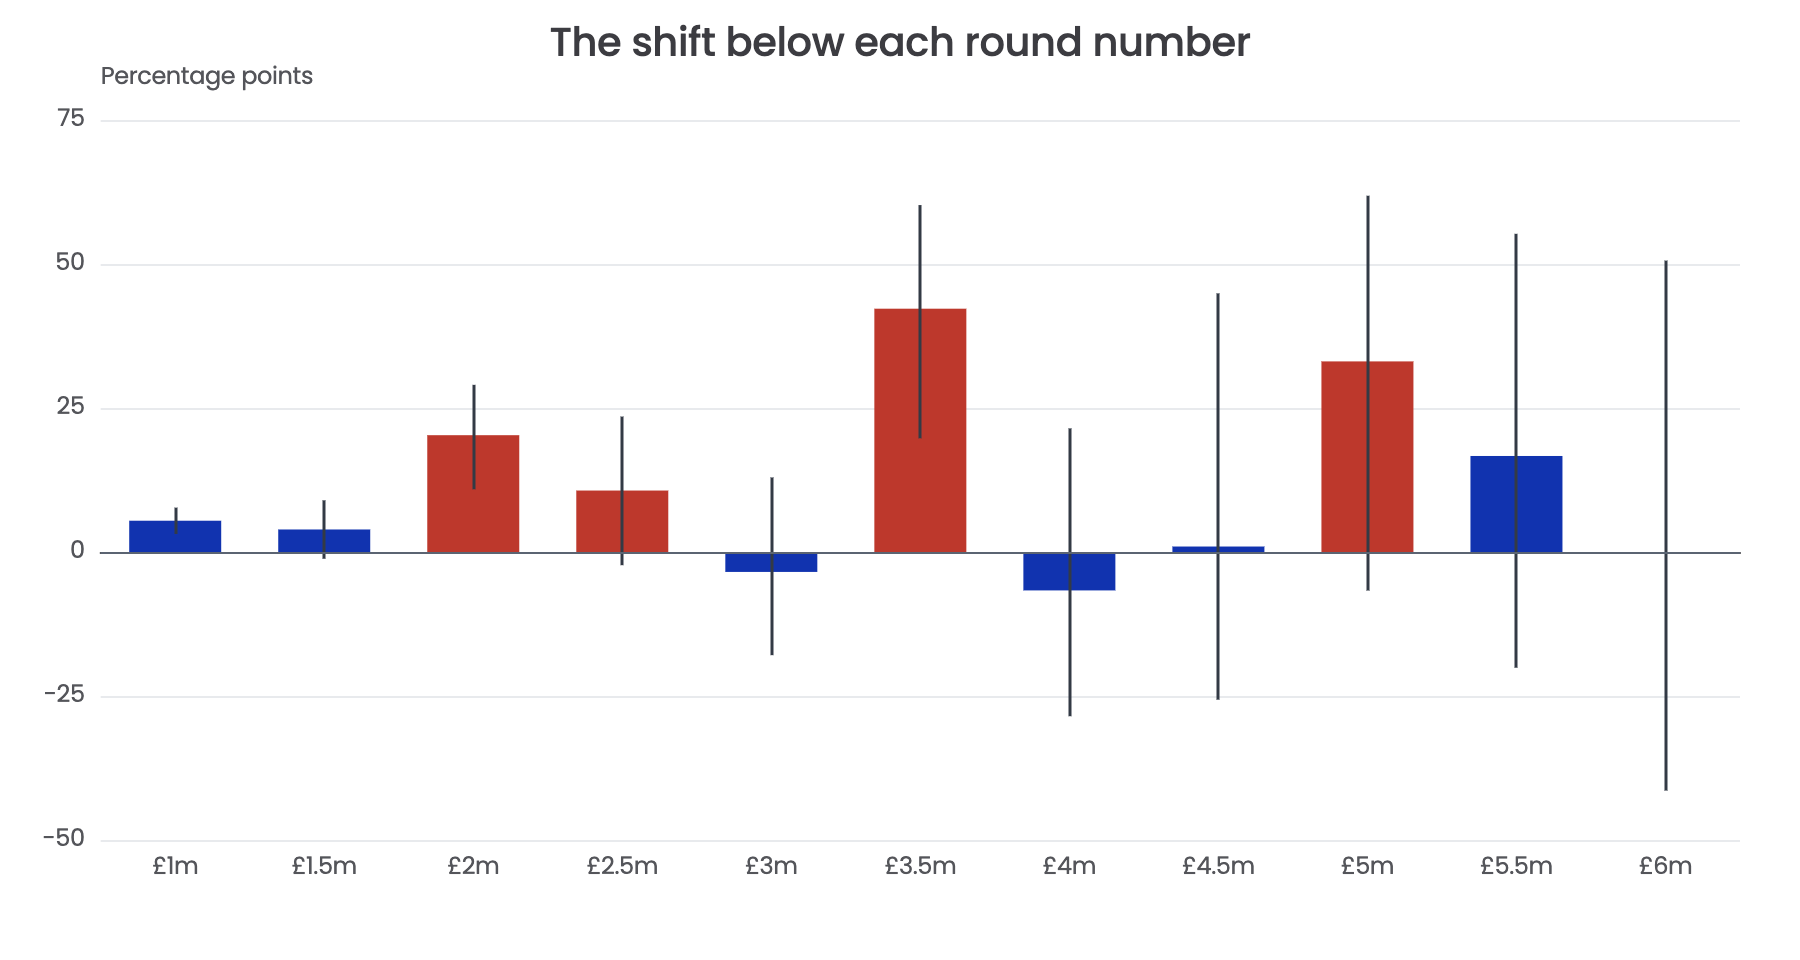
For this test we counted all sales within £62,500 either side of each round number, then asked what proportion fell below that round number – that’s the chart below. The black lines on it (“whiskers”) are the 95% confidence intervals. It’s important we focus on the whiskers and not the bar so that we are not misled by randomness:5
We can say there is probably an effect when the lower end of the confidence interval (the bottom of the whisker) is above the x-axis – we see that at £2m and at £3.5m. We also see it at £1m, where there’s no mansion tax at all, so there may be a small general drift towards pricing below round numbers – but the £2m and £3.5m thresholds see much bigger changes. 6
The shift is stronger in later completions, which is what we’d expect. Conveyancing often takes months; sale prices agreed post-Budget, with an incentive to bunch, would typically be reflected in completions in the Spring.7
What this means for the tax
Selling for £1,999,999 won’t guarantee anyone escapes the charge. The Valuation Office will assess properties using comparable sales and their characteristics; it won’t simply accept the price on the day.8
The OBR anticipated bunching. Our results show it emerging, but cannot tell us whether its eventual forecast is too high or too low. That forecast concerns 2028-29; we’re looking at sales completed by July 2026.9 Possibly we’ll see more bunching as we approach the introduction of the tax.
The OBR expects bunching to reduce the number of properties liable by 1.5%, slightly reducing the receipts from the tax. So if the bunching we’re seeing turns out to be the final result then receipts will be higher than the OBR expects, but by a very small amount – likely single figure £m.10
Have property values fallen more widely?
An annual tax should, in principle, reduce what buyers will pay. Economists call this “capitalisation”. The OBR assumes the full effect reaches prices by 2028-29.11
We compared repeat sales of the same properties. For one local estimate, the 95% interval runs from a 2.7% fall to an 11.3% rise. That’s too wide to distinguish a modest fall from no change, and the estimate depends on how we model it.12
Expensive homes also account for a smaller share of all sales. The falls are larger in the mansion tax bands, but the two untaxed bands below £2m have fallen too:13
All six bands had lower shares in 2025 than in 2023. The decline was already under way before the announcement, and incomplete registration makes the 2026 figures particularly difficult to interpret:14
Restricting the comparison to December-to-March completions reduces the registration problem. Then we see the % priced at £2m or more falling by almost exactly the same amount before and after the announcement. So we still can’t isolate the tax’s effect.15
We therefore can’t yet measure the wider effect on property values, transaction volumes or tax receipts.16
We’ll return to this next year, so we can test whether theoretical estimates of capitalisation effects turn out to reflect reality. 17
All the code used for our analysis is available on our GitHub.
Many thanks to P for help with the analysis.
What if Andy Burnham lowered the mansion tax threshold to £1.5m?
The mansion tax map: where the money comes from
Did Manchester City cheat HMRC out of £12m?
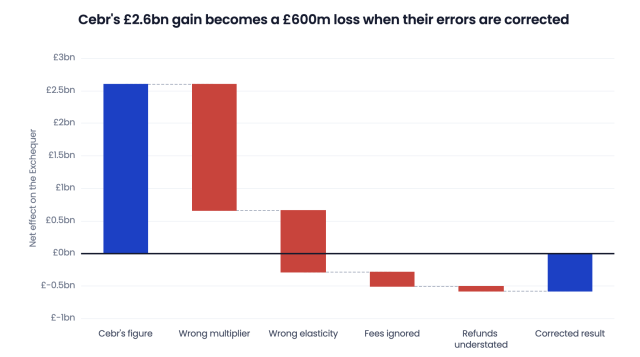
A £2.6bn lobbyist fairytale: economic consultancy Cebr sold VAT-free shopping as a tax cut that pays for itself
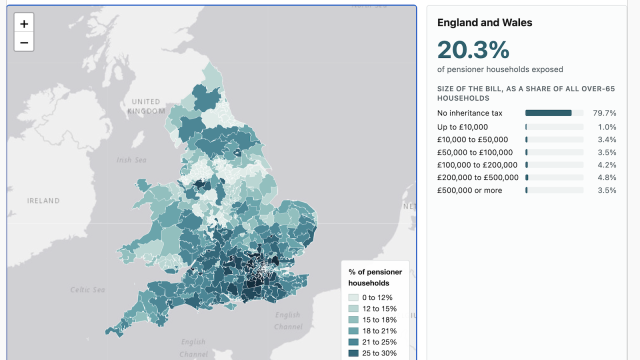
The hidden reach of inheritance tax: one in five pensioner households
How complex is the corporation tax return? And is it getting worse?
Footnotes
On one level, people are making a mistake, because HMRC will value the property – they won’t just accept the number you put down. Selling for £1,999,999 won’t guarantee you escape the tax Annex B of the consultation says the Valuation Office will use comparable sales and property characteristics, and will not rely solely on an individual sale price. But people may not appreciate that; they may also think (perhaps correctly) that any valuation process will use the sale price as its starting point. ↩︎
HM Land Registry’s July 2026 Price Paid Data release, published on 28 August and downloaded on 19 September. Our sample is standard category A sales of existing homes in England. The chart covers 2,056 sales before the announcement and 925 afterwards, with the upper endpoint of £2.3m excluded. It plots changes in each band’s share, in percentage points, rather than changes in counts: the later period has fewer registered transactions. ↩︎
The counts immediately below £2m are 9/2,056 before and 21/925 after: an increase of 1.83 percentage points, with a 95% Newcombe confidence interval of 0.96 to 3.03 points. At exactly £2m the counts are 117/2,056 and 25/925: a fall of 2.99 points, with an interval of 1.43 to 4.38 points. ↩︎
Hamptons’ Spring 2026 Market Insight report, printed pages 14 and 15, and its earlier article discuss offers and asking prices. Neither publishes a reproducible statistical method for that comparison. Our analysis uses completed sales registered with HM Land Registry. ↩︎
At £2m that proportion rose from 43.5% to 63.8%, an increase of 20.3 percentage points. The 95% confidence interval runs from 10.9 to 29.0 points. The result is not sensitive to the precise size of the “window” – narrower and wider windows than £62,500 also show a positive change at £2m. ↩︎
The £1m below-threshold share rises by 5.4 percentage points. The excess change at £2m relative to £1m is 14.9 points, with an approximate 95% interval of 5.4 to 24.3. At £3.5m the counts below the threshold are 11/57 before and 16/26 after, a rise of 42.2 points (19.7 to 60.2). Pooling the four tax thresholds by inverse variance gives 20.3 points (13.3 to 27.3); pooling the seven comparison round numbers shown gives 5.0 (2.9 to 7.0). The excess pooled change is 15.3 points (8.0 to 22.6), conditional on treating those prices as valid comparisons. Cochran’s Q is 6.52 on 3 degrees of freedom, p=0.09: the data is consistent with a common change across the four tax thresholds, but that hypothesis is not established. ↩︎
Using the same £62,500 half-window at £2m, December-to-March completions give 106/213 before and 58/97 after: a rise of 10.0 points, with a 95% interval from -1.9 to 21.4. For the separate April-to-July periods, the counts are 64/178 and 37/52: a rise of 35.2 points (19.9 to 47.7). ↩︎
See Annex B of the consultation. Sale prices are evidence of market value, but they are not the property’s final tax band. ↩︎
The OBR costing, paragraphs 1.9 to 1.12, applies behavioural adjustments sequentially. After capitalisation, it assumes properties within the modelled bunching range above a boundary move into the lower band. At £2m that range is £62,500. Our observed share at or above £2m falls from 221/391 (56.5%) to 54/149 (36.2%), but this is not a measurement of the fraction of counterfactual properties that moved. Nor can a result for transactions identify the response of the whole stock of properties. ↩︎
The OBR costing attributes a 3.8% reduction in liable properties to capitalisation and 0.2% to supply responses in 2028-29. Table 1.5 puts the combined direct revenue reduction from capitalisation, bunching and supply at £30m a year from 2028-29. ↩︎
Paragraph 1.10 of the costing assumes the annual charge continues indefinitely and discounts it at 5%. On that basis £7,500 a year has a present value of £150,000, or 3% of £5m; at a 3% discount rate it would be £250,000, or 5%. The pace of adjustment is uncertain. Sellers may resist accepting lower prices, reducing transactions instead. The OBR already allows for this: paragraph 1.14 assumes a 1% to 2% reduction in baseline transactions for three years due to loss aversion. For scale, standard residential stamp duty on a £5m purchase is £513,750, rising to £763,750 where the additional-property rates apply. Replacing a main residence can avoid that surcharge; non-resident rates can add a further charge. See HMRC’s rates and conditions. ↩︎
We matched addresses, property types and tenures, and used earlier prices uprated by local house-price indices as a proxy for tax exposure. The local model covers predicted values from £1.5m to £2.5m and allows separate price slopes before and after the announcement. Its point estimate is +4.1%, with a 95% interval from -2.7% to +11.3%, using the July 2026 HPI, released on 16 September. Other specifications give different estimates. These intervals do not capture all uncertainty from the exposure proxy, changes to the properties or which homes sell again. ↩︎
The denominator here is all standard category A existing-home sales in England at any price: 465,677 before and 314,938 after. In the same December-to-July periods, the untaxed £1m-to-£1.5m and £1.5m-to-£2m bands fall by 29% and 31% in relative terms; the four tax bands fall by between 38% and 50%. The share at £2m or more falls from 0.527% to 0.312%. Bands include their lower boundary and exclude their upper boundary. ↩︎
These are non-overlapping bands as shares of all qualifying sales. The 2026 points cover January to July and are hollow because many sales remain unregistered. Expensive properties have longer registration delays in our data, which can exaggerate their apparent decline. The vertical axis is logarithmic, so equal vertical moves represent equal proportional changes. Whiskers show 95% Wilson intervals for chance variation. ↩︎
Including exact £2m sales, the shares are 1,027/180,442 (0.569%) in December 2023 to March 2024, 1,277/276,682 (0.462%) in December 2024 to March 2025, and 654/183,382 (0.357%) in December 2025 to March 2026. The successive falls are 0.108 and 0.105 percentage points, using unrounded shares. All denominators include qualifying sales at every price. ↩︎
Our volume estimates depend on assumptions about registration delays and their stability over time. The OBR’s Table 1.5 forecasts losses across other taxes of £120m in 2026-27 and £155m in 2027-28, before surcharge receipts begin. Paragraph 1.14 includes both price and transaction effects across several taxes; the table does not identify how much of those totals is stamp duty lost through changes in transaction timing. ↩︎
They might not, for two reasons.
First, capitalisation calculations assume people are rational calculating machines. Obviously they are not. Stamp duty on a £5m property is at least £513,750. When someone’s paying this much up-front, their reaction to an ongoing £7.5k charge may be to shrug rather than whip out a spreadsheet and calculate the NPV.
Second, house prices don’t always behave rationally. Whilst people can have an emotional reaction to taxes on property, they also often have an emotional reaction to the price of their house, and will not readily accept less than they have decided it’s worth. House prices therefore tend to be “sticky” and not fall when, in a rational world, they should. People instead complain that they can’t sell their property when what’s really happening is that the property is overpriced. The result is that transaction volumes drop and, over time, house prices fall in real terms, as the price is eroded by inflation, but not in cash terms, so people feel better about it. So it is plausible that we will not, in fact, see a fall in the value of property affected by the mansion tax, but instead a fall in transaction volumes. ↩︎

Leave a Reply