Photo of a polling station sign outside a church on a UK street: A rectangular white sign with bold black text reading 'POLLING STATION' stands on metal legs beside the ramped entrance of a stone church building. In the background, a road lined with parked cars stretches down a residential street of light-coloured terraced townhouses.

The public’s surprising choice of tax increase, and why we should ignore it

26 October 2024

24 Comments

Gabriel Milland of Portland Communications has published polling conducted by the Portland research team in early October. Gabriel takes some interesting political conclusions from the polling (and I’d recommend his article). However, my focus is what the polling says about tax policy, and about polling on tax policy.

Amended to include the answers – apologies for missing this out first time

What do people want?

Here’s the result of asking the public which tax they’d prefer to put up:
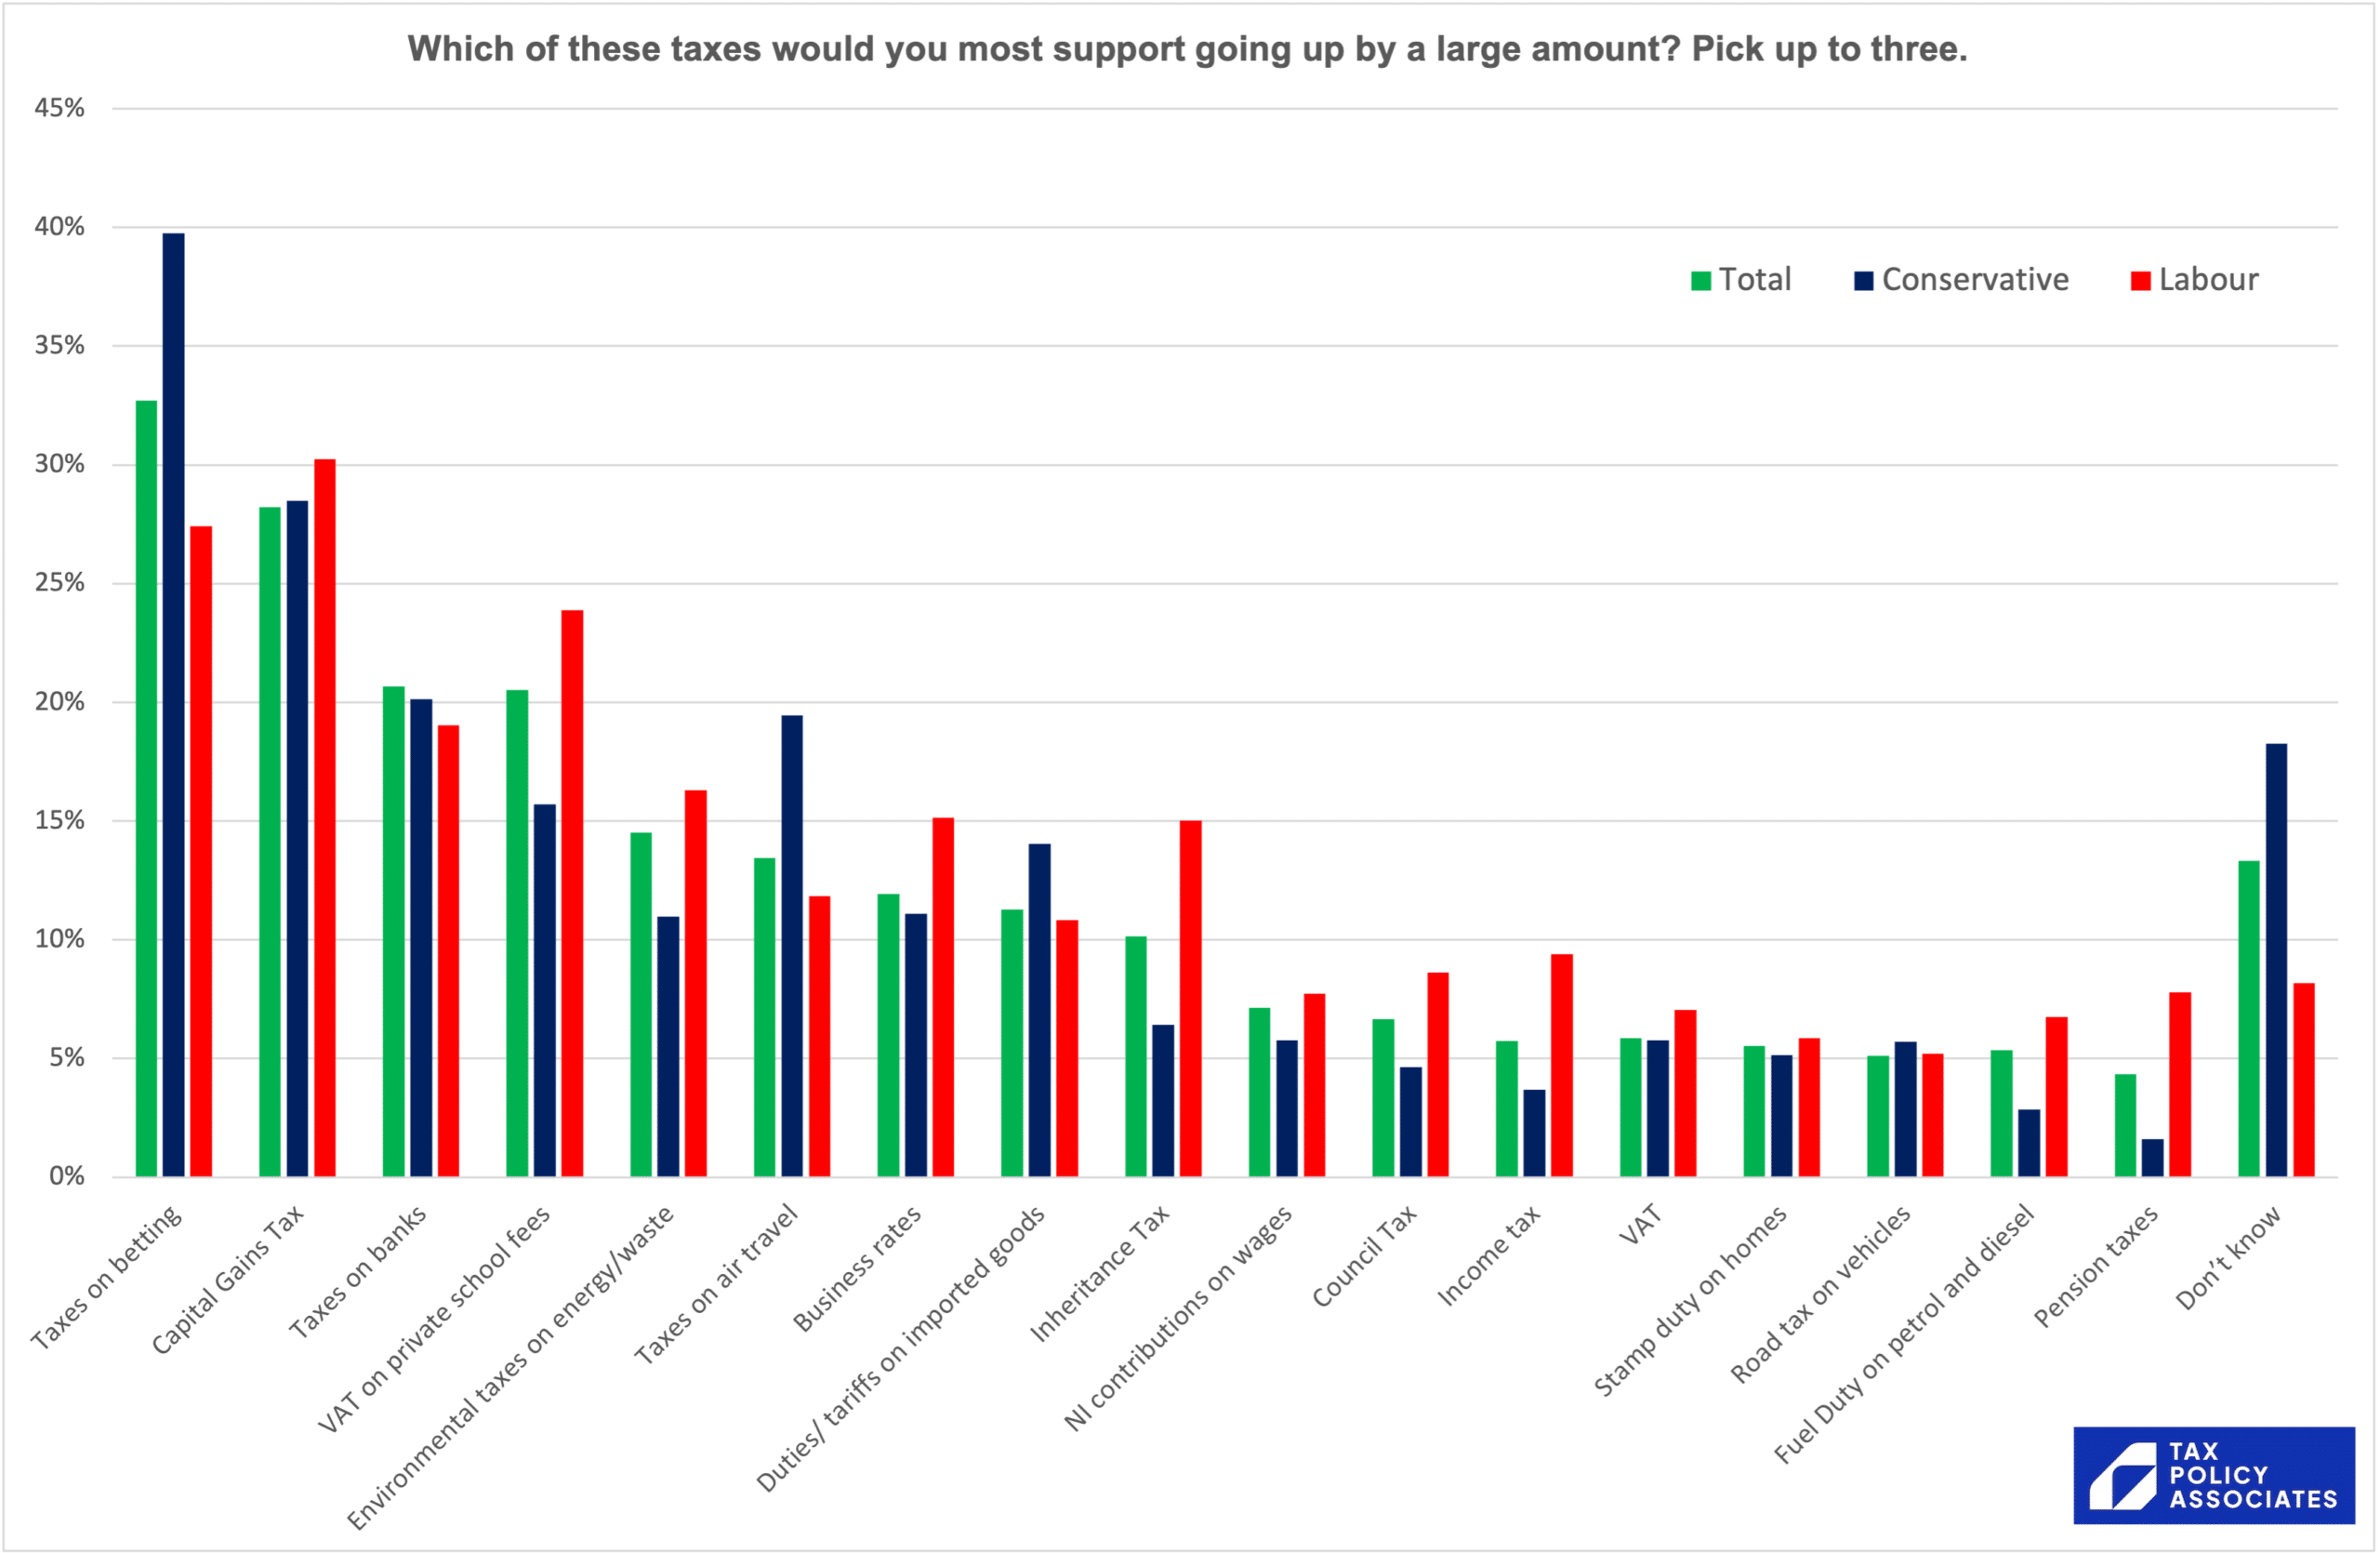
Grouped bar chart showing public support for various taxes going up by a large amount, broken down by total respondents, Conservative voters, and Labour voters: Taxes on betting (33% overall) and Capital Gains Tax (28% overall) received the highest support for a large increase, followed by taxes on banks and VAT on private school fees. Conservative voters most favoured raising betting taxes (40%), whereas Labour voters favoured Capital Gains Tax (30%) and VAT on private school fees (24%). Broad-based taxes including Income Tax, VAT, National Insurance, Council Tax, Fuel Duty, and pension taxes all received less than 10% support across each voter group.

Which of these taxes would you most support going up by a large amount? Pick up to three.

Y-axis: 0% to 45% in 5% increments.

Series: Total, Conservative, Labour.

Taxes on betting: Total 33%, Conservative 40%, Labour 27%
Capital Gains Tax: Total 28%, Conservative 28.5%, Labour 30%
Taxes on banks: Total 20.5%, Conservative 20%, Labour 19%
VAT on private school fees: Total 20.5%, Conservative 15.5%, Labour 24%
Environmental taxes on energy/waste: Total 14.5%, Conservative 11%, Labour 16%
Taxes on air travel: Total 13.5%, Conservative 19.5%, Labour 12%
Business rates: Total 12%, Conservative 11%, Labour 15%
Duties/ tariffs on imported goods: Total 11%, Conservative 14%, Labour 11%
Inheritance Tax: Total 10%, Conservative 6.5%, Labour 15%
NI contributions on wages: Total 7%, Conservative 6%, Labour 8%
Council Tax: Total 7%, Conservative 5%, Labour 9%
Income tax: Total 6%, Conservative 4%, Labour 9.5%
VAT: Total 6%, Conservative 6%, Labour 7%
Stamp duty on homes: Total 5.5%, Conservative 5%, Labour 6%
Road tax on vehicles: Total 5%, Conservative 6%, Labour 5%
Fuel Duty on petrol and diesel: Total 5%, Conservative 3%, Labour 7%
Pension taxes: Total 4%, Conservative 2%, Labour 8%
Don't know: Total 13%, Conservative 18%, Labour 8%

Logo: TAX POLICY ASSOCIATES

It’s a surprising win for taxes on betting, with Conservative voters in particular strongly in favour. Capital gains tax runs a close second, and bank taxes and VAT on private schools are tied for third.

And who do the public think should take the burden of any tax rises?

Bar chart of survey responses showing which groups the public thinks should pay more tax, broken down by political affiliation: The most widely supported targets for tax increases are the well paid (earning over £75k, at 46%) and owners of multiple properties (41%). Labour voters consistently favour higher taxes on specific groups more than Conservative voters do, while 19% of Conservative voters believe taxes should not be increased for anyone, compared to just 5% of Labour voters.

Who out of the following, if any, do you think should pay more tax? Please select up to three.

Y-axis: 0% to 50% (5% increments)
Series: Total (green), Conservative (navy), Labour (red)

Those who are well paid (e g those getting paid £75k a year or more):
- Total: 46%
- Conservative: 42%
- Labour: 45%

People who own a lot of property (eg second houses which they rent out):
- Total: 41%
- Conservative: 39%
- Labour: 43%

People who have a lot of money but keep it overseas (non-doms):
- Total: 28%
- Conservative: 23%
- Labour: 30%

Businesses:
- Total: 26%
- Conservative: 23%
- Labour: 30%

Those who own lots of shares in businesses:
- Total: 25%
- Conservative: 23%
- Labour: 29%

People with large pensions:
- Total: 11%
- Conservative: 9%
- Labour: 12%

People who inherit property:
- Total: 11%
- Conservative: 7%
- Labour: 17%

My family and me:
- Total: 9%
- Conservative: 4%
- Labour: 11%

Don't know:
- Total: 5%
- Conservative: 6%
- Labour: 4%

None of the above - taxes should not be increased for anyone:
- Total: 10%
- Conservative: 19%
- Labour: 5%

Logo: TAX POLICY ASSOCIATES

People who are not them. Specifically, people earning £75k, second home-owners, non-doms, businesses and shareholders.

About a quarter want to increase taxes on business. But, if we focus on business tax specifically (and ask the question in a certain way), there’s a large majority that’s against raising business tax, because they think the cost will be passed on to them:

Grouped bar chart showing public opinions on whether business tax rises are passed on to consumers or reduce personal tax burdens, broken down by party support: A clear majority of respondents (around 61% overall, including 73% of Conservatives and 58% of Labour supporters) agree that if taxes rise on businesses, the costs are passed on to ordinary people. In contrast, only around 20% overall (16% Conservative and 24% Labour) believe higher business taxes mean they have to pay less tax personally.

Title: Which statement reflects your views most closely?

Y-axis: 0% to 80% in 10% increments

Categories and approximate values:

If taxes go up on businesses, the costs are passed on to ordinary people like me:
- Total: 61%
- Conservative: 73%
- Labour: 58%

If taxes go up on businesses, that means less tax that I have to pay:
- Total: 20%
- Conservative: 16%
- Labour: 24%

Neither of these statements reflect my views:
- Total: 13%
- Conservative: 7%
- Labour: 11%

Don't know:
- Total: 6%
- Conservative: 4%
- Labour: 6%

Legend: Total (green), Conservative (navy blue), Labour (red)
Logo: TAX POLICY ASSOCIATES

Should we pay attention to these results?

In my view we should not, for two reasons.

First, there is widespread misunderstanding of tax and spending.

Portland asked respondents to list the top three things Government spends money on:

Grouped bar chart showing public perceptions of what the UK government spends the most tax money on, by party support: The NHS and social care was chosen as a top three spending area by the most respondents (around 37%), followed by spending on migrants and asylum seekers (around 27%) and interest on government debt (around 27%). Around 22% of respondents mistakenly selected expenses for MPs and around 20% selected overseas aid as among the highest areas of government tax expenditure.

Looking at the list below, please choose the top three things on which you believe that the government spends the most money from tax?

Vertical axis: Percentage (0% to 50%)
Series: Total (green), Conservative (dark blue), Labour (red)

Approximate values from the chart:
- The NHS and social care: Total 37%, Conservative 45%, Labour 40%
- Spending on migrants and asylum seekers: Total 27%, Conservative 29%, Labour 20%
- Interest on government debt: Total 27%, Conservative 33%, Labour 27%
- Expenses for MPs: Total 22%, Conservative 19%, Labour 18%
- Overseas aid: Total 20%, Conservative 19%, Labour 14%
- Benefits for people of working age who can’t find a job: Total 17%, Conservative 19%, Labour 19%
- Benefits for people of working age who have been signed off sick: Total 15%, Conservative 16%, Labour 14%
- State pensions: Total 16%, Conservative 18%, Labour 13%
- Moving to greener energy sources like wind, solar and nuclear: Total 15%, Conservative 11%, Labour 15%
- The Armed Forces: Total 14%, Conservative 12%, Labour 16%
- Roads, railways and buses: Total 11%, Conservative 10%, Labour 14%
- Schools and universities: Total 11%, Conservative 12%, Labour 14%
- Services provided by councils like bin collections: Total 8%, Conservative 7%, Labour 8%
- Childcare: Total 7%, Conservative 8%, Labour 11%
- Don’t know: Total 7%, Conservative 7%, Labour 7%

Total Government spending is around £1,200bn. Spending on asylum seekers and migrants amounts to about £4bn (0.3% of all spending). Spending on MPs’ expenses and staff costs amounts to about £150m each year (0.01% of all spending).

Here’s an approximate chart with the actual figures, thanks to ten minutes of very fast work by Maxwell Marlow. Maxwell stresses that we shouldn’t treat it as more than indicative:

Bar chart of approximate actual UK government expenditure in 2023 by category: Health is by far the largest expenditure category at £212bn, followed by state pensions (£141bn), local government (£130bn), social security (£118bn), and education (£106bn). By contrast, overseas aid (£15bn), childcare (£8bn), asylum and migrants (£3bn), and MP costs (£0.1bn) constitute very small fractions of total spending.

Approximate actual government expenditure 2023

Y-axis: £0bn to £250bn (in increments of £50bn)

Health: £212bn
State pensions: £141bn
Local government: £130bn
Social security: £118bn
Education: £106bn
Debt interest: £97bn
Defence: £56bn
Transport: £41bn
DESNZ: £38bn
Overseas Aid: £15bn
Childcare: £8bn
Asylum and migrants: £3bn
MP cost: £0.1bn

So why do people think that MPs’ expenses are in the top three spending items, when they’re not in the top three hundred?

Because most people don’t understand the size of the Government budget. Only one in six people got the right order of magnitude:

Bar chart showing survey responses on public estimates of annual UK government spending, broken down by total respondents, Conservative voters, and Labour voters: Only around 16% of respondents correctly identified that government annual spending is closest to £1 trillion. The most frequent specific estimate was £100 billion at 23% (27% among Labour voters, 22% among Conservatives), while 26% answered 'Don't know'.

Which figure do you believe is closest to the amount of money the government spends every year? This includes things like the NHS, welfare, schools, etc

Vertical axis: 0% to 30%, in intervals of 5%
Horizontal axis: spending options
Legend: Total (green), Conservative (dark blue), Labour (red)

Estimated values:
£100 billion: Total ~23%, Conservative ~22%, Labour ~27%
£1 trillion: Total ~16%, Conservative ~15%, Labour ~14%
£10 trillion: Total ~12%, Conservative ~11%, Labour ~13%
£10 billion: Total ~11%, Conservative ~10%, Labour ~12%
£100 trillion: Total ~7%, Conservative ~8%, Labour ~8%
£100 million: Total ~4%, Conservative ~4%, Labour ~5%
Other: Total ~1%, Conservative ~2%, Labour ~1%
Don't know: Total ~26%, Conservative ~28%, Labour ~20%

Logo: TAX POLICY ASSOCIATES

The correct answer is £1 trillion (more precisely, around £1.2 trillion).

And this result in turn may be because most of the population don’t understand billions and trillions:

Two side-by-side bar charts showing survey responses to "How many millions are there in a billion?" and "How many billions are there in a trillion?", broken down by party support: Only around 40% to 45% of respondents correctly answered that there are a thousand millions in a billion and a thousand billions in a trillion. A substantial proportion incorrectly believed the answer was a hundred or a million, or responded that they did not know. In both questions, Conservative voters were slightly more likely to give the correct answer than Labour voters.

Chart 1: How many millions are there in a billion?
Y-axis: 0% to 50% in 5% intervals
Series: Total (green), Conservative (navy), Labour (red)

A thousand:
Total: 43%
Conservative: 45%
Labour: 42%

A hundred:
Total: 21%
Conservative: 20%
Labour: 26%

A million:
Total: 17%
Conservative: 22%
Labour: 14%

Ten:
Total: 8%
Conservative: 6%
Labour: 8%

Don't know:
Total: 11%
Conservative: 8%
Labour: 10%

Logo: TAX POLICY ASSOCIATES

---

Chart 2: How many billions are there in a trillion?
Y-axis: 0% to 50% in 5% intervals
Series: Total (green), Conservative (navy), Labour (red)

A thousand:
Total: 40%
Conservative: 45%
Labour: 37%

A hundred:
Total: 17%
Conservative: 19%
Labour: 17%

A million:
Total: 17%
Conservative: 14%
Labour: 14%

Ten:
Total: 9%
Conservative: 8%
Labour: 13%

Don't know:
Total: 17%
Conservative: 14%
Labour: 18%

Logo: TAX POLICY ASSOCIATES

There are a thousand millions in a billion, and a thousand billions in a trillion.

And there is also widespread misunderstanding of one of the simplest feature of the income tax system – the way that bands work:

Bar chart of public polling on how income tax applies to someone earning £100,000 in England, broken down by party support: Only 43% of respondents correctly understood that income tax is banded (0% on some, 20% on some, and 40% on some), while 39% incorrectly believed that 40% applies to everything earned. Conservative voters were more likely to answer correctly (49%) than Labour voters (42%).

Title: In the UK, income tax is currently “banded” with different rates for different levels of earnings. Rates are the same in England, Wales and Northern Ireland but slightly different in Scotland. If someone living in England earns £100,000 a year, do they pay.

Y-axis: 0% to 60%, in increments of 10%.

Legend: Total (green), Conservative (dark blue), Labour (red).

The higher rate of 40% income tax on everything they earn:
- Total: ~39%
- Conservative: ~39%
- Labour: ~42%

The zero rate of 0% on some of it, the basic rate of 20% on some of it and the higher rate of 40% on some it:
- Total: ~43%
- Conservative: ~49%
- Labour: ~42%

Don’t know:
- Total: ~19%
- Conservative: ~13%
- Labour: ~15%

Bottom right: Tax Policy Associates logo.

The second answer is correct. You pay 40% tax on your income above the 40% band (which for most people is £50,000, but that threshold drops for high earners as the personal allowance is reduced).

This reflects our earlier polling – the question is intentionally different from last time, but the result is consistent.

I’d repeat our earlier point that there is a risk this is changing peoples’ real world behaviour – for example causing some people to turn away work for fear of entering the 40% tax band. It would seem prudent for HMRC to investigate if there is a real effect here.

Second, these are three second conversations

Tony Blair talked about the fallacy of polling individual policies and thinking that you’re learning something from peoples’ three second take on complex issues. In the real world, they may have a different view after a thirty second conversation, and a very different view after a three minute conversation. Blair’s point was that election campaigns, where policies are contested, are likely to reflect the three minute view more than the thirty second view (where policies are presented without context).

So, for example, we suspect that the popularity of raising tax on people earning £75k would fall upon realisation that their marginal rate is already often pushing 60% (you can check yours with the tax calculator we published in October 2026). The consistent popularity of wealth taxes would be unlikely to survive presentation of the history of faliure of previous wealth taxes. People may be attracted to the idea of charging VAT on private school fees, but the amount it raises is economically insignificant. And that interesting finding about the unpopularity of tax on business may well be significantly influenced by the very “three second” framing with which it was presented.

Should we ignore popular views of tax?

If most people don’t understand the tax system, or government funding, should tax policy simply ignore popular views of tax and the tax system?

That would be a mistake, and perhaps even dangerous. Our political system, and our tax system, needs popular consent. And ignoring popular views on tax would give space for populists, of Left and Right, to pursue tax policies that could be highly destructive.

Tax policy therefore has to be informed by the public mood – but it shouldn’t be led by three second conversations, which confuse public sentiment for public opinion. And tax policy, and tax educators, should seek to challenge popular misapprehensions.

However there is a wider problem.

Robert Colville recently wrote in The Times that much bad tax policy is driven by politicians’ fear that they can’t tell voters the truth about the real constraints on tax and spending. He may be right. But how can politicians tell voters the truth about what may have to change, if voters don’t understand the basics of how things work at the moment?

It seems trite and inadequate to say that we need more education around finance and tax. Right now I don’t have any other suggestions.


Many thanks to Gabriel Milland and Portland Communications – they ran the tax band question, and shared with polling data with us, entirely pro bono.

Photo by Red Dot on Unsplash.

Footnotes

  1. Who already face a top marginal rate of almost 60% ↩︎

  2. It comes out of the foreign aid budget ↩︎

  3. This is a better result than we’d expect if people were guessing (a z-score of approximately 3.355 corresponds to a p-value less than 0.001), but still depressing. ↩︎

  4. The UK used to use a “long billion” of a million millions, but that ceased being used for Government statistics in 1975. We can probably discard the possibility that some of the wrong answers are from people remembering the old billion, because the results vary little across age groups. ↩︎

  5. If you look at the data, linked in Gabriel’s article, people on higher incomes, the self-employed and graduates are more likely to know the correct answer, but not by much. Some of the subgroups have samples too small to be statistically significant. ↩︎

24 responses to “The public’s surprising choice of tax increase, and why we should ignore it”

  1. Pete Dyson avatar

    What’s the survey sampling and methodology? Have I missed it, or why is it not explained?

    1. Dan avatar

      see the Portland Communications piece which has the full crosstabs

      1. Pete Dyson avatar

        I did see that, but doesn’t answer the question about the methodology (sampling/recruitment/survey design).

        For your own articles using their data, I think adding that description will add credibility.

  2. anita monteith avatar
    anita monteith

    Look at the charts in Annex B of the ‘Red Book’ published with each Budget. This gives a good overview of where the money comes from and the areas where it is spent
    For the last one see https://www.gov.uk/government/publications/spring-budget-2023/spring-budget-2023-html#annex-a-financing

  3. Colin avatar

    Imho, a key issue is “horizontal” tax equity, as well as the need to extract money from the economy (as tax – which ‘destroys’ money) in order to avoid inflation from too much government spending and too much credit money creation. (Noting that government spending is pretty important and really shouldn’t be cut, given the dire state of so many services and infrastructure).
    Horizontal equity means taxing UNearned income at the same rates as earnings, not burdening employment with more NI.
    How is it that ex PM Sunak paid 23% of his income of £2 million as tax? That’s the same overall rate as someone paying PAYE on earnings of £55,000.

  4. Naeem Shareef avatar
    Naeem Shareef

    If we had run our finances like the government did such as the incredibly high waste on ‘bad’ spending such as furlough fraud,bounce back loan fraud, government ‘mates’ being paid handsomely for PPE etc, we would feel the full impact of insolvency law. As a Chartered Accountant, it was mind bogling that there were no checks on BB loans and this was a disaster in the waiting. You wonder what ministers do.
    There is ’cause and effect’. If you spend less, you tax less. So you need to cut spending AND lower the tax increase.

  5. Catherine avatar

    Interesting article but would have benefitted from some context on what the accurate answers were. On the top 3 things the government spend money on I could spot some of the obvious ones scoring too highly, though wasn’t sure what the biggest 3 would be. Having tried to find out, it looks like the biggest chunk at 24.3% is ‘other’, so I’m not really any better informed! https://ifs.org.uk/taxlab/taxlab-key-questions/what-does-government-spend-money

  6. Interested tax adviser avatar
    Interested tax adviser

    What actually are the top 3 from that list? I have found a pie chart here but it doesn’t correspond quite to the items on the chart.
    https://ifs.org.uk/taxlab/taxlab-key-questions/what-does-government-spend-money

  7. Ian avatar

    No measure affecting only a small cohort will raise much revenue. There is no choice but to hit the largest population with higher Employers NI rates. It’s the only way Labour can spin the manifesto pledge not to increase taxes on working people – it will be paid mainly by Employers & entirely by Off-Payroll workers & subsequently recouped by higher prices/lower wages. Meanwhile base rates have risen due to Reeves meddling with fiscal rules to justify substantially higher borrowing. And she criticised Liz Truss !!!

  8. Tim avatar

    Hi Dan, I popped this question on the hellsite formerly known as twitter too, but appreciate you get a lot of notifications so may be hard to swim through the sludge.

    On just a couple of these charts, the total %’s are higher than the greater of conservative or labour, and some where the total is lower than the lesser of either. I initially thought that was a possible error in the chart, but I wonder if voters for other parties were included but not split out? If so, we can infer that the “other” categories views are stronger than either of the two largest parties one way or the other. Thanks.

    1. Dan avatar

      Hi – yes, that’s correct – other parties aren’t broken out because the numbers get too small for statistical significance. It’s in the linked spreadsheet.

  9. James avatar

    “It seems trite and inadequate to say that we need more education around finance and tax” – So possibly provide the actual figures for eg government spending alongside the public perception?!

    It is claimed that there is a direct correlation between income tax and democracy (ie if you’re parting with your hard earned cash, you want to know how it is spent.) That doesn’t appear to be bourne out by this polling.

    1. Joe avatar

      The median worker in the UK actually pays a fairly low rate of tax compared to other countries.

      There’s a good article by the IFS that demonstrates this: https://ifs.org.uk/taxlab/taxlab-key-questions/how-do-uk-tax-revenues-compare-internationally

      “The average tax rate (incorporating income tax and SSCs) on median full-time earnings in the UK was 28% in 2016–17 (the year for which this analysis was undertaken). This is much lower than it would have been under the tax systems of the other countries shown in the chart, for which the average was 44%.”

      So I think there’s a good argument to make that increasing the tax base (which is going to happen anyway with frozen thresholds until 2028+) is going to help in terms of the public educating themselves on how their tax is spent as more people are pulled into paying tax/at a higher rate.

      It’s also a good argument for scrapping the nil-rate tax band and introducing a nominal 5-10% rate of tax on all earnings – if everyone in the country is paying in, everyone would be more engaged with what they are getting out.

  10. Jane Northcote avatar
    Jane Northcote

    Very interesting charts. So that I can check my answers and educate myself, could you possibly publish the correct answers to the interesting questions you pose about tax and Government spending? (the top three things on which the government spends the most money from tax, the size of government spending, how much tax someone earning £100000 pays).

    1. Dan avatar

      yes, I should have done that. About to update!

  11. John Toon avatar

    I guess the confusion over billions and trillions is uniquely intrinsic to being British. After all a British billion/trillion isn’t the same as the billions/trillions that are used in finance (occasionally referred to as US billions/trillions)

    1. Dan avatar

      the “British billion” ended official use in 1975. I think that would be a good explanation if we saw older people disproportionately making the mistake… in fact it’s broadly equal across age groups. See the spreadsheet.

  12. Jas avatar

    Thanks Dan. Unfortunately you don’t show us details of what is actually spent. I suspect the waste is staggering. Handing your money over as a blank cheque to a here today gone tomorrow ideologue is not an ideal scenario. The truth is we should be given a choice where our money is spent not be vulnerable to to the arbitrary diktats of Rachel from Accounts. I also sense a condescending undertone to your article. The politicos adopt a similar snobbery. Perhaps why they are so despised.

  13. Steve D avatar

    Hi Dan, it’s estimated that 1 in 50 cars and rising doesn’t pay ved which costing £120m pa, if the Gov’t scrapped ved and put say £0.05 on a litre of fuel then high mileage drivers like me would pay more, i currently do 23k @55mpg paying £20pa ved but my son does 1k @40mpg paying £140pa, putting it on fuel ensures everyone pays proportionately to the environmental damage of emissions and may help road safety.

    1. Roberto Zanconato avatar
      Roberto Zanconato

      Tax on fuel is not going to work in the long term. I’m fortunate to have an EV and charge either from Solar or overnight cheap rate. An extra few pence on fuel duty would not make any difference to me. Eventually, it will have be done on actual annual road mileage.

  14. Phineas Campbell avatar
    Phineas Campbell

    If you have a funded pension, and there is legislation that your employer provides you with one, its assets will be held offshore, not to avoid tax but to delay it

  15. Simon Heape avatar

    Interesting charts & insights thanks Dan.
    Personally I’d like to see higher tax on super high earners to allow those on lower incomes to keep more of their earnings but need your help with the maths. So:
    If base rate was increased from £12,570 to £16k and 40% & 45% tax bands stayed as they were but a new tax band of 50% was created for those earning the highest salaries, where would that 50% band need to kick in to balance the tax take? Any feedback greatly appreciated. Thanks

    1. Dan avatar

      unfortunately that doesn’t remotely work. Increasing the personal allowance to £16k costs more than £25bn. Even if you turn the entire 45p band into 50p it’s unlikely to raise more than £1bn. The 50p rate was a political sideshow, not a tax-raising measure.

    2. Andrew avatar

      You can get a rough idea of the effects of various changes to the tax system here:

      https://www.gov.uk/government/statistics/direct-effects-of-illustrative-tax-changes/direct-effects-of-illustrative-tax-changes-bulletin-june-2024#corporation-tax

      Based on those figures, increasing the additional tax rate from 45p to 50p would roughly pay for a £100 increase in personal allowance.

      There is no way to raise the sorts of sums of tax the government is talking about raising without doing one of two things. Either you ask a very, very large number of people to pay a little bit more or you ask a small number of people to pay a very, very large amount more.

      The first is politically hard because taxes are generally unpopular. So you end up having to hide who is really bearing the cost of taxes (such as increasing employer’s NI, which is largely borne by employees through fewer jobs or lower salaries).

      The second is economically hard because you are likely to have very large behavioural effects (early retirement, emigration, reduced investment, etc).

Leave a Reply

Your email address will not be published. Required fields are marked *