
Gabriel Milland of Portland Communications has published polling conducted by the Portland research team in early October. Gabriel takes some interesting political conclusions from the polling (and I’d recommend his article). However, my focus is what the polling says about tax policy, and about polling on tax policy.
Amended to include the answers – apologies for missing this out first time
What do people want?
Here’s the result of asking the public which tax they’d prefer to put up:
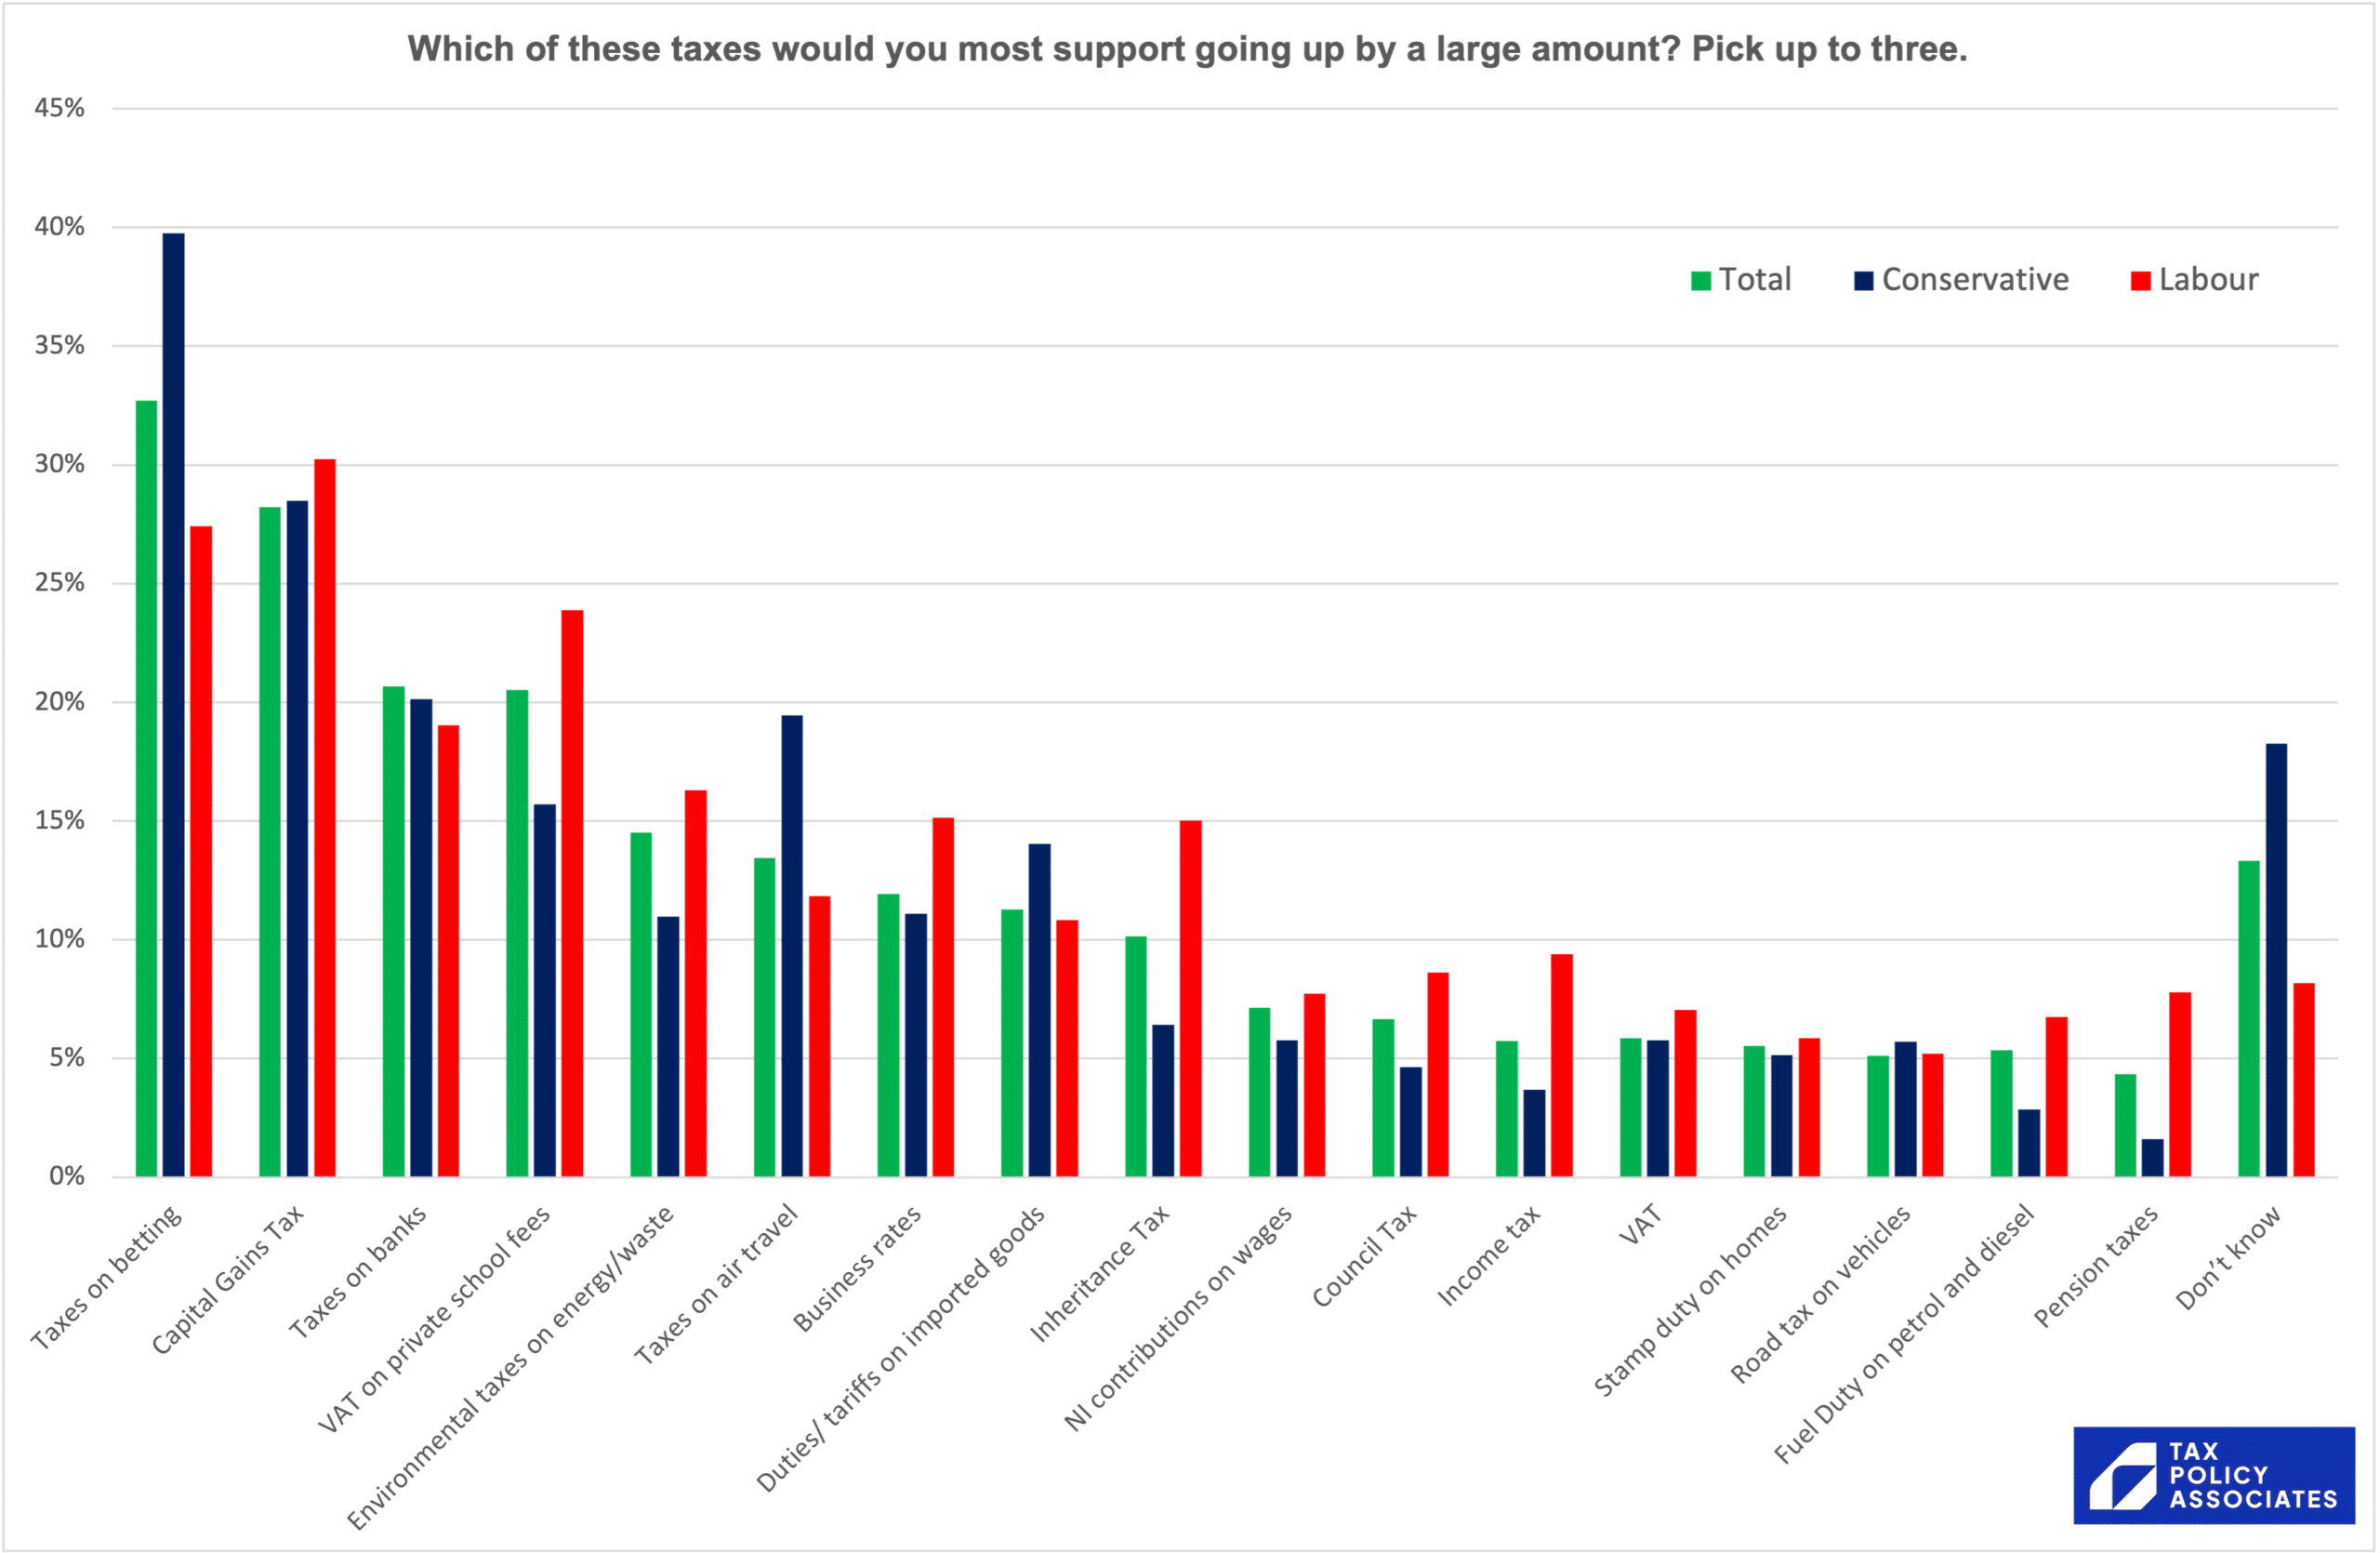
It’s a surprising win for taxes on betting, with Conservative voters in particular strongly in favour. Capital gains tax runs a close second, and bank taxes and VAT on private schools are tied for third.
And who do the public think should take the burden of any tax rises?

People who are not them. Specifically, people earning £75k1, second home-owners, non-doms, businesses and shareholders.
About a quarter want to increase taxes on business. But, if we focus on business tax specifically (and ask the question in a certain way), there’s a large majority that’s against raising business tax, because they think the cost will be passed on to them:

Should we pay attention to these results?
In my view we should not, for two reasons.
First, there is widespread misunderstanding of tax and spending.
Portland asked respondents to list the top three things Government spends money on:

Total Government spending is around £1,200bn. Spending on asylum seekers and migrants amounts to about £4bn (0.3% of all spending)2. Spending on MPs’ expenses and staff costs amounts to about £150m each year (0.01% of all spending).
Here’s an approximate chart with the actual figures, thanks to ten minutes of very fast work by Maxwell Marlow. Maxwell stresses that we shouldn’t treat it as more than indicative:

So why do people think that MPs’ expenses are in the top three spending items, when they’re not in the top three hundred?
Because most people don’t understand the size of the Government budget. Only one in six people got the right order of magnitude:3

The correct answer is £1 trillion (more precisely, around £1.2 trillion).
And this result in turn may be because most of the population don’t understand billions and trillions:

There are a thousand millions in a billion4, and a thousand billions in a trillion.
And there is also widespread misunderstanding of one of the simplest feature of the income tax system – the way that bands work:5

The second answer is correct. You pay 40% tax on your income above the 40% band (which for most people is £50,000, but that threshold drops for high earners as the personal allowance is reduced).
This reflects our earlier polling – the question is intentionally different from last time, but the result is consistent.
I’d repeat our earlier point that there is a risk this is changing peoples’ real world behaviour – for example causing some people to turn away work for fear of entering the 40% tax band. It would seem prudent for HMRC to investigate if there is a real effect here.
Second, these are three second conversations
Tony Blair talked about the fallacy of polling individual policies and thinking that you’re learning something from peoples’ three second take on complex issues. In the real world, they may have a different view after a thirty second conversation, and a very different view after a three minute conversation. Blair’s point was that election campaigns, where policies are contested, are likely to reflect the three minute view more than the thirty second view (where policies are presented without context).
So, for example, we suspect that the popularity of raising tax on people earning £75k would fall upon realisation that their marginal rate is already often pushing 60%. The consistent popularity of wealth taxes would be unlikely to survive presentation of the history of faliure of previous wealth taxes. People may be attracted to the idea of charging VAT on private school fees, but the amount it raises is economically insignificant. And that interesting finding about the unpopularity of tax on business may well be significantly influenced by the very “three second” framing with which it was presented.
Should we ignore popular views of tax?
If most people don’t understand the tax system, or government funding, should tax policy simply ignore popular views of tax and the tax system?
That would be a mistake, and perhaps even dangerous. Our political system, and our tax system, needs popular consent. And ignoring popular views on tax would give space for populists, of Left and Right, to pursue tax policies that could be highly destructive.
Tax policy therefore has to be informed by the public mood – but it shouldn’t be led by three second conversations, which confuse public sentiment for public opinion. And tax policy, and tax educators, should seek to challenge popular misapprehensions.
However there is a wider problem.
Robert Colville recently wrote in The Times that much bad tax policy is driven by politicians’ fear that they can’t tell voters the truth about the real constraints on tax and spending. He may be right. But how can politicians tell voters the truth about what may have to change, if voters don’t understand the basics of how things work at the moment?
It seems trite and inadequate to say that we need more education around finance and tax. Right now I don’t have any other suggestions.
Many thanks to Gabriel Milland and Portland Communications – they ran the tax band question, and shared with polling data with us, entirely pro bono.
Photo by Red Dot🔒 on Unsplash🔒.
Footnotes
Who already face a top marginal rate of almost 60% ↩︎
This is a better result than we’d expect if people were guessing (a z-score of approximately 3.355 corresponds to a p-value less than 0.001), but still depressing. ↩︎
The UK used to use a “long billion” of a million millions, but that ceased being used for Government statistics in 1975. We can probably discard the possibility that some of the wrong answers are from people remembering the old billion, because the results vary little across age groups. ↩︎
If you look at the data, linked in Gabriel’s article, people on higher incomes, the self-employed and graduates are more likely to know the correct answer, but not by much. Some of the subgroups have samples too small to be statistically significant. ↩︎

Half the British public doesn’t understand income tax – new data

Half the British public doesn’t understand income tax

How to stop IHT avoidance but protect farmers

The Budget – a missed opportunity

How to reform HMRC penalties for people on low incomes

Leave a Reply to John Toon Cancel reply