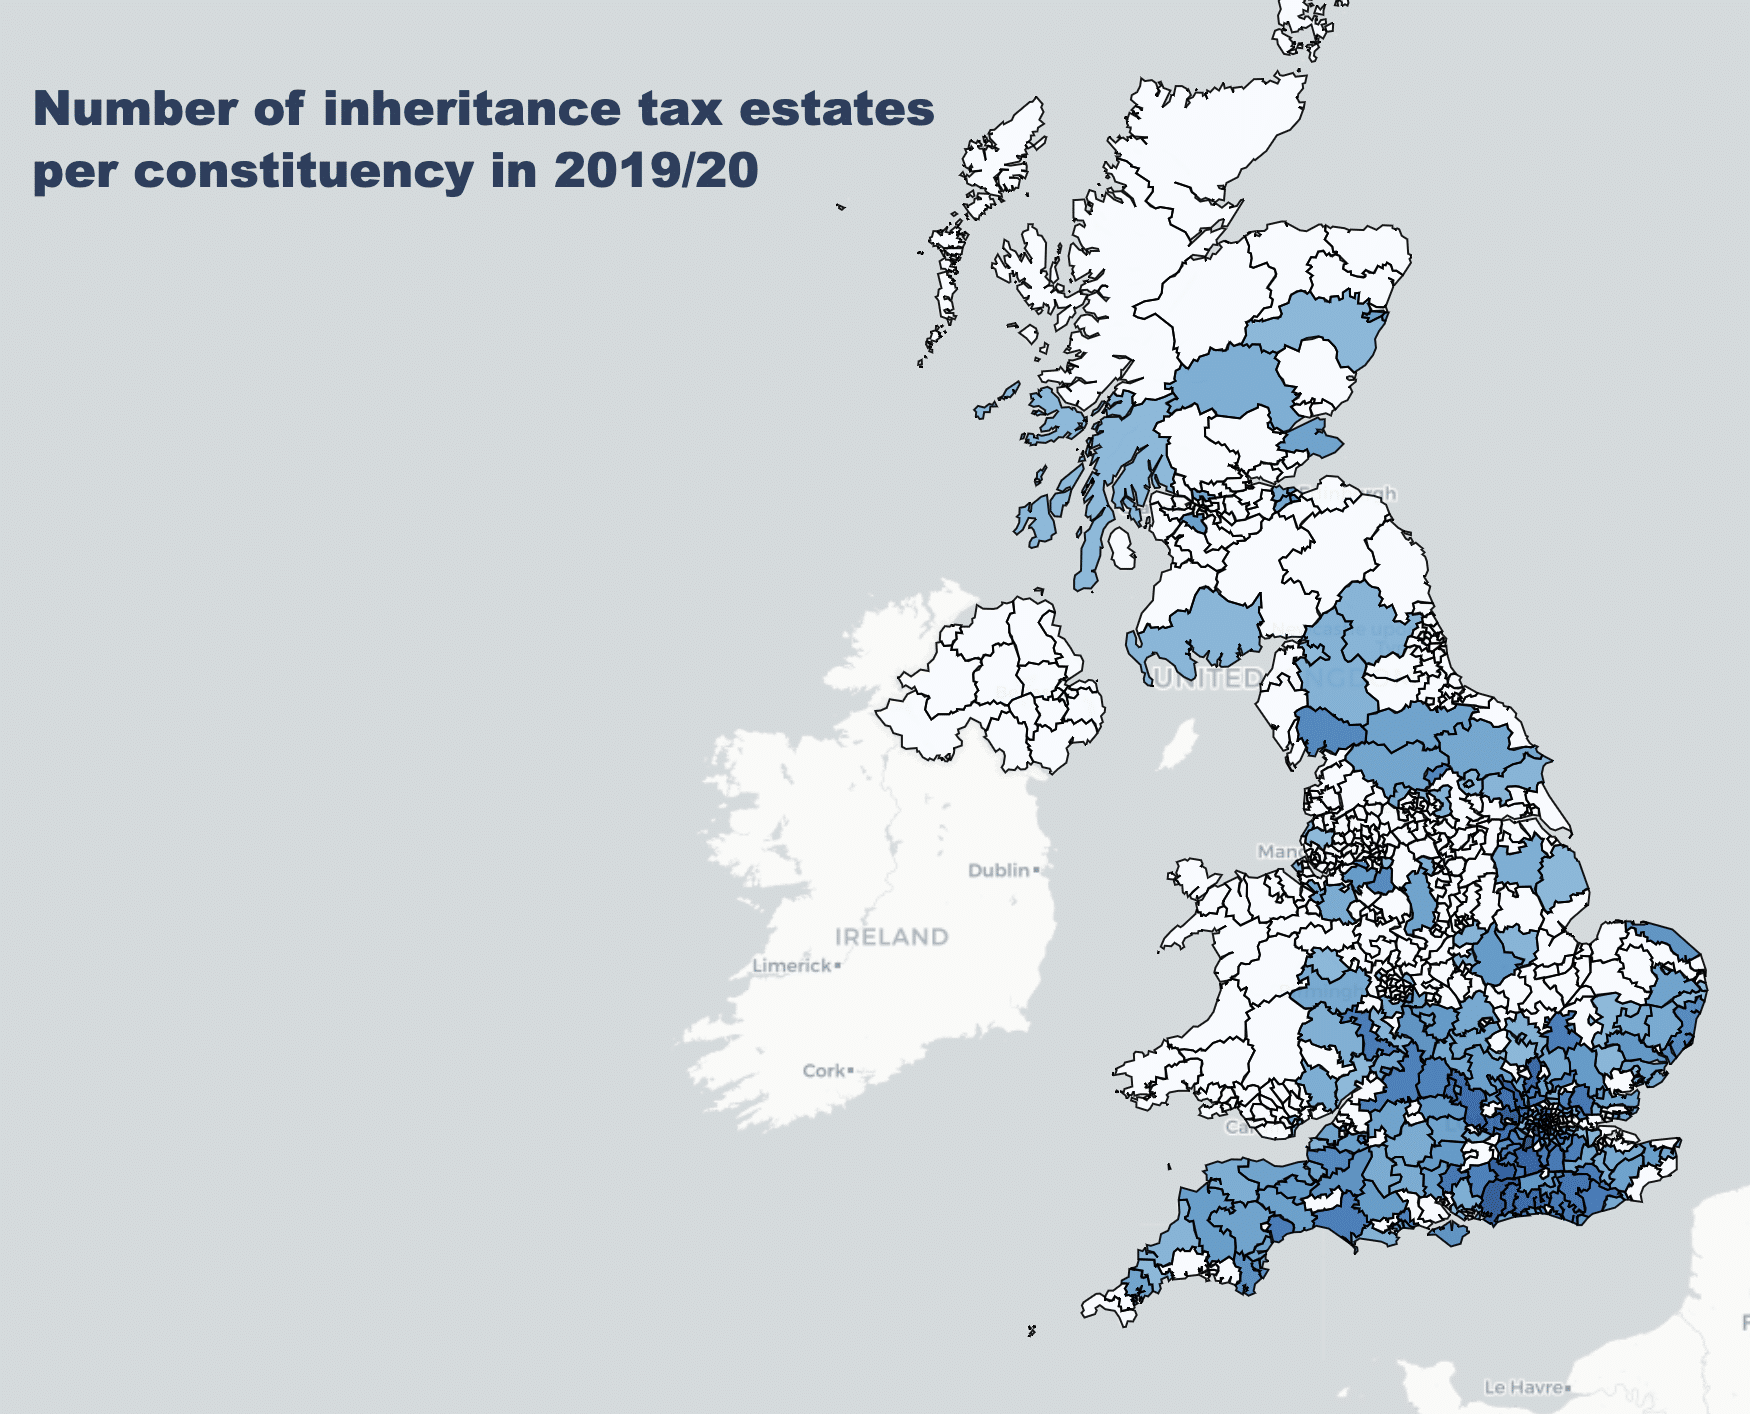
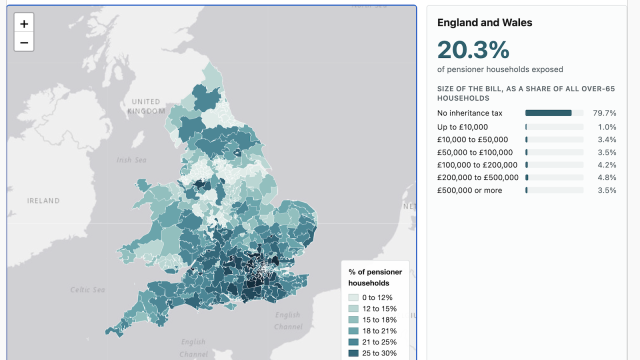
Choropleth map of the UK showing the number of inheritance tax estates per constituency in 2019/20: The highest concentrations of estates paying inheritance tax are heavily clustered in London and the South East of England, followed by the South West and East of England. The vast majority of constituencies across Wales, Northern Ireland, northern and western Scotland, and parts of the Midlands and the North of England have comparatively few or no estates affected.

Number of inheritance tax estates per constituency in 2019/20

Why does inheritance tax matter politically?

15 July 2023

6 Comments

Here’s an interactive map showing inheritance tax paid in each parliamentary constituency in 2019/20, and shaded by the number of estates paying inheritance tax. You should be able to zoom around with your mouse/fingers, and if you hover/touch a constituency you’ll see the data:

You can see a full-screen version here, one with alternate shading by the amount of IHT paid here, and the source code is here. Note that, for data privacy reasons, we see no data for any constituency where the number of estates is less than 30.

Another less pretty way to view this:
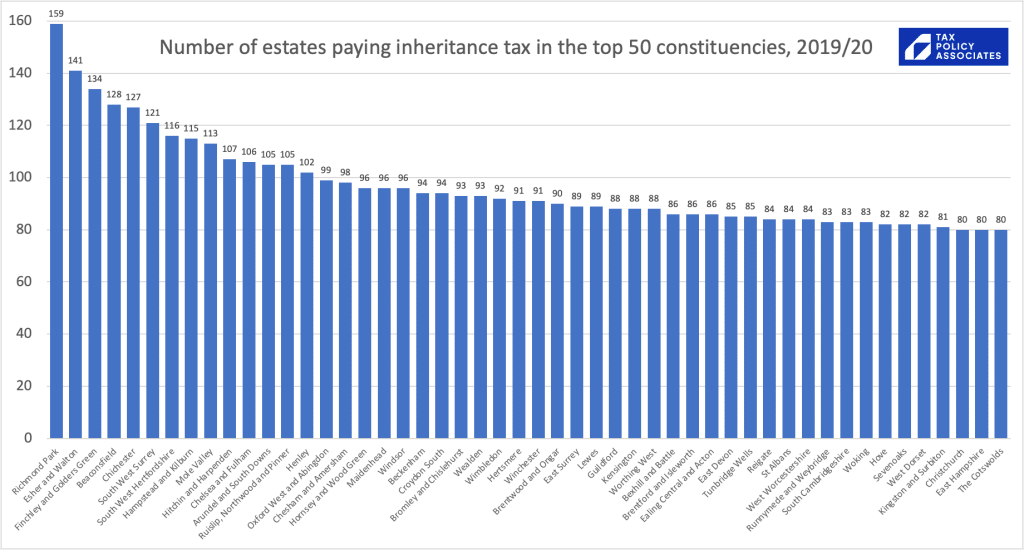
Bar chart showing the number of estates paying inheritance tax in the top 50 constituencies, 2019/20: Richmond Park had the highest number of estates paying inheritance tax in 2019/20 at 159, followed by Esher and Walton with 141 and Finchley and Golders Green with 134. Across the top 50 constituencies, all located primarily in London and the South of England, the number of estates paying inheritance tax ranged from 80 to 159.

Number of estates paying inheritance tax in the top 50 constituencies, 2019/20
Logo: TAX POLICY ASSOCIATES
Y-axis: 0 to 160 (unlabelled unit, increments of 20)

Richmond Park: 159
Esher and Walton: 141
Finchley and Golders Green: 134
Beaconsfield: 128
Chichester: 127
South West Surrey: 121
South West Hertfordshire: 116
Hampstead and Kilburn: 115
Mole Valley: 113
Hitchin and Harpenden: 107
Chelsea and Fulham: 106
Arundel and South Downs: 105
Ruislip, Northwood and Pinner: 105
Henley: 102
Oxford West and Abingdon: 99
Chesham and Amersham: 98
Hornsey and Wood Green: 96
Maidenhead: 96
Windsor: 96
Beckenham: 94
Croydon South: 94
Bromley and Chislehurst: 93
Wealden: 93
Wimbledon: 92
Hertsmere: 91
Winchester: 91
Brentwood and Ongar: 90
East Surrey: 89
Lewes: 89
Guildford: 88
Kensington: 88
Worthing West: 88
Bexhill and Battle: 86
Brentford and Isleworth: 86
Ealing Central and Acton: 86
East Devon: 85
Tunbridge Wells: 85
Reigate: 84
St Albans: 84
West Worcestershire: 84
Runnymede and Weybridge: 83
South Cambridgeshire: 83
Woking: 83
Hove: 82
Sevenoaks: 82
West Dorset: 82
Kingston and Surbiton: 81
Christchurch: 80
East Hampshire: 80
The Cotswolds: 80

It’s easy to forget quite how few estates pay inheritance tax these days, given that most households will need £1m of net assets before they start paying the tax, and old age naturally depletes the assets we were saving in our life. Looking around to see how many households have £1m+ now is a poor guide to how many will end up paying inheritance tax (particularly given that many people will give assets to their children before they die).

So even in Richmond Park, only 159 estates paid inheritance tax.

And of course many of those that do pay inheritance tax will have a small bill. For example, if your estate has £1.5m of net assets, the inheritance tax is only on amount over the threshold/allowance – so an IHT bill of roughly £200,000.

(Note that the reason is absolutely not “the very rich don’t pay inheritance tax”. They do: they just pay a significantly lower effective rate than the merely comfortable off.)

So is there some political pattern in inheritance tax that makes it a big political draw? What if we look at the seats the Conservative Party has to hold to stay in power, say the 100 seats with the smallest Conservative majority? Many of those have less than 30 estates paying IHT, but of those with 30 or more:

Scatter plot showing Conservative majority against the number of estates paying inheritance tax in 2019/20 for vulnerable seats: There is no strong overall correlation between the size of a Conservative MP's majority and the number of inheritance tax estates in these vulnerable seats. However, several highly vulnerable seats have substantial numbers of taxable estates, notably Esher and Walton (majority around 2,950 with over 140 estates) and Finchley and Golders Green (majority around 6,560 with over 130 estates), whereas seats like Milton Keynes South and West Aberdeenshire and Kincardine have around 30 estates.

Conservative majority in 100 most vulnerable seats, vs number of inheritance tax estates (in 2019/20)

Y-axis: Number of estates paying inheritance tax in 2019/20 (0 to 160)
X-axis: Conservative majority (0 to 8000)

Data points (Conservative majority, Number of estates paying inheritance tax):
- Kensington: approx. (150, 88)
- Wimbledon: approx. (640, 92)
- Carshalton and Wallington: approx. (640, 48)
- West Aberdeenshire and Kincardine: approx. (850, 31)
- Cheltenham: approx. (980, 68)
- Winchester: approx. (990, 91)
- Chingford and Woodford Green: approx. (1260, 69)
- Wolverhampton South West: approx. (1660, 31)
- Dumfries and Galloway: approx. (1800, 32)
- Keighley: approx. (2210, 41)
- Lewes: approx. (2450, 89)
- South Cambridgeshire: approx. (2900, 83)
- Esher and Walton: approx. (2950, 141)
- Guildford: approx. (3340, 88)
- Cities Of London and Westminster: approx. (3950, 73)
- Hastings and Rye: approx. (4040, 43)
- Southport: approx. (4150, 34)
- Hendon: approx. (4230, 65)
- Eastbourne: approx. (4330, 58)
- Hazel Grove: approx. (4420, 31)
- Watford: approx. (4430, 53)
- Truro and Falmouth: approx. (4570, 47)
- Altrincham and Sale West: approx. (6140, 64)
- Finchley and Golders Green: approx. (6560, 134)
- East Devon: approx. (6710, 85)
- Hitchin and Harpenden: approx. (6900, 107)
- Milton Keynes South: approx. (6950, 30)

Logo: TAX POLICY ASSOCIATES

No particular pattern, other than almost all of them have less than 100 estates paying inheritance tax (the Excel file is available here).

So, why does inheritance tax matter politically?

I’m not sure we know, but it won’t stop me guessing: it’s because of a widespread perception that the rich don’t pay the tax, but the merely comfortably off can be landed with large bills. (I think that’s consistent with this fascinating research from Demos).

That perception is basically true. Check out this chart, from HMRC, looking at the 2016/17 figures on what estates are actually paying in inheritance tax. There’s a spectacular drop-off in the effective rate for large estates (£9m+):

And look at what an outlier the UK is in international terms, with a relatively high rate but relatively low revenues:
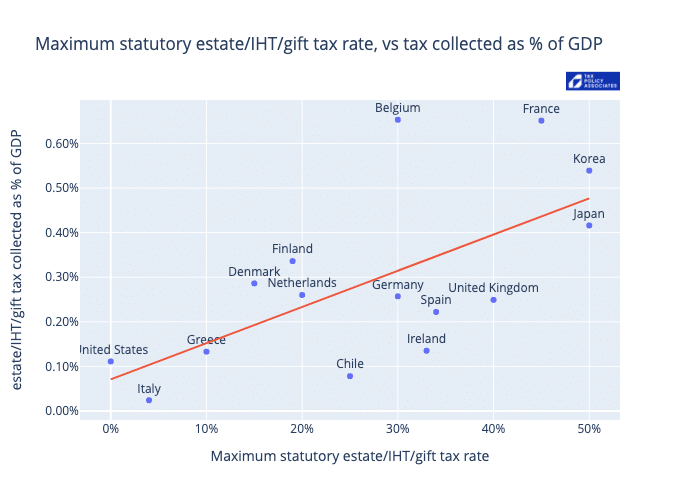
Scatter plot showing maximum statutory estate/IHT/gift tax rate versus tax collected as a percentage of GDP across OECD countries: There is a positive correlation between higher statutory inheritance/gift tax rates and higher tax revenues as a percentage of GDP. Belgium and France collect the most relative to GDP at approximately 0.65%, whereas the United Kingdom collects around 0.25% of GDP despite a relatively high 40% statutory rate.

Maximum statutory estate/IHT/gift tax rate, vs tax collected as % of GDP
Logo: TAX POLICY ASSOCIATES

X-axis: Maximum statutory estate/IHT/gift tax rate (0% to 50%)
Y-axis: estate/IHT/gift tax collected as % of GDP (0.00% to 0.60%+)

Data points (approximate values read from plot):
- United States: rate 0%, collected 0.11% of GDP
- Italy: rate 4%, collected 0.02% of GDP
- Greece: rate 10%, collected 0.13% of GDP
- Denmark: rate 15%, collected 0.29% of GDP
- Finland: rate 19%, collected 0.34% of GDP
- Netherlands: rate 20%, collected 0.26% of GDP
- Chile: rate 25%, collected 0.08% of GDP
- Germany: rate 30%, collected 0.26% of GDP
- Belgium: rate 30%, collected 0.65% of GDP
- Ireland: rate 33%, collected 0.14% of GDP
- Spain: rate 34%, collected 0.22% of GDP
- United Kingdom: rate 40%, collected 0.25% of GDP
- France: rate 45%, collected 0.65% of GDP
- Korea: rate 50%, collected 0.54% of GDP
- Japan: rate 50%, collected 0.42% of GDP

Trend line: upward sloping from approx. 0.07% at 0% tax rate to approx. 0.47% at 50% tax rate.

There’s an obvious answer: we should fix inheritance tax so the green curve above is more flat, and the seriously wealthy pay the same effective rate as the merely reasonably wealthy. We should be able to do that by capping reliefs that are meant for small farms and small businesses, but end up providing a massive tax reduction for multi-millionaires. Then we can lower the rate to something more like 20% or 25%, without reducing revenues, and put the UK closer to The Netherlands, Denmark and Germany.

I think that would be the right thing to do, and treat both the seriously wealthy and the reasonably wealthy more fairly. I’ll leave others to judge how politically popular it would be.
6 responses to “Why does inheritance tax matter politically?”

  1. Karl Fenlon avatar

    Absolutely for a lower rate and an end to the exceptions. As you say, and your chart suggests, there are models out there that work.
    For me I think it is likely more egregious than your numbers show. I suspect at the lower end of the large estates (that pay the highest rates of tax) the estate might well have been earned (i.e. taxed already) and have little experience of IHT planning whereas more of the very large estates (that pay a lower effective rate) might be more likely to have been inherited and hence untaxed.
    Would you also need measures to stop estates moving offshore?

  2. Stephen Brown avatar
    Stephen Brown

    I think the stats shown for USA might need clarifying. As shown, maximum statutory rate is 0% and yet amount of IHT collected is more than 0. It is true that IHT (equivalent) at Federal level does not kick in until estates are approximately $11m but in many jurisdictions, state level estate tax kicks in at considerably lower levels $1m to $5m) and at rates up to 16%

  3. Graeme avatar

    Can’t the very rich simply use trust funds to avoid paying inheritance tax? The the Duke of Kensington seemingly did just that with the £9bn he inherited in 2016, or have the rules since changed?

    1. Dan avatar

      I think that’s often misreported. Trusts pay 6% inheritance tax every ten years. So, over a lifetime, broadly similar to what normal IHT would be in practice. The issue is probably that much of the trust benefits from business property relief or agricultural property relief.

      Trusts mostly aren’t useful tax planning for UK domiciled individuals these days.

  4. Richard Sage avatar
    Richard Sage

    “Inheritance Tax is a voluntary levy paid by those who distrust their heirs more than they dislike the Inland Revenue”
    How does Belgium get such a high collection for its rate?
    Is it just the reliefs you mention, that parents are less trusting, that they do something about lifetime transfers, or something else?

    Replacing inheritance tax on the estate, with CGT on the receipt, with exemption beyond the general £6k only for spouses (so they are not forced to move out of their home) sweeps away all the problems.
    Perhaps the Tories doing the former would enable Labour to do the latter!

  5. Walter Mitty avatar
    Walter Mitty

    Interesting article as always, but do you have the figures for the number of estates paying inheritance tax by constituency as a proportion of the total number of declared estates, the absolute numbers are less meaningful as they are.

Leave a Reply

Your email address will not be published. Required fields are marked *