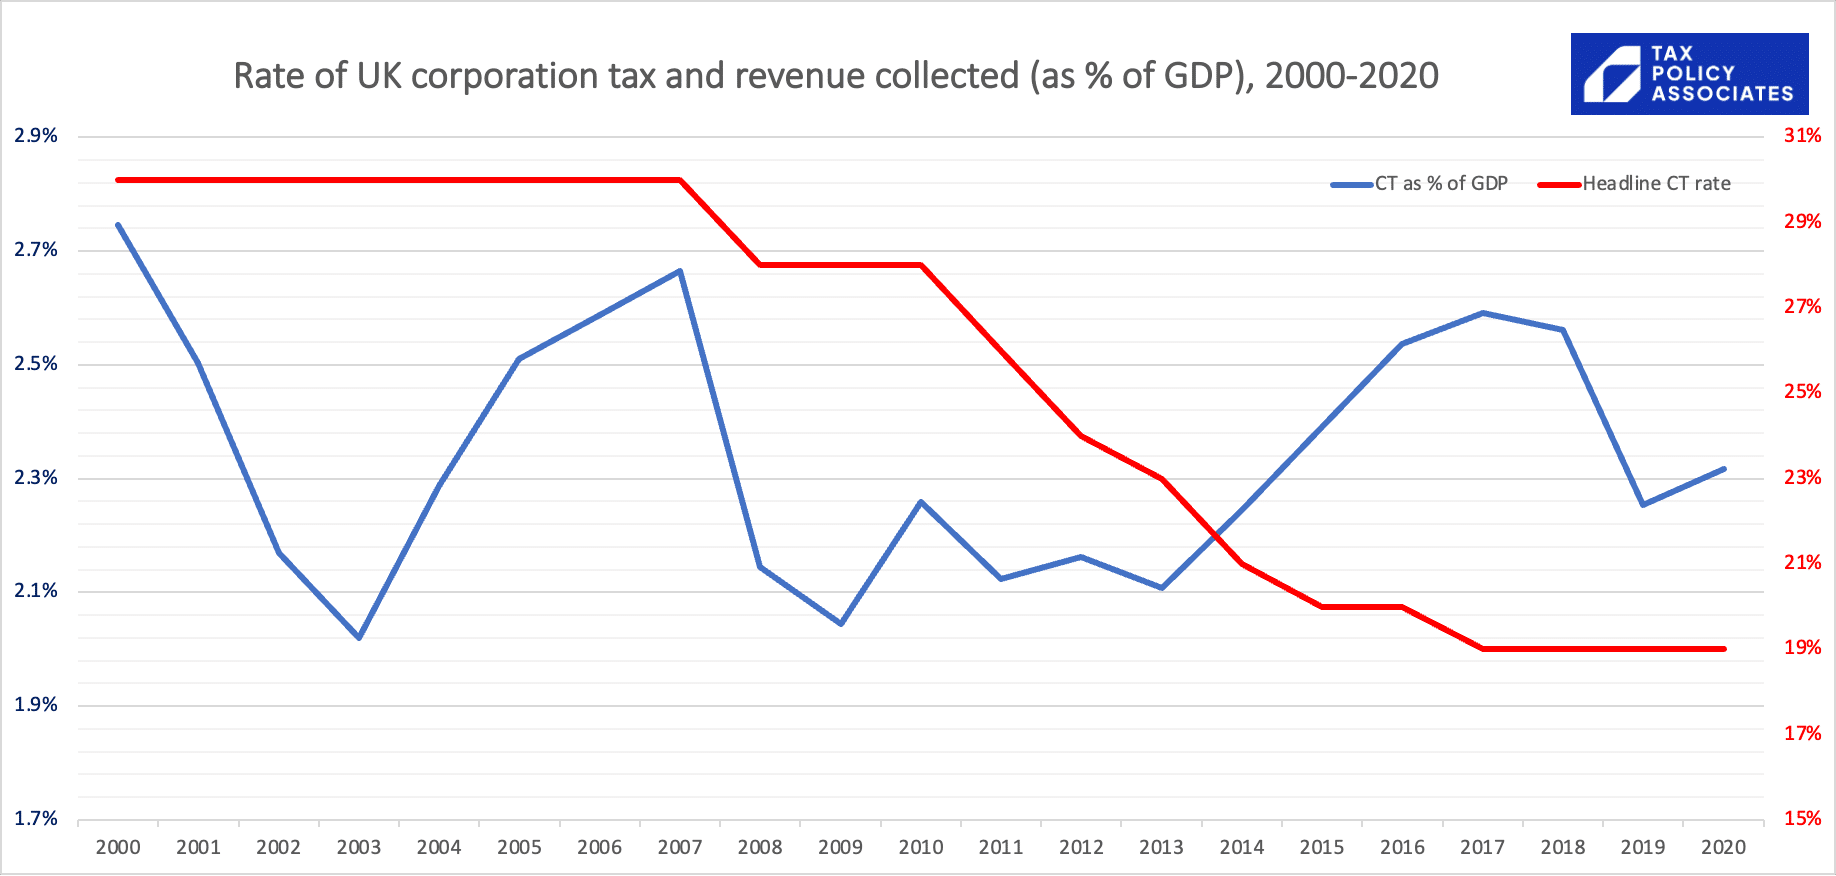
Line chart showing the UK headline corporation tax rate and corporation tax revenue as a percentage of GDP from 2000 to 2020: Despite the headline corporation tax rate falling sharply from 30% in 2007 to 19% by 2017, corporation tax revenue as a share of GDP remained relatively resilient, fluctuating between approximately 2.0% and 2.7% throughout the 2000 to 2020 period.

Rate of UK corporation tax and revenue collected (as % of GDP), 2000-2020
Logo: TAX POLICY ASSOCIATES

Horizontal axis: Year, 2000 to 2020
Left vertical axis: CT as % of GDP (blue), 1.7% to 2.9% in intervals of 0.2%
Right vertical axis: Headline CT rate (red), 15% to 31% in intervals of 2%

Data approximate values:
2000: Headline CT rate 30%, CT as % of GDP ~2.74%
2001: Headline CT rate 30%, CT as % of GDP ~2.50%
2002: Headline CT rate 30%, CT as % of GDP ~2.17%
2003: Headline CT rate 30%, CT as % of GDP ~2.02%
2004: Headline CT rate 30%, CT as % of GDP ~2.30%
2005: Headline CT rate 30%, CT as % of GDP ~2.51%
2006: Headline CT rate 30%, CT as % of GDP ~2.59%
2007: Headline CT rate 30%, CT as % of GDP ~2.66%
2008: Headline CT rate 28%, CT as % of GDP ~2.14%
2009: Headline CT rate 28%, CT as % of GDP ~2.04%
2010: Headline CT rate 28%, CT as % of GDP ~2.26%
2011: Headline CT rate 26%, CT as % of GDP ~2.12%
2012: Headline CT rate 24%, CT as % of GDP ~2.16%
2013: Headline CT rate 23%, CT as % of GDP ~2.10%
2014: Headline CT rate 21%, CT as % of GDP ~2.24%
2015: Headline CT rate 20%, CT as % of GDP ~2.40%
2016: Headline CT rate 20%, CT as % of GDP ~2.54%
2017: Headline CT rate 19%, CT as % of GDP ~2.60%
2018: Headline CT rate 19%, CT as % of GDP ~2.56%
2019: Headline CT rate 19%, CT as % of GDP ~2.25%
2020: Headline CT rate 19%, CT as % of GDP ~2.32%

The myth of the corporate tax “race to the bottom”

20 September 2022

2 Comments

It’s often said there’s been a race to the bottom in corporate tax, with tax competition resulting in corporations paying less and less over the last few decades. The most recent claim was by the IPPR, which I commented on here.

These claims are wrong, at least when it comes to the UK: the UK corporate tax rate plummeted over the last 20 years, but the actual tax collected, as a percentage of GDP, stayed broadly the same. See the chart above or the OBR piece here.

Why? Because a company’s corporate tax liability is the tax rate multiplied by its taxable profit. The UK definition of “taxable profit” – often termed the “tax base” – has expanded over the same period that the rate fell. Either by accident or design, the two effects broadly countered each other. This means that the average effective tax rate (i.e. tax paid divided by profits) is largely unchanged:

Combined line and bar chart showing UK headline versus effective corporation tax rates from 2010-11 to 2025-26: While the headline tax rate fell from 28% in 2010-11 to 19% between 2017-18 and 2022-23 before rising to 25%, the effective tax rate remained relatively flat between 9% and 13% before increasing to around 16%. Consequently, the difference between headline and effective rates narrowed from over 16 percentage points in 2010-11 to around 7 points in 2017-18, before widening to roughly 9 to 10 points after 2023.

Chart C: Effective tax rate versus the headline tax rate

Vertical axis: Per cent (0 to 30)
Horizontal axis: 2010-11 to 2025-26
Series: Difference between rates (bars), Headline tax rate (purple line), Effective tax rate (yellow line)
Source: IFS, HMRC, OBR, ONS

Approximate data values:
2010-11: Headline rate 28.0%, Effective rate ~11.5%, Difference ~16.5%
2011-12: Headline rate 26.0%, Effective rate ~11.0%, Difference ~15.0%
2012-13: Headline rate 24.0%, Effective rate ~11.8%, Difference ~12.2%
2013-14: Headline rate 23.0%, Effective rate ~11.6%, Difference ~11.4%
2014-15: Headline rate 21.0%, Effective rate ~11.7%, Difference ~9.3%
2015-16: Headline rate 20.0%, Effective rate ~11.6%, Difference ~8.4%
2016-17: Headline rate 20.0%, Effective rate ~12.8%, Difference ~7.2%
2017-18: Headline rate 19.0%, Effective rate ~12.1%, Difference ~6.9%
2018-19: Headline rate 19.0%, Effective rate ~12.0%, Difference ~7.0%
2019-20: Headline rate 19.0%, Effective rate ~10.6%, Difference ~8.4%
2020-21: Headline rate 19.0%, Effective rate ~10.5%, Difference ~8.5%
2021-22: Headline rate 19.0%, Effective rate ~9.1%, Difference ~9.9%
2022-23: Headline rate 19.0%, Effective rate ~10.3%, Difference ~8.7%
2023-24: Headline rate 25.0%, Effective rate ~14.5%, Difference ~10.5%
2024-25: Headline rate 25.0%, Effective rate ~16.1%, Difference ~8.9%
2025-26: Headline rate 25.0%, Effective rate ~16.2%, Difference ~8.8%

Unfortunately, the ONS doesn’t publish that chart going back further than 2010 – but we can calculate a reasonable proxy for effective tax rate using the ONS data for corporate gross operating surplus. That results in this chart, which needs to be read with many many caveats, but nevertheless is a good indication that the long-term trend is indeed that the headline rate (purple) plummets, but the effective tax rate (yellow) does nothing much at all.
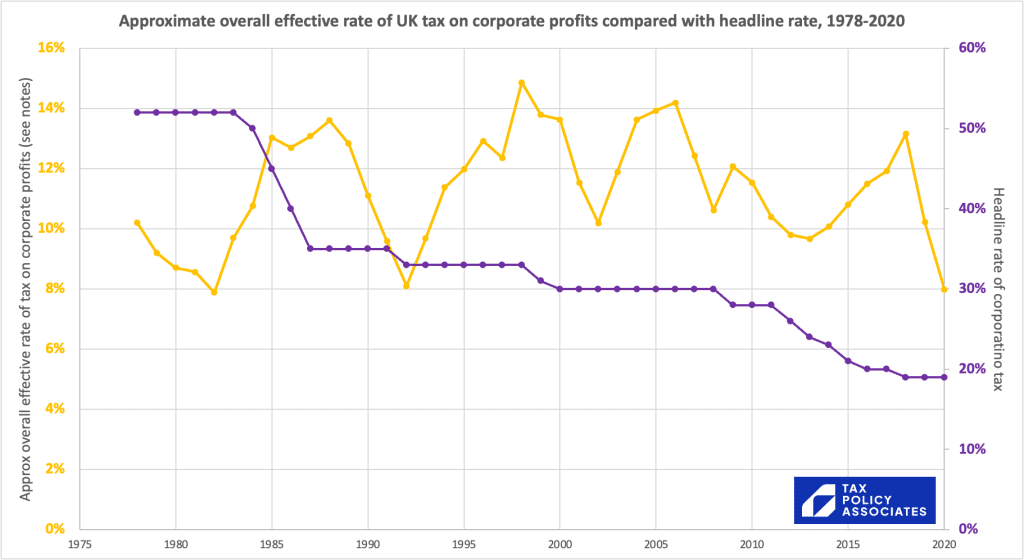
Line graph comparing the approximate overall effective rate of UK tax on corporate profits with the headline rate from 1978 to 2020: While the headline corporation tax rate fell substantially from 52% in 1978 to 19% by 2020, the overall effective tax rate fluctuated between approximately 8% and 15% across the entire period, ending at around 8% in 2020.

Approximate overall effective rate of UK tax on corporate profits compared with headline rate, 1978-2020

Left y-axis (yellow): Approx overall effective rate of tax on corporate profits (see notes), 0% to 16% in steps of 2%.
Right y-axis (purple): Headline rate of corporatino tax, 0% to 60% in steps of 10%.
X-axis: Years from 1975 to 2020 in steps of 5 years.
Logo: TAX POLICY ASSOCIATES

Headline rate of corporation tax (purple line):
1978 to 1983: 52%
1984: 50%
1985: 45%
1986: 40%
1987 to 1990: 35%
1991 to 1998: 33%
1999 to 2007: 30%
2008 to 2010: 28%
2011: 26%
2012: 24%
2013: 23%
2014: 21%
2015 to 2016: 20%
2017 to 2020: 19%

Approximate overall effective rate of tax on corporate profits (yellow line, approximate values):
1978: ~10.2%
1979: ~9.2%
1980: ~8.7%
1981: ~8.6%
1982: ~7.9%
1983: ~9.7%
1984: ~10.8%
1985: ~13.0%
1986: ~12.7%
1987: ~13.1%
1988: ~13.6%
1989: ~12.8%
1990: ~11.1%
1991: ~9.6%
1992: ~8.1%
1993: ~9.7%
1994: ~11.4%
1995: ~12.0%
1996: ~12.9%
1997: ~12.4%
1998: ~14.9%
1999: ~13.8%
2000: ~13.6%
2001: ~11.5%
2002: ~10.2%
2003: ~11.9%
2004: ~13.6%
2005: ~13.9%
2006: ~14.2%
2007: ~12.4%
2008: ~10.6%
2009: ~12.1%
2010: ~11.5%
2011: ~10.4%
2012: ~9.8%
2013: ~9.7%
2014: ~10.1%
2015: ~10.8%
2016: ~11.5%
2017: ~11.9%
2018: ~13.2%
2019: ~10.2%
2020: ~8.0%

So the stories people tell of [brave tax-cutting Chancellors][evil tax-cutting Tories] are all wrong, and are because people are looking at the (mostly irrelevant) purple line. The yellow line – reflecting the tax actually paid – tells us that corporate tax wasn’t cut at all – it just changed in lots of very complicated and opaque ways. Great.

What about other countries?

I’ve quickly pulled together some data from the OECD’s fantastic corporate tax database, and have made an interactive chart that lets us compare corporate tax rates and revenue across the OECD. Click this image:

Line chart of UK and German corporate tax revenues as a percentage of GDP and corporate tax rates from 1972 to 2017: Despite steep drops in statutory corporate tax rates—falling from over 50% to under 20% in the UK, and from around 50% to 30% in Germany—corporate tax revenues as a share of GDP did not decline over the long term. UK revenue hovered between 1.7% and 4.4% of GDP throughout the period, and German revenue generally fluctuated between 1.0% and 2.2% of GDP.

Corporate tax revenues as a % of GDP (solid line) and tax rate (dashed line)
Logo: TAX POLICY ASSOCIATES

Left y-axis: Corporate as % of GDP (ranging from 0.5% to 4.5%)
Right y-axis: Corporate tax rate (combined central and local), % (ranging from 10% to 50%)
x-axis: Years from roughly 1972 to 2017 (ticks every 5 years: 1975, 1980, 1985, 1990, 1995, 2000, 2005, 2010, 2015)

Series labels (at right of lines):
- United Kingdom (dark blue solid line): corporate tax revenue as % of GDP
- United Kingdom (rate) (dark blue dashed line): corporate tax rate
- Germany (light slate blue/teal solid line): corporate tax revenue as % of GDP
- Germany (rate) (light slate blue/teal dashed line): corporate tax rate

The OECD sadly only has tax rate data going back to 2000 – I added the earlier UK tax rate data myself. But you can zoom and focus on 2000-2020, then click on the right hand side to select/deselect individual countries.

The code and underlying spreadsheet is here..

Unfortunately, I can’t find useful international gross operating surplus data, so can’t compare effective tax rates across the OECD. If anyone can find that data, please let me know.

So what?

I can play with the interactive chart all day but – fun as it is – it’s just cherry-picking.

The question we really want to answer is: is there evidence across the OECD that falling rates drove falling revenues over the period 2000-2018?

I’ll post more on this soon.


Footnotes

  1. With some noise from “incorporation” – sole traders establishing companies to save tax, which tends to reduce income tax/national insurance and boost corporation tax – but not enough to make a difference to this analysis. ↩︎

  2. This comes from the excellent OBR piece. Well worth a read ↩︎

  3. The two big ones: (1) GOS is not the same as accounting profit, and in particular excludes depreciation (so the chart understates ETR), (2) the tax stats are for cash collected by HMRC in a tax year, which used to lag profits by around a year, and now mainly doesn’t – neither factor should affect the overall trend, but both will create/mask considerable noise. With some work they could be corrected. ↩︎

  4. If anyone can point me towards pre-2000 tax rate data I’d be most obliged. ↩︎

  5. If you have feedback on the quality of my incredibly amateurish coding then please do add comments on our official code feedback page here ↩︎

  6. The OECD data only goes back to 2008 ↩︎

  7. Just promise me you won’t look at the US chart, because pass-through taxation (company profits taxed in the hands of owners/shareholders) means US corporate tax statistics can’t easily be compared with other countries’. ↩︎
2 responses to “The myth of the corporate tax “race to the bottom””

  1. Dan avatar

    No, this is incorrect. None of the above relates to the tax base of an individual company. The ONS chart shows the economy-wide effective tax rate, i.e. total corporate tax divided by total corporate profits (excluding financials and offshore oil/gas, who all pay a significantly higher rate).

    The incorporation effect (increased CT; reduced IT/NICs) is real, but relatively small. Around £1bn. Was bigger when the corporation tax rate was 10% – perhaps as much as £3bn, but still not large enough to dent the trends shown above.

    I really don’t think there is room for debate on this. The evidence is clear that corporate tax, as a % of GDP or a % of profits, has not been cut.

  2. Sol Picciotto avatar

    Dan, I think you are eliding the difference between the “tax base” of an individual company and the aggregate base of corporate profits taxed in the UK. An analysis of whether cutting the CIT rate reduces the revenues from CIT should take account of the relative size of that aggregate base. Your footnote 1 concedes that this base has grown, partly due to a rise in incorporation. This is likely to be partly driven by the reduction of the CIT rate below the individual income tax rate, as well as other tax advantages of incorporation. Your footnote says this is just “noise”, and makes no difference to the analysis, but I think it’s important not to confuse the individual company’s tax base with aggregate UK corporate profits. Cutting CIT rates may boost CIT revenue while reducing the revenue from other taxes.

Leave a Reply

Your email address will not be published. Required fields are marked *