
Reform UK’s “hard work bonus” sounds simple: no income tax on overtime above a 40-hour week for workers earning under £75,000. But the likely result is modest extra output, massive relabelling of existing hours as “overtime”, and a bill far above Reform’s £5bn estimate. Our central estimate of the cost is £14bn. For that money we could fund several tax cuts that would do much more for growth, fairness and simplicity.
Updated 27 May 2026 with “waffle charts” showing the distribution of the benefit of the overtime tax cut vs simple income tax/National Insurance cuts.
The policy has all the classic problems of a badly designed tax relief. It draws an artificial line between ordinary hours and overtime. It rewards employees but penalises the self-employed. It treats someone contracted to work 50 hours worse than someone contracted for 40 hours plus ten hours’ overtime. It creates a £75,000 cliff edge where a £1 pay rise could cost almost £6,000. And it invites employers and employees to redesign contracts so that ordinary pay is magically transformed into tax-free overtime.
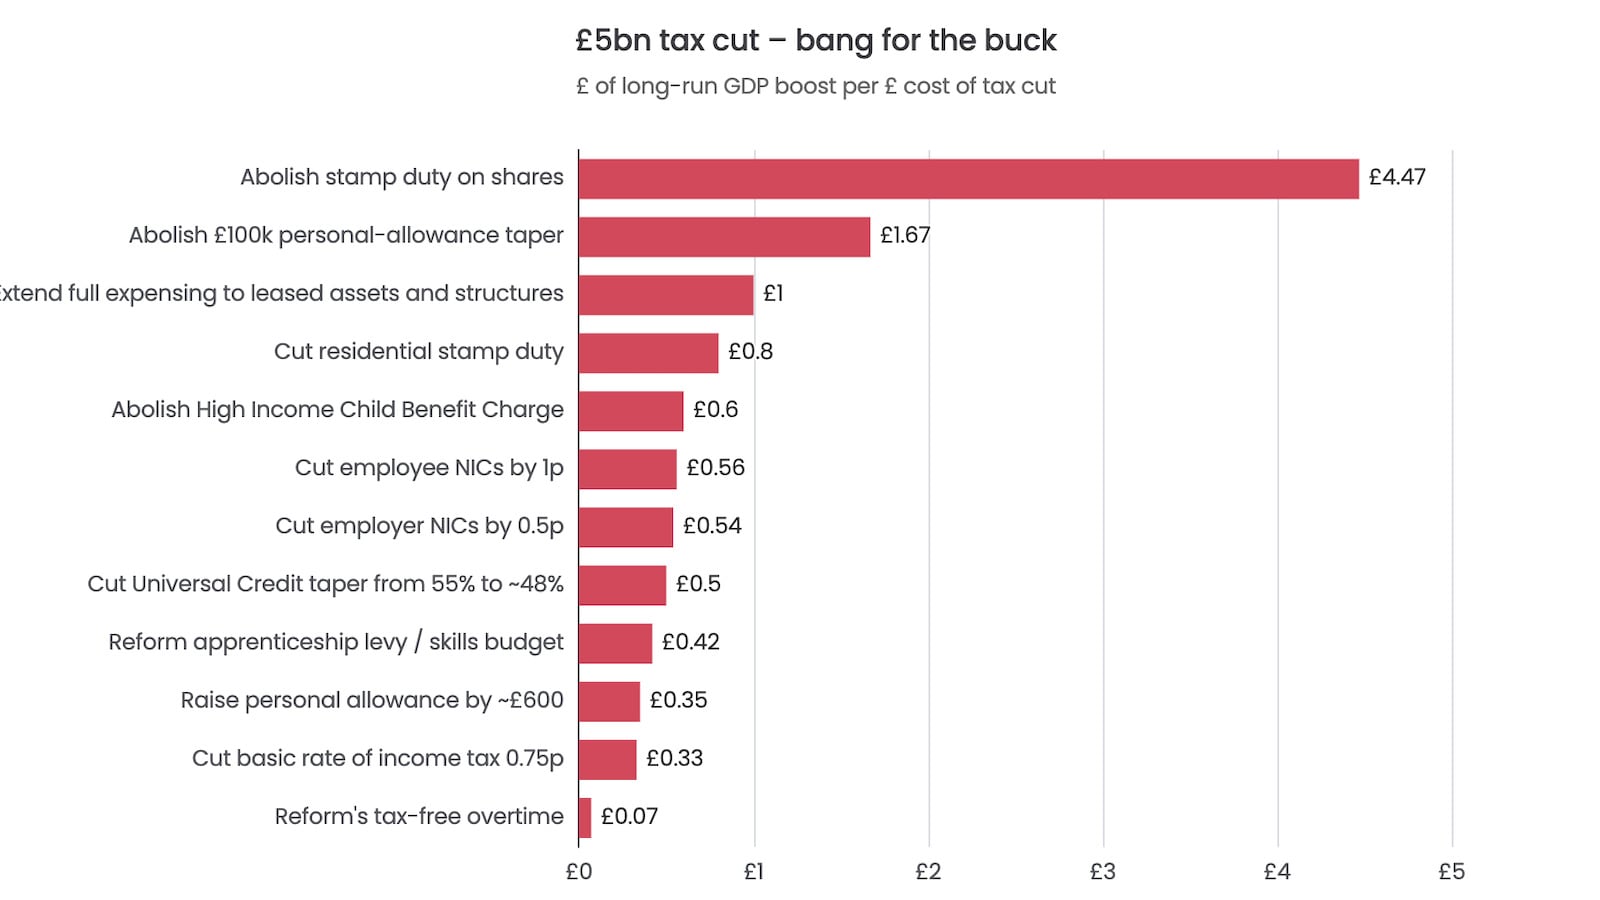
We described Labour’s increase in employer NICs as one of the worst possible tax increases. Reform UK’s proposal is one of the worst possible tax cuts. We scored it against other plausible £5bn tax cuts on the “bang for the buck” – the long-run GDP boost per £ of revenue forgone from the tax cut. The Reform UK proposal is at the bottom of the list:
The reason is simple: the amount of overtime worked in the UK is fairly small, so the “upside” of attracting more overtime is limited. On the other hand, the amount of time that could be relabelled as overtime is very large: so the “downside” of incentivising people just to relabel their time is very large.
This report quantifies all these effects. Our £14bn central estimate comprises a static cost of £4bn, plus £7bn of people “relabelling” hours as overtime, plus £3bn of additional use of personal service companies, minus additional National Insurance receipts of £0.2bn.
Reform UK have fallen into the trap – more often associated with parties of the Left – of confusing the outcome they want with the outcome that will follow from the actual incentives created by the policy.1
We’d all be much better off if, rather than introducing new complex tax incentives, we focussed on fixing the taxes we have, removing anomalies that disincentivise work, and (if there is space for tax cuts) thinking carefully which tax cuts have the maximum “bang for the buck”.
In this report:
The proposal
The basic proposal is to remove income tax2 on overtime above a 40-hour week for workers earning less than £75,000. Reform calls it a “hard work bonus”, estimates it would cost about £5bn a year, and says it would be funded from welfare cuts. Reform says about 3.2m workers receive overtime pay and that the £75,000 threshold means about 90% of workers could benefit.
Here’s Nigel Farage’s presentation of the policy:
There’s some more detail in this Robert Jenrick interview (transcript here):
Mr Jenrick gives two examples:
- a Heinz factory worker doing seven extra hours a week would take home about £1,000 extra a year;
- a newly qualified nurse doing five extra hours a week would take home almost £1,300 extra.
Mr Jenrick accepted that the £5bn costing included “some reclassification of unpaid overtime to paid overtime”, and said anti-avoidance rules would be developed with HMRC and the Treasury.
The proposal may be inspired by Donald Trump’s “no tax on overtime” pledge. By the time it became law, the US version ended up much narrower than the original promise: it covers only the overtime premium (e.g. the “half” in time-and-a-half), it is capped at $12,500, it phases out above $150,000 of income, and it is temporary.3 The US version reduces income tax receipts by about 1.1%. Reform UK’s proposal reduces income tax receipts by about 1.6%.
The Trump proposal has been criticised by US right-of-centre analysts usually sympathetic to tax cuts.4 That appears to be the early response here – Julian Jessop described the proposal as well-intentioned but unfair, complex, vulnerable to avoidance, and bad for productivity.
The fairness problem
The proposal has an “horizontal equity” problem – because people in a very similar position would be treated very differently.
A plumber contracted to work 50 hours and earning £50k will have a very different tax bill from a plumber contracted to work 40 hours and earning the same amount. Pay will vary wildly depending on the regular hours/overtime mix:
So there’s an obvious incentive created: contract for fewer hours, work more overtime (and if it’s guaranteed/compulsory overtime then there’s little risk to employer or employee).
Another incentive: don’t become self-employed. A self-employed plumber doesn’t have “overtime” so won’t benefit from the policy.5
The £75,000 cliff edge
Reform say the relief applies to workers earning “less than £75,000”.
The obvious reason is that, realistically, the policy has to have some kind of limit, or very highly paid workers would start claiming overtime. But a cap is a bad way to do it, as it creates a “cliff edge”: just below the threshold, overtime is income-tax-free; at or above it, the exemption disappears entirely.6
Take an example: a worker on £60,000 of ordinary salary with £14,999 of overtime. At £74,999 total pay, the overtime is income-tax-free. Their combined income tax and employee National Insurance is about £14,943. Now give them a £1 pay rise. Total pay reaches £75,000 and the overtime exemption disappears. Their tax and NIC jump to about £20,943. The £1 pay rise has made them about £5,999 worse off. The effective marginal deduction rate on that £1 is about 600,000%.7
This is much worse than the existing 60% marginal trap created by the £100,000 personal-allowance taper, because a taper is (by definition) smoother than a cliff edge.
We can visualise it here, in a chart showing how net (take-home) pay varies with gross pay for someone with £15,000 of overtime. Right now, that chart is smooth. Reform UK’s policy creates a £75,000 cliff:
This worker loses £6,000 at a penny pay rise that takes them over the £75,000 limit, and doesn’t get back to where they were until they’re earning £85,000. We’ve seen before that this kind of effect has real consequences – people hold back their hours/income to avoid falling over the cliff.
That’s bad for growth.
The obvious fix is to phase out/taper the exemption, which is what the US rules do. That makes the exemption more expensive and adds complication – and you still have a high marginal rate (just not 600,000%).
A better fix is: don’t introduce rules like this.
Where does Reform UK’s £5bn estimate come from?
They don’t say – but we think it’s a simple static estimate, perhaps with a small adjustment for dynamic effects.
A simple way to replicate it is like this:
- ONS data8 gives 28.89m employee jobs, with mean weekly overtime pay of £14.20 across all of them (including jobs with no overtime)
- That is about £21.3bn of paid overtime per year.
- Apply a blended income tax rate of 23% and you get ~£5bn.9
We also created a more complex (but still approximate) model which uses ONS data10 to apply 2026/27 income tax bands and the £75,000 threshold properly, and that gives a slightly lower number of about £3.7bn to £4.0bn.11
So £4-5bn is in the right ballpark for what HMRC would lose if behaviour stayed constant. But that is the wrong question. The correct question is: what would the policy cost once people respond to it? And what is the economic benefit of the policy?
Our estimate of the actual impact
People will respond to changes in tax by changing their behaviour, and sometimes by working more or working less. But there’s a much bigger effect. The response of taxable income to tax changes — what economists call the “elasticity of taxable income”, or ETI — is dominated not by real behavioural changes, but by people changing the form, timing and label of their income to reduce their tax bill.12 So when a new tax boundary is drawn — between ordinary pay and overtime — we should expect these effects to dominate.
We worked with two economists to approximately model these effects. We consider three separately. The first is positive: people genuinely choosing to work more overtime because the post-tax reward is higher. The second is pure cost: hours re-reported or restructured as overtime. The third is also cost: the creation of artificial overtime using personal service companies.
This chart shows the impact of these effects in three scenarios:
Undoubtedly there would be attempts to limit these effects through anti-avoidance rules. But that runs into a basic problem: there is no substantive difference between 50 contracted hours and 40 contracted hours plus 10 hours of overtime. If the rules test whether someone’s working hours changed after the exemption was introduced, then they either prevent the very behaviour the policy is supposed to encourage, or they fail to stop new jobs being designed with fewer contracted hours and more overtime hours. There is no perfect solution: there will always be “leaks”, and attempts to plug them with anti-avoidance would just add complexity for normal businesses. And all these rules would have to be created from scratch – there’s no tax definition of “overtime” today.
1. The positive effect
Removing income tax increases the reward from overtime – and that’s clearly the intention of the policy. For a basic-rate taxpayer the net reward rises from about 72p to about 92p per £1 of overtime. For a higher-rate taxpayer (below the £75k limit), from about 58p to about 98p. These are sizeable effects, and some people will respond by working more hours.
How many more? Modern estimates of the intensive-margin labour-supply elasticity — how much extra work people do when net wages rise — cluster between 0.1 and 0.3.13 In plain English, if the take-home reward for an extra hour rises by 10%, the evidence suggests people work only about 1% to 3% more hours.
Applying those elasticities to the eligible UK overtime base gives modest numbers: extra overtime pay of about £0.8bn to £1.3bn a year, extra NIC receipts of about £0.16bn to £0.26bn, and extra output/GDP (the genuine productivity gain) of about £0.9bn to £1.5bn:
It’s surprising to see such small effects, but there’s a simple reason: there’s only about £16.8bn of overtime below £75,000 in the ONS data.14 There’s just not much space for the policy to have any impact.
A more subtle problem: more hours is not the same as more output. A long literature finds that productivity per hour falls as weekly hours rise, particularly above 40-50 hours.15 A policy that incentivises the 41st, 50th and 60th hour of a worker who is already full-time is not obviously the best way to raise UK productivity. We do not attempt to account for this effect, so the output/GDP figures above may be overstated.
2. Hours re-reported as overtime
While the potential economic upside is limited, the downside risk is much larger: there are many more people whose existing hours could be reclassified as overtime, or whose future contracts could be written with fewer basic hours and more overtime.16
This is not a hypothetical. Robert Jenrick has said “I don’t expect that’s the way it’s going to work and there’ll obviously be anti-avoidance”.17 Anti-avoidance is invariably what governments say when a relief opens an obvious door; it almost never fully closes it, but always adds complication.18
There is a very large potential for such effects here. We estimated that 19, about £868bn of employee pay sits below the £75,000 threshold. If even 1% of that pay were relabelled as tax-free overtime, the income-tax cost would be about £2.2bn. If 5% were, it would be about £10.8bn. If 10% were, about £21.2bn.
We can do better than guesswork. France ran almost exactly the same policy as Reform UK suggest back in 2007 – the “loi TEPA” – and created a wide exemption from both income tax and (importantly) employee social-security contributions on overtime hours.
The French scheme had a significantly greater incentive effect than Reform’s proposal — it removed social-security contributions as well as income tax; moreover French income tax rates were significantly higher than UK rates. However people had fewer opportunities to game the system, because France had a statutory 35-hour working week.
An analysis by Cahuc and Carcillo (2014)20 found no significant effect on the actual hours worked, but a sharp rise in declared overtime, concentrated among skilled workers whose hours were hard to verify.
Overtime declared by skilled French employees rose by 1.3 hours per week more than their actual hours rose.21
If the French declared-overtime effect was simply transplanted onto the UK, the additional revenue cost would be in the order of £1.9bn (the 0.4-hour all-worker French estimate), £3.4bn (the 0.7-hour skilled-worker estimate), or £6.3bn (the 1.3-hour stress case for hard-to-verify roles), applied across eligible UK full-time jobs.
But we should expect a worse result in the UK than that simple transplant suggests, for two reasons that pull in opposite directions, and which we can (very approximately) quantify:
- The per-£ incentive is smaller in the UK. France exempted both income tax and employee social contributions, worth roughly 33p of tax saved per €1 of overtime for a typical worker. Reform exempts only income tax: about 20p per £1 for a basic-rate worker, 40p for a higher-rate worker, and around 21p on average across the eligible under-£75k full-time base, using ONS data22.23 So the UK per-£ incentive to mis-label pay is around two-thirds of the French one.
- The addressable workforce is much larger in the UK. The French 35-hour week was a statutory labour-law boundary enforced by URSSAF and the inspection régime: any hour declared as “overtime” had to be a real hour worked beyond a contractual 35h limit. That confined the French response to a narrow group — roughly 15% of private-sector employees, the cadres and professions intermédiaires with hard-to-verify hours. The Reform proposal has no equivalent statutory anchor at 40 hours. Any UK full-time contract under £75,000 can be drafted or redrawn so that pay above 40 hours is “overtime”, which plausibly puts 30%–70% of eligible workers within reach of the relabelling channel.
Combining the two — smaller per-£ saving but a 2x–5x larger addressable population — gives a UK “distortion potential” roughly 1.3x to 3x France’s.24
If we scale the French IPP declared-overtime numbers by that ratio rather than transplanting them, the implied UK declared-hours channel is around £2.5bn (low), £7bn (central), or £19bn (stress) per year — i.e. roughly double the unadjusted French numbers across the range. Both versions are shown below.
This is all highly approximate, and should be regarded as indicative rather than a forecast. However even the central figure here is more than the entire £5bn Reform attributes to the policy — and this is just one effect.
3. Directors and personal service companies
The biggest challenge to this policy comes from a category of taxpayer who could exploit this relief almost trivially: owner-managers of single person “personal service” companies.25 PSCs have always responded very quickly to potentially favourable tax changes, and we expect they would do here.26
There are at least three distinct mechanisms through which people could restructure to use the exemption.
- New companies. Self-employed people could incorporate so that what was previously self-employment profit becomes director remuneration, with part of it labelled as tax-free overtime. Many self-employed would regard that as fair; after all, they are just equalising their position with their employed peers. Our very approximate estimate is that the impact could be anywhere between £0.1bn and £4bn.27
- Dividend substitution. Existing PSCs could replace taxed dividend extraction with income-tax-free “overtime salary”. Our very approximate estimate of the impact is between £0.2bn and £1.9bn.28
- Wage recharacterisation. Existing director salary could be relabelled: 50 hours of salary becomes 40 hours of ordinary pay plus 10 hours of tax-free overtime. Our very approximate estimate of the impact is between £0.33bn and £2.7bn.29
It’s important to note that the dividend and wage effects would not necessarily be artificial. Self-employed people often work much more than 40 hours. The “overtime” would in many or most cases be real. People using this strategy could – entirely fairly – say they were just trying to achieve the same result as an employed individual.
Adding those illustrative channels gives a PSC/legal-form exposure of roughly £0.7bn to £8.5bn a year if the loophole were not closed. We should repeat that these are approximate estimates and not forecasts.
The obvious response would be to simply exclude directors from ever benefiting from the policy. This is not as straightforward as it sounds – the boundary between a PSC and a “real” business is not always sharp and well-defined. People would game any simple exclusion. For example, a rule that simply says there is no overtime exemption for a director/employee could be fooled by a plumber appointing her husband as the sole director.
Anti-avoidance also creates complication for “normal” small companies that wish to take advantage of the exemption. For example: you deal with the “husband” scenario by excluding companies with connected employees and directors. People then try using other relatives, nominees, partnerships, umbrella-style structures, or several PSCs bundled into one trading company. So the rules have to look through legal form and ask who really controls the business, who benefits from the work, whether several companies are in substance one business, and whether the pay is genuinely overtime or just relabelled salary. That kind of anti-avoidance arms race is familiar in tax: each simple rule creates a workaround; each workaround requires a more complex rule. The result is that ordinary small companies have to take advice on whether they are caught by rules aimed at avoidance.
The anti-avoidance also increases the administrative cost for HMRC. That’s something we don’t cover in this report, but given “overtime” is not currently a tax concept, HMRC would have to create administrative and enforcement systems from scratch.
Who benefits from Reform’s tax cut?
This chart shows how Reform’s proposal – if it worked as advertised – compares with two alternatives: a simple income tax cut and simple employee national insurance cut. Each square represents one per cent of all UK workers, with darker shading showing a greater cash benefit from the tax cut – you can tap/hover on a square to see exact figures:3031
The benefit of the tax cut goes to about 10% of all workers – the 3.2 million employees who currently receive any paid overtime.32 Self-employed workers and the 89% of employees with no paid overtime get nothing.
A £5bn basic-rate cut reaches about 85% of workers – most income-tax payers in employment and self-employment.33 A £5bn employee-NIC cut reaches about 76% of workers – self-employed workers receive nothing.34
This still looks successful by one metric – the lucky 10% receiving the tax cut receive much more than than they would under a cut in income tax or National Insurance. Comparing the medians, it’s six times more. That hides a big discrepancy in individual returns – there will be a small number of very large winners.
But, as we have discussed, the policy is unlikely to work as expected. Our central estimate is that the policy will not cost £5bn but about £14bn, once relabelling, contract redesign and personal-service-company arbitrage are factored in. A chunk of that benefit goes to people who are not workers (e.g. directors of personal service companies). This inefficiency means that the benefit of the tax cut is “leaking” from its desired beneficiaries – so there is a much narrower gap between the median amount they’d receive under the overtime exemption than under an equivalent income tax or National Insurance cut:35
We think this chart demonstrates that, even if we factor in the benefit to the intended recipients of the tax cut, the overtime exemption makes little sense. The median cash benefit of the overtime exemption is only twice the benefit if the employee national insurance cut, but it’s going to a third as many people. It’s just a deeply inefficient tax cut.
Tax cuts: getting the most “bang for the buck”
We’ve analysed a range of possible £5bn tax cuts. All have more economic impact than Reform UK’s exemption for overtime. The chart below shows the range of possible effects:
This understates the problem with Reform UK’s proposal because, for the reasons explained above, their “£5bn tax cut” in reality will cost significantly more. So the chart in the introduction to this article presents the same data differently to show the “bang for the buck” – the maximum GDP benefit per £ of revenue foregone from the tax cut (taking the mid-point cost of the tax cut).
(And apologies; the headline says “ten” but there are actually eleven.)
Looking at each of the potential tax cut in turn, with approximate estimates of the cost and GDP impact:
- Abolish stamp duty on shares (SDRT and stamp duty) – cost ~£3.8bn. This is a textbook bad tax: stamp duty depresses share prices, raises the cost of capital for listed UK firms, and gives an unjustified advantage to debt over equity. People often wonder why UK markets underperform and struggle to attract IPOs – here’s one reason. Oxera estimates a one-off 4% rise in UK equity valuations (~£99.8bn) and a permanent GDP boost of 0.2%–0.7% (£5bn–£17bn a year). Here we cautiously assume a £3.8bn cost, but Oxera suggested the net cost could be very small or even zero. 36
- Abolish (or smooth out) the £100,000 personal-allowance taper – cost a few £bn. The taper creates a 62% marginal rate between £100,000 and £125,140, rising to 71% with Plan 2 student loans and ~78% for a Scottish graduate with three children, before falling back to 45%. It’s one of the worst features of our tax system, and incentivises doctors, IT contractors and other skilled workers to cut their hours.37 Plausibly boosts long-run GDP by up to £5bn/year.38
- Cut residential stamp duty land tax (SDLT) – every £5bn saved buys you roughly 40% of SDLT. The Mirrlees Review described SDLT as “a strong contender for the UK’s worst-designed tax” – since then it has gone up three times.39HMRC’s own analysis suggests a 1 percentage point change in the effective rate moves residential transactions by 5–7%, with knock-on effects on labour mobility, downsizing and housing supply. See our suggestion for how to phase abolition in without raising prices.40
- Cut employer NICs by ~0.5 percentage points (15% → 14.5%) – cost ~£5.6bn.41 We described Labour’s increase in employer NICs as one of the worst possible tax increases. Long-run incidence falls almost entirely on workers, in the form of depressed wages for higher-paid workers, and fewer lower-paid jobs.42 The OBR forecast that Labour’s £25bn employer-NICs rise would knock 0.1% off potential output; reversing part of it would do the opposite, with about 50,000 fewer “lost” jobs per percentage point.
- Cut the main rate of employee NICs by 1p (8% → 7%) – cost ~£5.35bn.43 A clean, universal cut to the marginal tax rate on labour for every employee earning above the primary threshold. Unlike the overtime gimmick, it applies to every extra hour worked, including the hours of part-timers and the self-employed equivalent through Class 4 alignment. It cannot be gamed by relabelling – in fact the opposite: reducing employee National Insurance reduces the incentive to relabel employment as self-employment. Long-run GDP benefit of up to £2.7bn/year.44
- Extend full expensing to leased plant and machinery and to structures – cost a few £bn.45 Investment incentives address a real economic distortion (the tax bias against equity-financed and long-lived capital), rather than a labelling convenience. Potential GDP benefit of up to £3bn.46
- Cut the basic rate of income tax by ~0.75p (20% → 19.25%) – cost ~£5.2bn. Affects ~30 million taxpayers, well-targeted at the working population the overtime policy claims to help, and doesn’t create avoidance opportunities. GDP boost of up to £1.7bn.47
- Raise the personal allowance by ~£600 (£12,570 → £13,170) – cost ~£4.9bn. Takes ~300,000 of the lowest earners out of income tax altogether, partially undoing the fiscal drag built up since the 2021 freeze. Progressive, simple to administer, impossible to avoid by relabelling, and a GDP boost of up to £1.7bn. 48
- Abolish the apprenticeship levy and replace it with a real skills budget – cost ~£4bn. In economic terms it functions as an extra 0.5% payroll tax on large employers with weak links to actual training.49 Replacing it with a properly designed skills levy or direct skills budget could plausibly boost productivity rather than depress it, with a long-run GDP boost of up to £1.7bn.50
- Cut the Universal Credit taper from 55% to ~48% and raise work allowances – cost roughly £3–5bn. Lower-paid workers in UC currently face effective marginal rates of 70%+. A taper cut is the single best-targeted way to make work pay at the bottom of the income distribution – exactly the people Reform’s overtime policy mostly excludes. Potentialy GDP impact of up to £2bn.51
- Abolish the High Income Child Benefit Charge (HICBC) – cost ~£1.5bn. HICBC creates an effective marginal rate of ~60–70%+ for parents earning £60,000–£80,000 (worse with more children), based on the higher earner’s income only. It is widely regarded as unfair and borderline-unworkable in its current design and is a serious work disincentive for parents. Combine with smoothing the £100,000 free-childcare and personal-allowance cliffs and we’d have a coherent ~£3–5bn “make work pay for parents” package. Plus a potential GDP boost of up to £0.9bn.52
People will have different views on the best use for £5bn. Our point is that there are at least ten serious, evidenced-based uses of £5bn that would do more for growth and fairness than a tax-free overtime label. Reform UK has, on the available evidence, picked one of the very worst.
Many thanks to K and B for economic modelling and P for the initial draft. Thanks to C for suggesting the “waffle charts“.
The code for the modelling and charts is in our GitHub repo.

Universities UK: a £6bn lesson in bad tax policy

The £34bn cost of Reform UK’s “Britannia card” proposal
Untaxing – The Laffer curve, and the napkin that changed the world

Tax cuts and tax rises: do tax cuts pay for themselves?

Our take on the Reform UK manifesto
Banks say they’re overtaxed. The TUC says they’re undertaxed. Who’s right?
Footnotes
For example, the Liberal Democrats proposed a tax on share buybacks, and estimated the revenue by simply multiplying the total volume of share buybacks by their proposed tax rate. They’d forgotten that they’d be creating an incentive not buy-back shares, and so the actual revenue would be much smaller – possibly zero. This is a well-known effect: public debate often assumes that a tax preference will achieve its intended social objective, but in practice the politics and design of the preference can produce base-narrowing, special pleading and poorly targeted reliefs. ↩︎
But not National Insurance. ↩︎
See IRS, FAQs on the deduction for qualified overtime compensation (23 January 2026), confirming the deduction applies for tax years 2025 to 2028 and “generally” to the half portion of time-and-a-half. ↩︎
e.g. the Cato Institute, the Tax Foundation, the Committee for a Responsible Federal Budget. ↩︎
A plumber could get round that by setting up their own company, and making themselves their own employee. More on that below. ↩︎
This kind of discontinuous tax boundary — economists call it a “notch” — is well known to be highly distortionary. The classic theoretical and empirical treatment is Kleven and Waseem (2013), who show that notches generate large bunching of taxpayers below the threshold and, where the notch is severe, a “dominated” region above it that no rational person should occupy. See also Kleven (2016), and Saez (2010). ↩︎
Calculations use 2026/27 England, Wales and Northern Ireland income tax rates (20%/40%/45% above the £12,570 personal allowance) and employee Class 1 National Insurance (8% to £50,270, then 2%). Student loans, pensions, child benefit clawback and benefit interactions are ignored. The model treats the BBC’s “less than £75,000” wording strictly: £75,000 is outside the exemption. £14,999 overtime case: tax+NIC of £14,943 at £74,999 gross becomes £20,943 at £75,000 (rise of £6,000 on a £1 pay rise, i.e. about 600,000%). ↩︎
See ONS, Earnings and hours worked, all employees: ASHE Table 1, 2025 provisional edition. This is the Annual Survey of Hours and Earnings (ASHE) dataset. ↩︎
28.89m employee jobs x £14.20 mean weekly overtime pay x 52 weeks ≈ £21.33bn. £5bn/£21.33bn = 23.4%, which is a plausible blended marginal income tax rate across basic-rate, higher-rate and untaxed workers. ↩︎
See ONS, Earnings and hours worked, all employees: ASHE Table 1, 2025 provisional edition. This is the Annual Survey of Hours and Earnings (ASHE) dataset. ↩︎
A crude “above 40 hours” adjustment using only full-time overtime pay brings it to about £3.3bn. Our model uses published annual-pay percentiles to build a synthetic earnings distribution, applies 2026/27 England/Wales/Northern Ireland income tax bands, treats the £75,000 threshold as a hard cliff, and assumes paid-overtime incidence of 11% (consistent with Reform UK’s own figure of 3.2 million workers and 28.89m employee jobs, i.e. 3.2/28.89 = 11.1%). Equal allocation of overtime across overtime recipients gives £3.7bn; income-proportional allocation gives £4.0bn; restricting to full-time workers gives about £3.3bn. The ONS “overtime pay” measure is employer-defined and not strictly hours above 40, but it is the best public proxy. Full code is published in our GitHub repo. ↩︎
See Feldstein (1995), Saez, Slemrod and Giertz (2012) – the latter concluding that headline ETI estimates “predominantly reflect tax-avoidance responses rather than real labour-supply or production responses”. See also Slemrod (1995). UK-specific evidence on the high-income response — most of it relabelling rather than real work — is HMRC (2012). ↩︎
For the UK estimate, see the Department for Transport-commissioned report on Estimating labour supply elasticities (2025), which estimates UK intensive-margin labour-supply elasticity at around 0.12 in 2024, down from about 0.20 in 1997. There are more international studies, and a meta analysis which removes publication bias effects. ↩︎
See ONS, Earnings and hours worked, all employees: ASHE Table 1, 2025 provisional edition. This is the Annual Survey of Hours and Earnings (ASHE) dataset. ↩︎
See Pencavel (2015), which finds output rises proportionally with hours up to about 49 hours per week, then falls. Collewet and Sauermann (2017) find similar diminishing returns. The Treasury’s own guidance on cost-benefit analysis treats output per worker as broadly linear in hours only over moderate ranges. ↩︎
Some of the tax benefit may also be captured by employers. For example, an employer and employee could agree a lower gross salary, with more pay labelled as overtime, leaving the employee with higher take-home pay and the employer with lower employment costs. Everyone wins, except HMRC. We do not attempt to model these effects. ↩︎
Trevor Phillips set out the scenario in his interview: “pay the first 40 hours at minimum wage and then I can pay the overtime at some exorbitant rate and everybody wins except the taxman”. Jenrick’s reply was that anti-avoidance measures would prevent it, without specifying any. The Treasury’s own VAT and corporation-tax anti-avoidance experience suggests that anti-avoidance after the fact rarely fully closes off the response opened up by a poorly-targeted relief: see HMRC’s annual Measuring tax gaps publication, where avoidance and error attributable to legal-form and labelling choices have remained material despite repeated anti-avoidance rounds. ↩︎
The wider economics literature on income shifting in response to tax differentials between labels is summarised in the Mirrlees Review chapter on small business taxation: where the tax system gives different treatment to economically similar income, the boundary is “fragile” and erodes. ↩︎
See ONS, Earnings and hours worked, all employees: ASHE Table 1, 2025 provisional edition. This is the Annual Survey of Hours and Earnings (ASHE) dataset. ↩︎
They used a difference-in-differences analysis using cross-border workers as a control group. The result was confirmed by a subsequent study of the 2012 reversal of the policy by Tuda (2022). ↩︎
Institut des politiques publiques (March 2012): “the reform has driven a growth of 1.3 declared overtime hours every week more than the variation in actual hours worked among this group of employees”. ↩︎
See ONS, Earnings and hours worked, all employees: ASHE Table 1, 2025 provisional edition. This is the Annual Survey of Hours and Earnings (ASHE) dataset. ↩︎
Weighted using 2025 full-time annual-pay percentiles: roughly 70% of eligible employees are in the 20% basic-rate band, ~18% in the 40% higher-rate band, and ~12% below the income tax threshold. Employee NIC is preserved by the Reform proposal so does not enter the saving. See code/overtime_france_uk_comparison.py. ↩︎
Distortion potential = per-£ marginal employee tax saving × share of workforce able to relabel. France: 33% × 15% ≈ 4.95. UK: 21% × 30%–70% ≈ 6.3 to 14.7. ↩︎
HMRC’s 2024 company owner-manager survey estimated about 1.9m UK companies have at least one owner-manager, and 36% of those owner-managers described their company as a “personal service company”, implying a PSC population of at least 665,000 (since we expect self-declaration will result in an under-count). ↩︎
The behavioural pattern is well documented: small companies and PSCs respond to changes in the relative tax cost of salary vs dividend extraction, and to changes in the tax cost of incorporation itself. See Adam, Miller and Pope (2017), Mirrlees Review (as above); and Miller, Pope and Smith (2021). IFS work on small-company taxation also documents the sharp incorporation response to the 0% starting rate of corporation tax in 2002-03 — a textbook example of how legal-form tax incentives drive behaviour. ↩︎
The potential for new PSCs is large because the population is large. HMRC’s latest personal income statistics say there were 5.34m individuals with at least one self-employment income source in 2023-24, of whom 3.67m were taxpayers. HMRC, Personal Incomes Statistics 2023 to 2024: Commentary, says the number of individuals with at least one self-employment income source was 5.34m, of whom 3.67m were taxpayers. The significant shift to incorporation has much reduced in the last few years, as the benefit declined. If 5% to 20% of those self-employed taxpayers incorporated and shifted £10,000 to £20,000 into exempt overtime salary, the additional cost would be roughly £0.1bn to £4.0bn a year. This is a quick sensitivity analysis, not a forecast. The low case is 3.67m taxpayers x 5% adoption x £10,000 shifted x 6% tax saving = £0.11bn. The high case is 3.67m x 20% adoption x £20,000 shifted x 27% tax saving = £3.96bn. The 6% saving approximates a basic-rate self-employed person moving from 20% income tax plus 6% Class 4 NIC to exempt salary bearing employer and employee NIC. The 27% saving approximates a higher-rate self-employed person moving from 40% income tax plus 2% Class 4 NIC to exempt salary bearing employer NIC and 2% employee NIC. HMRC’s 2026-27 NIC rates are 15% employer NIC, 8% main employee NIC, 2% additional employee NIC, 6% main Class 4 and 2% additional Class 4: see Rates and allowances: National Insurance contributions. ↩︎
Existing PSCs already decide how much value to extract as salary and how much as dividends, all complicated by IR35. If 25% to 50% of the estimated PSC population shifted £10,000 to £20,000 of company cost from dividends to “overtime salary”, the additional cost would be about £0.25bn to £1.9bn a year. The dividend sensitivity uses 665,000 PSCs, 25%-50% adoption, £10,000-£20,000 shifted company cost, and a tax saving of about 14%-28% of shifted cost. The saving is corporation tax plus dividend tax avoided, less employer and employee NIC still due on the overtime salary. The model gives £0.24bn, £0.61bn and £0.93bn for low, central and high £10,000-shift scenarios, and £1.86bn where the high case shifts £20,000. ↩︎
If 25% to 50% of the estimated PSC population relabelled £10,000 to £20,000 of salary, the income-tax cost would be about £0.3bn to £2.7bn a year. This calculation treats the relabelled amount as gross salary, not company cost. At basic rate, £10,000 of relabelled salary saves £2,000 of income tax; at higher rate, £10,000 saves £4,000. Applying 25%-50% adoption to the 665,000 PSC population gives about £0.33bn at the low end (25% x £10,000 x 20%) and £2.66bn at the high end (50% x £20,000 x 40%). Employer and employee NIC are assumed still to apply, so the model counts only the income tax loss. ↩︎
Cost ratios from HMRC’s “direct effects of illustrative tax changes” bulletin, January 2025, on a 2026-27 basis: 1p on the basic rate of income tax raises £6,900m, so £5bn buys a cut of 5,000/6,900 ≈ 0.72p; 1p on the main rate of Class 1 employee NICs raises £5,350m, so £5bn buys 5,000/5,350 ≈ 0.93p. Self-employed Class 4 NIC is a separate tax with its own rate and would not be cut unless explicitly aligned. ↩︎
Workforce denominators are from the ONS Labour Force Survey for 2025 (~33m UK workers = ~28.9m employees + ~4.4m self-employed). Within-row distributions are built from ASHE 2025 annual-pay percentiles, smoothed into a continuous income distribution using a log-linear quantile fit (with a fitted lognormal tail above the 90th percentile). For each policy we compute the £ saving for every income, sort the eligible population from largest to smallest saving, and allocate each 1% slice to one waffle square. Each square’s shade is a continuous function of its £ saving (sub-1 gamma, so small amounts still show as a discernible tint rather than washing out to white). The summary figure on the right of each row is the median saving across the beneficiary group — for skewed distributions like overtime, the median is much lower than the mean.
To allocate £5bn across the 3.2 million recipients we use the same income-proportional model that drives our underlying static cost calculation (overtime_static_estimate.py): the £21bn of total paid overtime pay reported in ASHE is shared across recipients in proportion to their gross pay, and each worker’s income-tax saving is then computed exactly using the 2026-27 England/Wales/NI bands, with a hard £75,000 cliff. The resulting distribution is highly skewed: the median recipient saves about £1,197 a year, but the top 1% of overtime recipients save roughly £4,600 a year and a thin top tail saves more. Self-employed workers (about 13% of UK workers) and the 89% of employees with no paid overtime get nothing. ↩︎
ASHE 2025, Table 1.4a “Overtime pay”. Paid overtime is reported by about 11% of employee jobs; 3.2 million / 33 million UK workers ≈ 10%. The median weekly overtime pay among those receiving any is £59.80, equivalent to about £3,110/year. Applied to a basic-rate taxpayer this gives an income-tax saving of about £622/year. Self-employed workers (about 13% of UK workers) get nothing because they have no employee overtime. ↩︎
About 88% of employee jobs and roughly 75% of self-employed earn above the £12,570 personal allowance. Weighting by the 28.9m/4.4m mix gives roughly 85% of all UK workers. ↩︎
Self-employed workers pay Class 4 NIC, not Class 1; an employee-NIC cut as scored by the HMRC ready-reckoner does not flow through to them. About 88% of employees are above the £12,570 primary threshold and so benefit; 0.88 × 28.9m / 33m ≈ 76% of all UK workers. Full-time median annual pay, ASHE 2025 Table 1.7a (Full-Time). Calculations apply the relevant rate to the band between £12,570 and the basic-rate / NIC ceiling. ↩︎
But, as we have discussed, the policy is unlikely to work as expected. Our central estimate is that the policy will not cost £5bn but about £14bn, once relabelling, contract redesign and personal-service-company arbitrage are factored in. A chunk of that benefit goes to people who are not workers (e.g. directors of personal service companies). This inefficiency means that the benefit of the tax cut is “leaking” from its desired beneficiaries — so there is a much narrower gap between the amount they’d receive under the overtime exemption than under an equivalent income tax or National Insurance cut:35The dynamic chart applies the same per-square-by-£-saving construction as the static chart, scaled up to a £14bn policy cost and split into three sub-populations for the overtime exemption. Each square’s £ figure is the mean saving of that 1% slice; squares are shaded by amount within each sub-population’s hue. The overtime row uses red for real existing-overtime recipients and a full-saturation orange ramp for artificial overtime (relabelled hours or repackaged salary). The basic-rate (£14bn ≈ 2.03p) and employee-NIC (£14bn ≈ 2.62p) rows are scaled-up versions of the static-chart distributions; their per-square £ figures are computed the same way. We have modelled the four sub-populations of the £14bn as follows: ↩︎
- About £7bn flows to the ~10% of workers who already receive paid overtime. That includes the £3.8bn static cost of a tax cut on existing overtime, about a £0.2bn cost of a tax cut on new overtime incentivised by the measure, and about £3bn of the “declared-hours” recharacterisation effect — workers and employers reporting more hours as overtime without actually working more. The static cost of about £4bn comes from the income-proportional model in overtime_static_estimate.py. Per-square £ figures use that same income-proportional shape, rescaled so the band totals £7bn across the 3.2m recipients. The declared-hours element is calibrated from the French 2007 evidence (IPP, 2012; Cahuc & Carcillo, JLE 2014) which is for existing overtime recipients declaring more hours. Even at the lower end of that range, the bulk of the recharacterisation accrues to workers who already have employer machinery for paid overtime.
- About £1.5bn flows to the ~4% of workers currently doing unpaid overtime whose extra hours start to be formalised as paid overtime once paid overtime carries an income-tax advantage. We assume about one in three of the roughly 4.6 million UK workers who currently do unpaid overtime see some conversion. Drawing on the TUC’s “Work Your Proper Hours Day” estimate of about 4.6 million UK workers doing unpaid overtime worth around £24bn/year. We assume only a fraction is converted to paid overtime — most employers will not start paying for hours they currently get free, but a non-trivial share will. This is the smallest channel because it requires employer cooperation. Within-band shading uses the same income-proportional saving shape as band 1, rescaled so the four squares total £1.5bn.
- About £2.9bn flows to the ~9% of workers who currently do no overtime at all but whose contracts are restructured into “base pay plus guaranteed overtime”, so that part of an existing salary is relabelled as tax-free overtime. This is the contract-redesign channel modelled in overtime_contract_redesign_model.py. The central case implies several £bn of tax at risk; we have allocated a conservative slice here. Within-band shading uses the income-proportional shape, rescaled so the nine squares total £2.9bn; the darkest oranges in this band correspond to higher-paid workers whose marginal income-tax rate and absolute repackaging gain are largest.
- About £2.6bn is collected by personal-service-company owner-managers and directors — about 600,000 people, around 2% of UK workers — paying themselves through “overtime” wages instead of dividends or ordinary salary. Our PSC/director arbitrage model is in code/overtime_psc_director_model.py. It uses HMRC’s 2024 company owner-manager survey estimate of 1.85m UK companies with at least one owner-manager, 36% of which describe themselves as personal service companies, giving about 665,000 PSCs. The £2.6bn figure sits between our central and high-shifted-amount scenarios; it assumes stronger reroute of dividends and around £20k of company-side cost shifted into “overtime” wages. These are not “workers receiving overtime” in any normal sense, and they are excluded from the waffle above.
Consistent with earlier IFS work finding that the tax is capitalised into prices and raises the cost of capital by roughly 0.7–0.9 percentage points. ↩︎
Discussed in detail in our piece How to reform income tax: end the high marginal rate scandal, October 2024. The IFS reaches similar conclusions. ↩︎
Our very approximate estimate. Abolishing the taper cuts the effective marginal rate from ~64% (62% income tax plus 2% employee NIC) to ~42% for around 1m people earning £100,000–£125,140. Applying the taxable-income elasticities of 0.2–0.4 standard for high earners (Saez, Slemrod & Giertz; used by HMRC for the additional rate and by the IFS for similar work) implies a long-run uplift in reported earnings of ~£6–14bn, of which roughly half is a genuine labour-supply/hours response and the rest is timing or shifting. Range conservatively rounded to £1–£5bn for the chart. ↩︎
See also Paul Johnson, Stamp duty is an economic nonsense, IFS, 2017. ↩︎
See HMRC statistics for the yield from residential SDLT. Two separate analyses from the Adam Smith Institute and CEBR imply a long-run GDP benefit of up to £4bn/year. ↩︎
The source is the HMRC “ready reckoner”: a 1 percentage point change in the Class 1 employer rate is worth £11,150m in 2026–27. ↩︎
The IFS estimates ~2/3 in the long run; the OBR assumed 80% for the 2021 Health and Social Care Levy – we summarised the evidence here. ↩︎
See HMRC “ready reckoner“. ↩︎
Our estimate. Roughly symmetrical with the OBR’s scoring of the 2024 employer-NIC rise (a ~£25bn rise reduces potential GDP by ~0.1%). A ~£5bn employee-NIC cut should therefore boost long-run GDP by 0.03–0.1% (~£0.8–2.7bn). The upper end allows for a marginally larger labour-supply response than on the employer side because the cut shows up directly in pay packets and is therefore more salient to workers. ↩︎
See OBR, The impact of corporation tax changes on business investment, and IFS, Full expensing and the corporation tax base, October 2023. Both find sizeable long-run investment and GDP effects from moving the corporation-tax base closer to economic depreciation. ↩︎
Our estimate. The OBR’s scoring of permanent full expensing for plant and machinery treated it as worth ~£3bn/year of additional business investment in steady state and around 0.1% of long-run GDP. The IFS has argued that extending the same treatment to leased assets and to structures would meaningfully enlarge that effect, by removing the remaining tax bias against long-lived capital. ↩︎
Static cost from HMRC “ready reckoner“: 1p on the basic rate is worth £6,900m in 2026–27. GDP is our approximate estimate. A 0.75p basic-rate cut lowers the marginal rate on labour by ~0.75pp for ~30m taxpayers. Using the implied aggregate labour-supply elasticity from the OBR’s 2024 employer-NIC scoring (an extra ~£25bn payroll tax knocks ~0.1% off potential output), a ~£5bn income-tax cut should boost long-run GDP by 0.01%–0.06% (~£0.3–1.7bn). ↩︎
HMRC “ready reckoner“: a £100 increase in the personal allowance costs £810m in 2026–27. Our very approximate GDP estimate: raising the personal allowance by ~£600 takes ~300k of the lowest earners out of income tax and gives every basic-rate taxpayer a ~£120 cut. The marginal-rate effect is small (limited to those moving from 20% to 0%), so the long-run gain is mainly extensive-margin participation. Using the same OBR-style aggregate elasticity implies 0.01–0.06% of GDP (~£0.3–£1.7bn). The dynamic effects may be larger given the observed distortions in income distributions. ↩︎
The apprenticeship levy raises about £4bn a year; we have argued for its abolition. The Fabian Society and others have documented its failure to deliver apprenticeships for young people. ↩︎
Our very approximate estimate. The levy functions as an extra 0.5% payroll tax on large employers with weak links to actual training. Abolition (or recycling into a properly designed skills budget) reverses a small slice of the payroll-tax wedge in the OBR’s NIC scoring – worth ~£0.3bn at the low end as a pure tax cut – with up to ~£1.7bn of additional long-run GDP if the replacement training spend delivers the productivity uplift the existing levy has failed to deliver. ↩︎
Resolution Foundation, Taper cut, October 2021, costed an 8 percentage point taper cut plus a £500 work allowance increase at about £3bn, benefiting 2.2 million working families. A further 7 percentage point cut would cost a similar amount. GDP figure is our very approximate estimate. A 7-percentage-point taper cut plus a higher work allowance lowers the effective marginal rate for ~2.2m working UC families (Resolution Foundation) from ~70–75% to ~63–65%. Applying the extensive-margin labour-supply elasticities of 0.2–0.4 typical for single parents and second earners to the affected earnings base gives ~£0.4–£2bn of additional GDP through extra hours and participation. The OBR scored the 2021 taper cut as having “small” but unquantified dynamic effects. ↩︎
HMRC, Annual Report and Accounts 2024 to 2025: our accounts and annexes: estimated £271m of HICBC liabilities relating to 2024–25. HMRC, Child Benefit Statistics: annual release, data at August 2024: 712,000 families opted out of payments, covering 1.06m children; 2024–25 Child Benefit rates were £25.60/week for the eldest child and £16.95/week for subsequent children. Our estimate: resumed payments for opted-out families cost ~£1.25bn; adding £271m of lost HICBC gives ~£1.5bn. HICBC creates an effective marginal rate of ~60–70%+ on parents earning £60,000–£80,000, based on the higher earner’s income alone. Applying second-earner/parent extensive-margin elasticities of 0.2–0.4 to participation around the threshold gives a long-run GDP uplift of order £0.1–£0.9bn – but the dynamic effects may be larger given the observed distortions in income distributions. ↩︎


Leave a Reply