
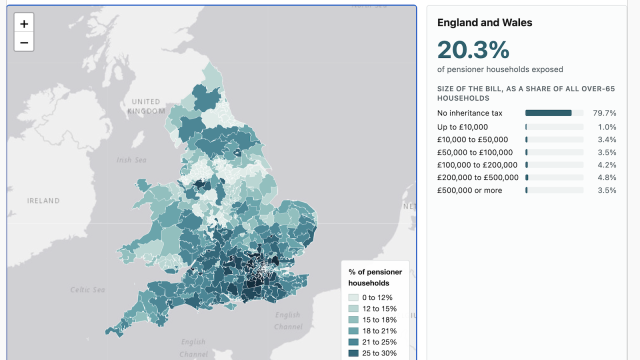
The hidden reach of inheritance tax: one in five pensioner households
Fewer than 5% of estates currently pay inheritance tax. But that statistic counts the dead; if we want to understand why inheritance tax is…
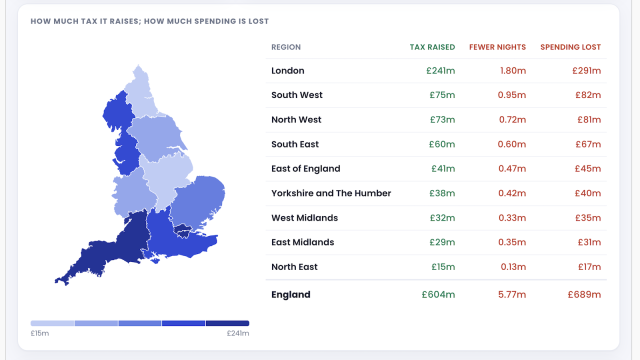
England’s new tourist tax: what it raises, who pays, and what it costs
Mayors across England are to be given the power to charge a tourist tax on overnight stays, expected to be around 5%. It would…
What would a land value tax actually do?
I just wrote in the Sunday Times about the political and economic case for a land value tax. I think the principled argument for…
What if Andy Burnham lowered the mansion tax threshold to £1.5m?
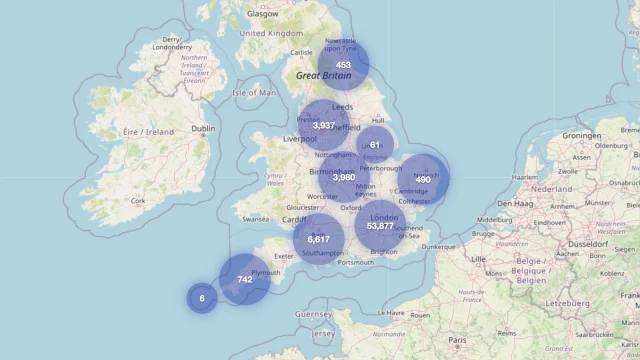
The November 2025 Budget introduced a “mansion tax” – formally, the “high value council tax surcharge” – an annual charge on homes worth £2m…

Has Britain run out of “other people” to tax?
British politics has spent a generation avoiding the same uncomfortable question: what if the government people want costs more than most voters are willing…
The UK has 90 different taxes. France has 348. Germany has 60. Why?
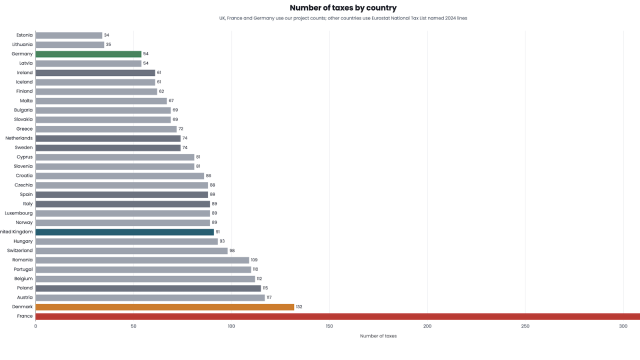
The UK has 90 different taxes – more than at any time since 1834. France, on the other hand, has 348. But Germany, which…
Leave a Reply