Treemap chart showing the shape of the UK tax system in 2021/22 for all taxes raising £1bn or more: The UK tax system is dominated by three main taxes: Income tax (£233bn), National Insurance (£158bn) and VAT (£149bn). Corporation tax is the fourth largest at £68bn, with all remaining taxes raising £35bn or less each.

Shape of the UK tax system, 2021/22, all taxes raising £1bn or more
Tax Policy Associates

Income tax: £233bn
National insurance: £158bn
VAT: £149bn
Corporation tax: £68bn
Council tax: £35bn
Fuel duties: £26bn
Business rates: £21bn
Stamp duties: £19bn
CGT: £16bn
Alcohol: £13bn
Tobacco: £10bn
Cars: £7bn
IPT: £7bn
IHT: £6bn
Customs duties: £5bn
Bank taxes: £4bn
APD: £1bn

The UK tax system in five infographics, and what we can learn from the fact they are boring

11 October 2022

2 Comments

The chart above shows the composition of the UK tax system – the contribution made by each of the different taxes.

It must have seen dramatic changes over the last forty years:

Not really:

Stacked bar chart showing the composition of UK tax revenues from 1978-79 to 2021-22: The UK tax mix has remained remarkably stable over four decades, with the three largest taxes consistently dominating: Income Tax (25% to 35%), National Insurance (around 15% to 20%), and VAT (growing from around 10% in the late 1970s to around 20% today). Smaller taxes including Corporation Tax, Council Tax, Business Rates, Fuel Duties, Stamp Duties, Alcohol Duties, and Tobacco Duties account for the remaining share, with duties showing a gradual decline.

How UK tax revenues have changed over time - all taxes

Y-axis: 0% to 100% (in 10% increments)
X-axis: Tax years from 1978-79 to 2021-22 (annual)

Tax series (from bottom to top):
- Income tax
- National insurance
- VAT
- Corp tax
- Council tax
- Business rates
- Fuel duties
- Stamp duties
- Alcohol duties
- Tobacco duties

Logo: TAX POLICY ASSOCIATES

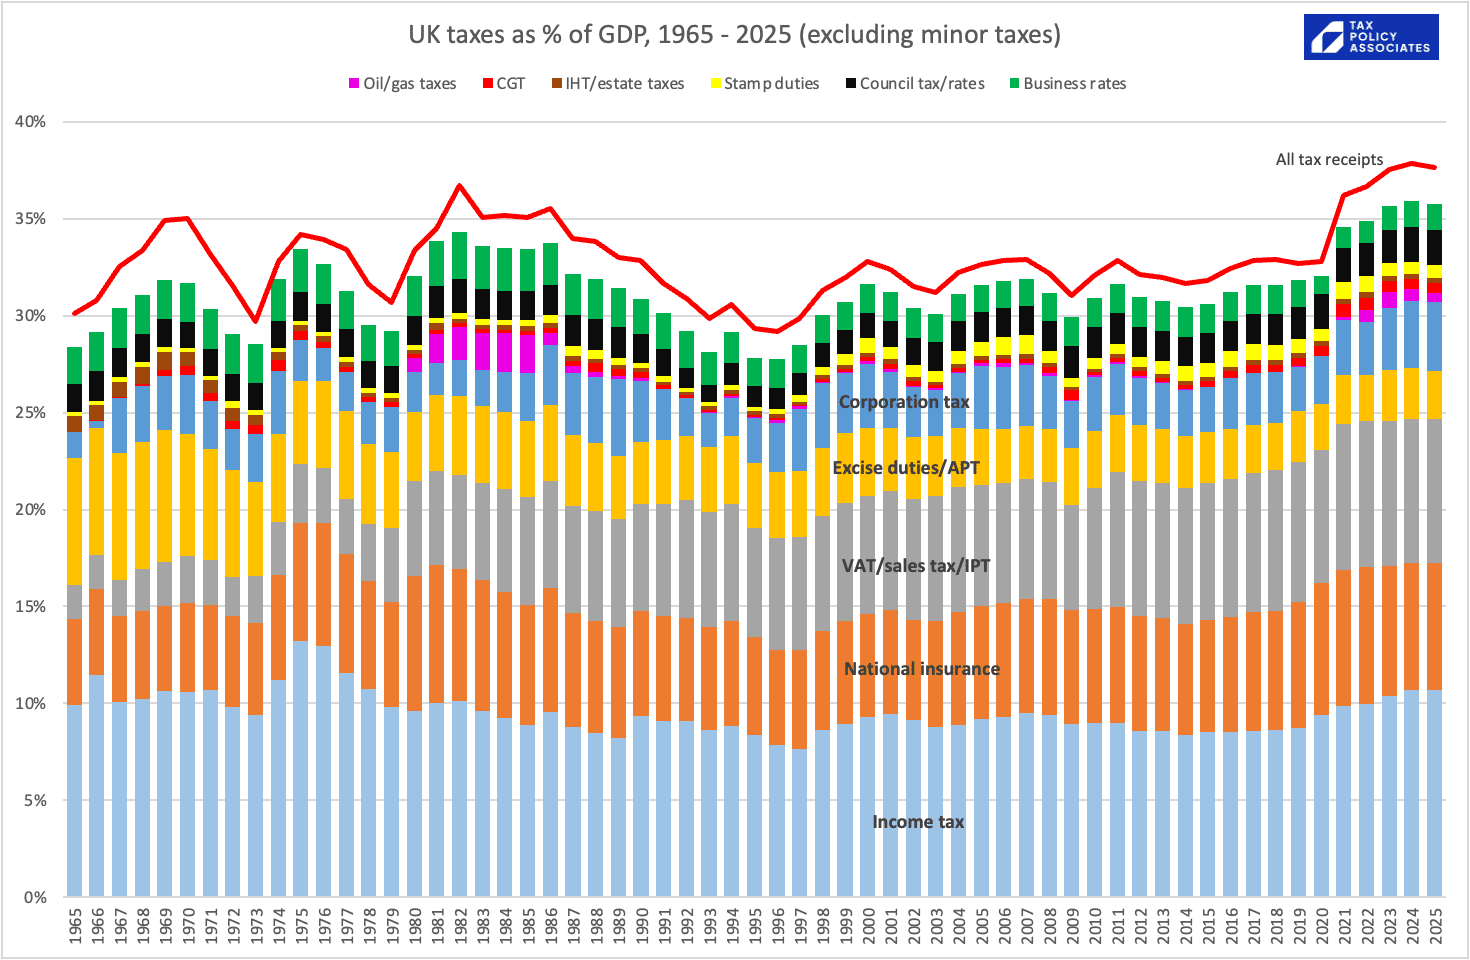
Or, over a longer period, and as a % of GDP:

Stacked bar and line chart showing UK taxes as a percentage of GDP from 1965 to 2025, excluding minor taxes: Total UK tax receipts have fluctuated between roughly 29% and 37% of GDP between 1965 and 2020, before climbing to a peak of around 37% in 2024-2025. Throughout the period, the bulk of revenue is consistently made up of five main taxes: Income tax, National insurance, VAT/sales tax/IPT, Excise duties/APT, and Corporation tax, with minor contributions from property, capital, and oil/gas taxes.

UK taxes as % of GDP, 1965 - 2025 (excluding minor taxes)
[Logo: TAX POLICY ASSOCIATES]

Legend:
Oil/gas taxes (magenta)
CGT (red)
IHT/estate taxes (brown)
Stamp duties (yellow)
Council tax/rates (black)
Business rates (green)

Categories labelled directly on bars (from bottom to top):
Income tax (light blue)
National insurance (orange)
VAT/sales tax/IPT (grey)
Excise duties/APT (gold/yellow)
Corporation tax (mid blue)

Line label at top right:
All tax receipts (red line)

Y-axis: 0%, 5%, 10%, 15%, 20%, 25%, 30%, 35%, 40%

X-axis: 1965 through 2025 (annual intervals from 1965 to 2025)

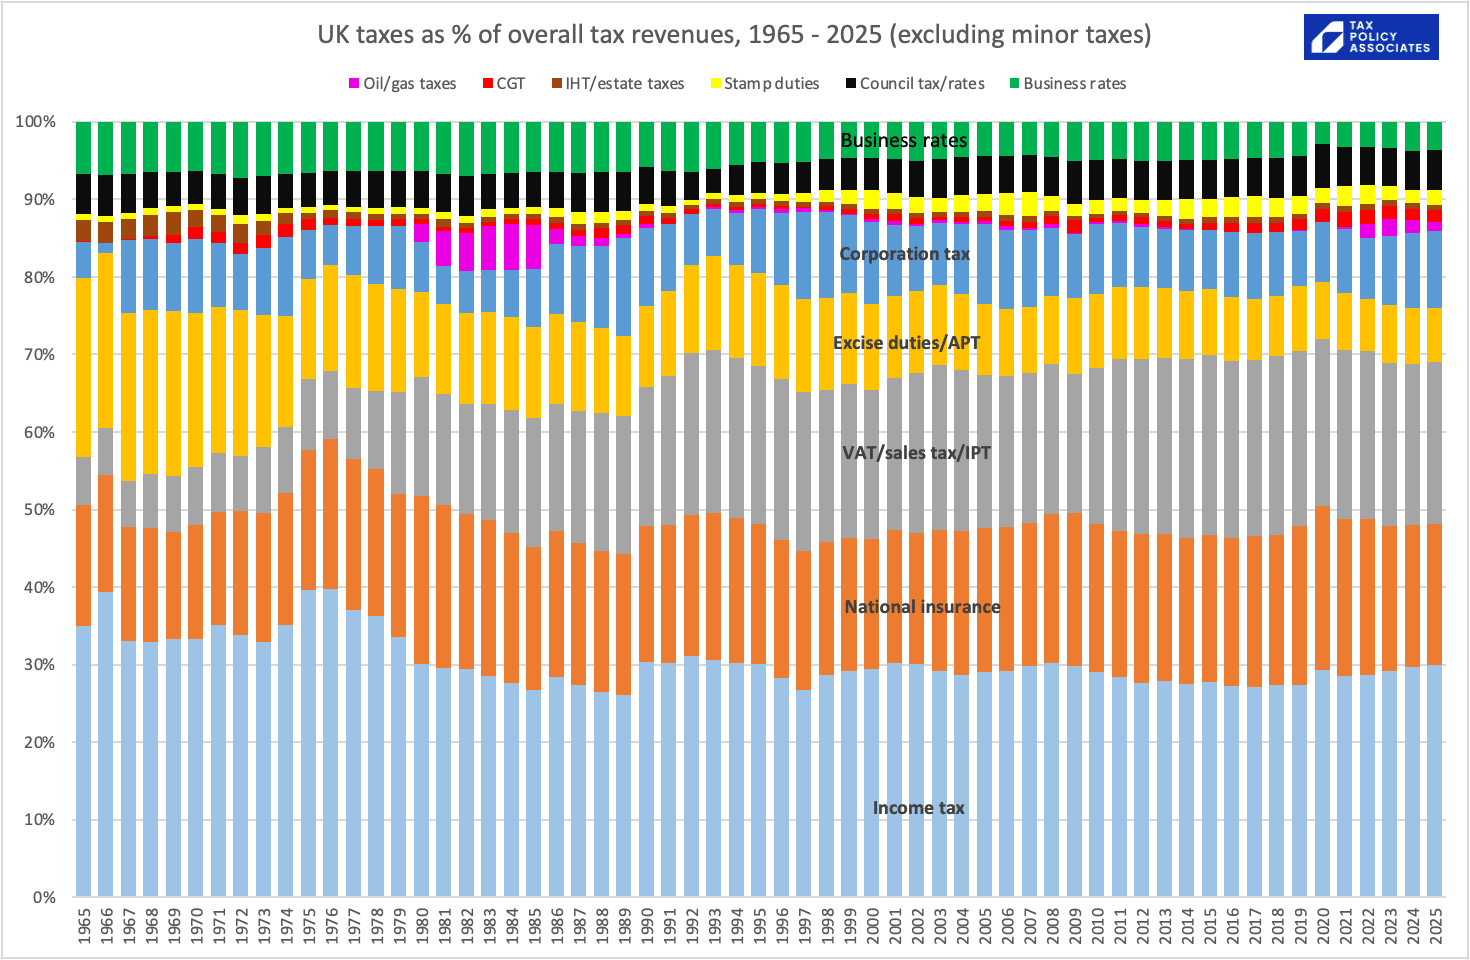
The same data, but normalised so it shows the share of overall taxation:

Stacked bar chart of UK taxes as a percentage of overall tax revenues from 1965 to 2025: Three taxes—Income tax, National insurance, and VAT/sales taxes—consistently make up around two-thirds to three-quarters of UK tax revenues throughout the entire period. Excise duties have declined steadily from around 23% in the late 1960s to below 10% in the 2020s, while VAT/sales taxes expanded markedly from 1973. Other revenues including Corporation tax, Business rates, Council tax/rates, Oil/gas taxes, Capital Gains Tax, Inheritance tax, and Stamp duties account for the remaining share.

UK taxes as % of overall tax revenues, 1965 - 2025 (excluding minor taxes)
TAX POLICY ASSOCIATES

Legend / Series (from bottom to top):
- Income tax
- National insurance
- VAT/sales tax/IPT
- Excise duties/APT
- Corporation tax
- Oil/gas taxes
- CGT
- IHT/estate taxes
- Stamp duties
- Council tax/rates
- Business rates

Y-axis: 0%, 10%, 20%, 30%, 40%, 50%, 60%, 70%, 80%, 90%, 100%
X-axis: 1965 to 2025 (in single-year increments)

Obvious conclusions:

  • The conventional wisdom that tax has moved from taxing income (income tax/NI) to taxing consumption (VAT) is correct – but only to a degree. The decline in income tax/NI is small, and the increase in VAT has been almost matched by a decrease in other indirect taxes/duties
  • The conventional wisdom that corporation tax has been slashed (the “race to the bottom“) is wrong
  • The complaint that business rates are at historically high levels is wrong
  • The idea that the EU forced VAT on us, and changed our tax system forever, is also wrong. VAT replaced the various sales taxes, and caused a massive drop in excise duties. The combined total of VAT/sales taxes/duties hasn’t materially changed since the 60s.
  • Council tax/poll tax/rates revenues look much the same, despite the very significant changes over this period

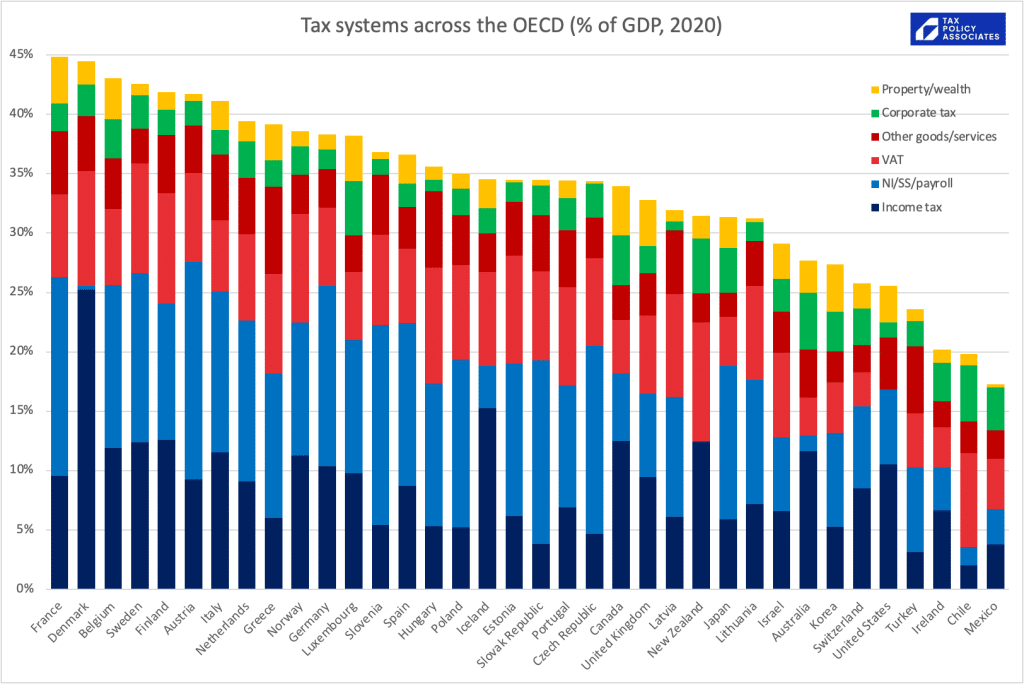
How does it compare with the rest of the OECD?

That looks like this:

Stacked bar chart of tax systems across OECD countries as a percentage of GDP in 2020: Total tax revenue across the OECD in 2020 ranged from around 45% of GDP in France and Denmark to under 20% in Chile and Mexico, with the United Kingdom positioned in the lower-middle tier at approximately 33% of GDP. Across almost all countries, tax revenues are dominated by personal income tax, social security and payroll taxes, and VAT, while corporate tax and property/wealth taxes make up comparatively small proportions.

Tax systems across the OECD (% of GDP, 2020) [Tax Policy Associates logo]

Legend:
- Property/wealth (yellow)
- Corporate tax (green)
- Other goods/services (dark red)
- VAT (bright red)
- NI/SS/payroll (mid blue)
- Income tax (dark blue)

Y-axis: 0% to 45% (in 5% increments)

Approximate total tax revenues by country (percentage of GDP):
- France: ~44.8%
- Denmark: ~44.5%
- Belgium: ~43.0%
- Sweden: ~42.5%
- Finland: ~41.8%
- Austria: ~41.6%
- Italy: ~41.1%
- Netherlands: ~39.4%
- Greece: ~39.1%
- Norway: ~38.6%
- Germany: ~38.3%
- Luxembourg: ~38.2%
- Slovenia: ~36.8%
- Spain: ~36.6%
- Hungary: ~35.6%
- Poland: ~35.0%
- Iceland: ~34.6%
- Estonia: ~34.5%
- Slovak Republic: ~34.5%
- Portugal: ~34.4%
- Czech Republic: ~34.4%
- Canada: ~33.9%
- United Kingdom: ~32.8%
- Latvia: ~31.9%
- New Zealand: ~31.4%
- Japan: ~31.3%
- Lithuania: ~31.2%
- Israel: ~29.1%
- Australia: ~27.7%
- Korea: ~27.3%
- Switzerland: ~25.7%
- United States: ~25.5%
- Turkey: ~23.5%
- Ireland: ~20.2%
- Chile: ~19.8%
- Mexico: ~17.4%

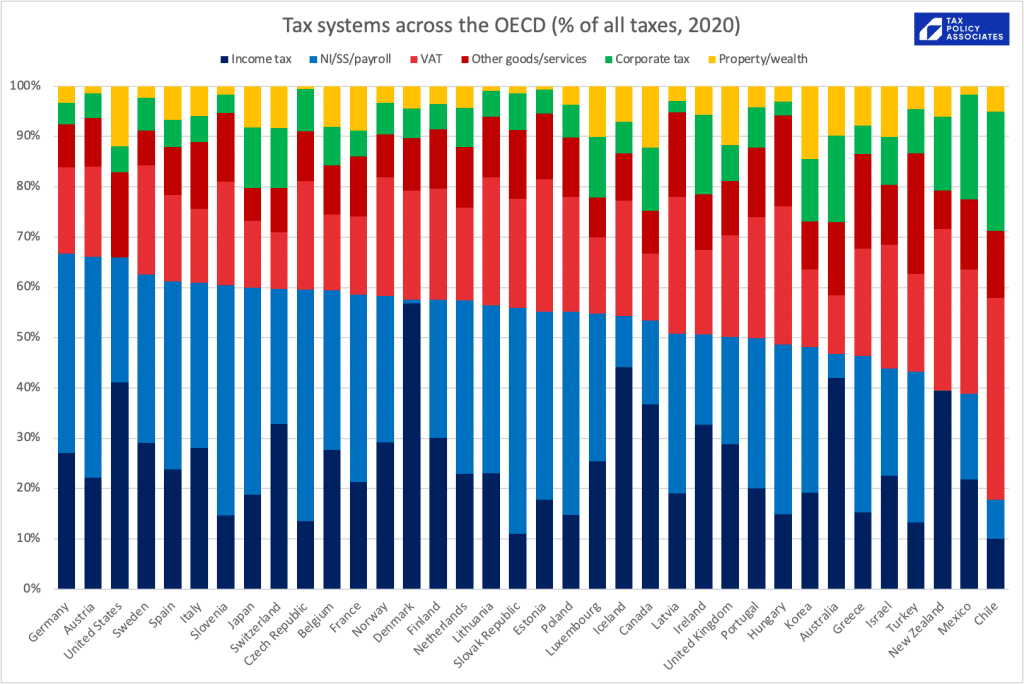
Comparisons are easier if we normalise, and order by the total % of tax collected in income tax and social security/national insurance:

Stacked bar chart comparing tax revenue composition across OECD countries as a percentage of total taxes in 2020: Across the OECD, income tax, social security/payroll taxes, and VAT account for the overwhelming majority of total tax revenues, though the specific mix varies widely. The UK sits in the middle with a balanced distribution: roughly 28% income tax, 22% National Insurance/payroll, 20% VAT, 10% other goods and services, 7% corporate tax, and 12% property/wealth taxes.

Tax systems across the OECD (% of all taxes, 2020)
Tax Policy Associates

Legend:
- Income tax (dark blue)
- NI/SS/payroll (mid blue)
- VAT (coral red)
- Other goods/services (dark red)
- Corporate tax (green)
- Property/wealth (yellow)

Y-axis: 0% to 100% in increments of 10%

X-axis (countries from left to right, sorted roughly by combined share of income tax plus NI/SS/payroll):
Germany
Austria
United States
Sweden
Spain
Italy
Slovenia
Japan
Switzerland
Czech Republic
Belgium
France
Norway
Denmark
Finland
Netherlands
Lithuania
Slovak Republic
Estonia
Poland
Luxembourg
Iceland
Canada
Latvia
Ireland
United Kingdom
Portugal
Hungary
Korea
Australia
Greece
Israel
Turkey
New Zealand
Mexico
Chile

We need to be cautious about these comparisons. There are services which are paid for out of general taxation in some countries, but paid for directly by individuals in others. The obvious large example is healthcare in the US – about 55% of which is paid for by businesses and individuals rather than the Government. A smaller but still significant example is local services: some (e.g. rubbish collection) are paid from council tax in the UK, but by direct fees in some Continental countries.

With that large caveat, what can we conclude from these charts?

  • The tax system most similar to the UK is Portugal, which I find surprising – although Portugual collects somewhat more in VAT and other indirect taxes, and the UK collects somewhat more in capital/land taxes
  • Amongst the countries similar to the UK – large developed economies with relatively generous welfare states, the UK has the smallest overall tax as a % of GDP, the smallest overall tax % collected from individuals/wages, and the largest from capital/land taxes.

We shouldn’t exaggerate these differences. There are obvious large variations in total tax as a % of GDP between countries, but it’s remarkable how – aside from a couple of outliers – the differences in tax composition between countries is relatively small.

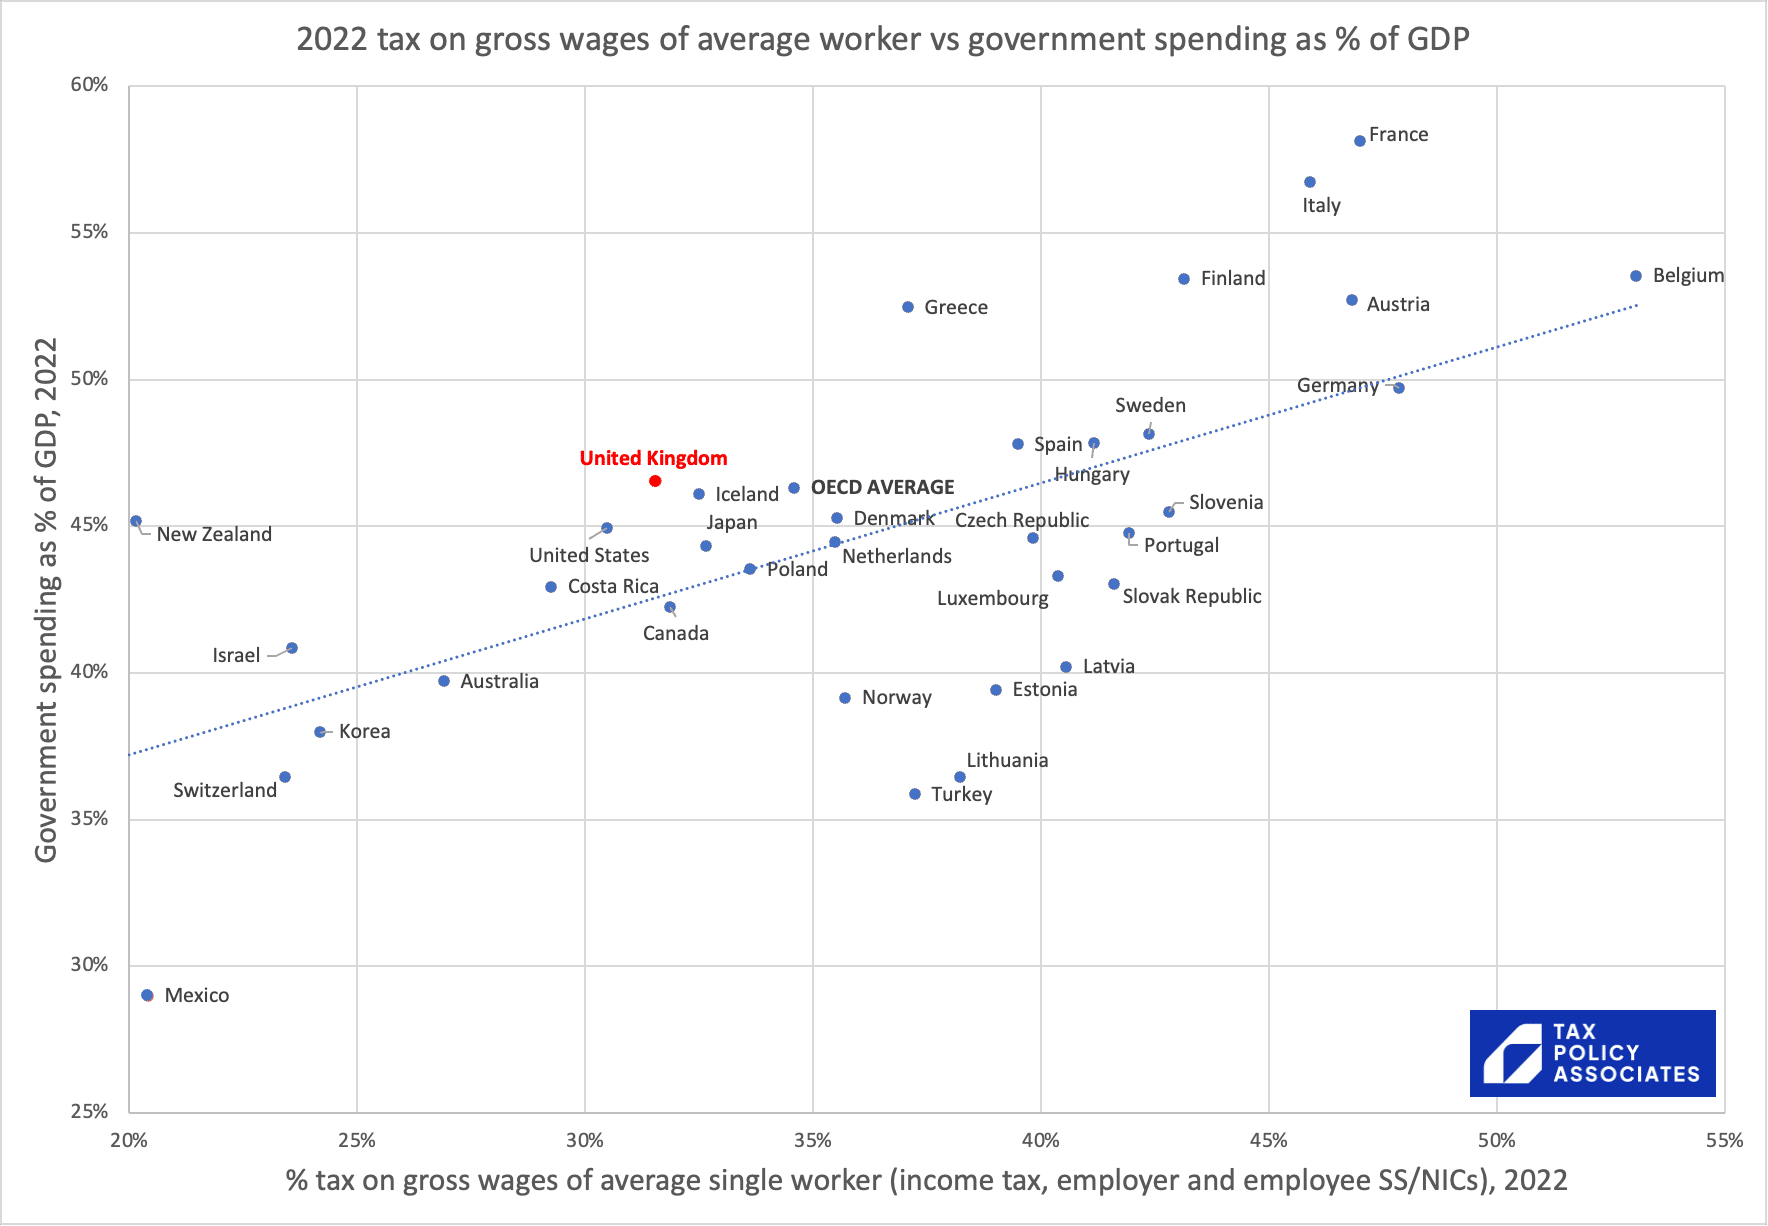
Another way to look at this is to plot the % of tax on the wages of the average worker (i.e. income tax, and employee/employer’s national insurance only) against the level of state spending in each OECD country:

Scatter plot of 2022 tax on gross wages of average single worker against government spending as a percentage of GDP across OECD countries: There is a positive correlation between taxes on average wages and government spending as a share of GDP. The UK sits slightly above the trend line, with government spending at approximately 46.5% of GDP and tax on gross wages of an average worker at approximately 31.5%, below the OECD average of roughly 34.6% tax and 46.2% spending.

Title: 2022 tax on gross wages of average worker vs government spending as % of GDP
Y-axis: Government spending as % of GDP, 2022 (25% to 60%)
X-axis: % tax on gross wages of average single worker (income tax, employer and employee SS/NICs), 2022 (20% to 55%)
Logo: TAX POLICY ASSOCIATES

Data points (tax rate, spending as % of GDP):
- Mexico: ~20.5%, ~29.0%
- New Zealand: ~20.2%, ~45.2%
- Israel: ~23.6%, ~40.8%
- Switzerland: ~23.4%, ~36.5%
- Korea: ~24.2%, ~38.0%
- Australia: ~26.9%, ~39.8%
- Costa Rica: ~29.2%, ~42.9%
- United States: ~30.5%, ~44.9%
- United Kingdom: ~31.5%, ~46.5%
- Canada: ~31.9%, ~42.2%
- Iceland: ~32.5%, ~46.0%
- Japan: ~32.6%, ~44.3%
- Poland: ~33.6%, ~43.5%
- OECD AVERAGE: ~34.6%, ~46.2%
- Denmark: ~35.5%, ~45.3%
- Netherlands: ~35.5%, ~44.4%
- Norway: ~35.7%, ~39.2%
- Greece: ~37.1%, ~52.5%
- Turkey: ~37.2%, ~35.9%
- Lithuania: ~38.2%, ~36.5%
- Estonia: ~39.0%, ~39.4%
- Spain: ~39.5%, ~47.8%
- Czech Republic: ~39.8%, ~44.6%
- Luxembourg: ~40.4%, ~43.3%
- Hungary: ~41.1%, ~47.8%
- Latvia: ~41.5%, ~40.2%
- Slovak Republic: ~41.6%, ~43.0%
- Portugal: ~41.9%, ~44.7%
- Sweden: ~42.4%, ~48.2%
- Slovenia: ~42.8%, ~45.5%
- Finland: ~43.1%, ~53.4%
- Italy: ~45.9%, ~56.7%
- Austria: ~46.8%, ~52.7%
- France: ~47.0%, ~58.1%
- Germany: ~47.8%, ~49.7%
- Belgium: ~53.0%, ~53.5%

It’s notable that there’s no country in the world which taxes the average worker less than the UK, but has higher government spending.

We should therefore be sceptical of anyone who claims that we can radically change the balance of taxation and [eliminate corporate tax][tax corporates more and people less][tax land more and everything else less]. International experience suggests our options are limited to fiddling at the margins here and there or, more courageously, choosing to significantly increase or decrease the size of the state, and therefore decrease or increase most people’s taxes, and the public services they fund.


Footnotes

  1. Sources are here for most of the taxes, here for local government taxes and here for vehicle excise duty (the latter being a forecast, not an outturn) ↩︎

  2. Thanks to the IFS who did all the work here – I just bundled similar taxes together and plotted it ↩︎

  3. Ignoring minor taxes; there are dozens, and they make the chart unreadable. ↩︎

  4. Again ignoring minor taxes. ↩︎

  5. Thanks to the OECD for the wonderful global revenue statistics database. I just categorised similar taxes together – but had to push the taxes into a smaller number of categories than for the UK-only charts above, or cross-country comparisons became impossible. ↩︎

  6. I’m bundling employer and employee SS/NI together, because all the evidence is that, in the long term, employees bear the economic burden of employer labour taxes, i.e. because a business will generally keep its overall labour costs constant as taxes increase, so take-home wages fall (Again, in the long term) ↩︎

  7. Chile! ↩︎

  8. This is now updated using the latest OECD data for 2022. I’ve removed Ireland because of the well-known problems with Irish GDP data, and excluded Chile because it is so great an outlier that it makes the chart hard to read. ↩︎

  9. Don’t knock it! -almost everything I write is about fiddling at the margins ↩︎
2 responses to “The UK tax system in five infographics, and what we can learn from the fact they are boring”

  1. George Rosenberg avatar
    George Rosenberg

    One of the constant themes of economic policy in the UK is that by cutting taxes you can increase productivity – the notion is simplistically that if people have to pay less tax of what they earn, they will work harder.

    You’ve made the excellent point in the past that the way the UK VAT system works discourages productivity.

    But looking more widely, could you do a similar make of overall taxation against productivity?

  2. Richard Sage avatar

    ‘The conventional wisdom that corporation tax has been slashed (the “race to the bottom“) is wrong’
    Remember Sherlock Holmes – the Dog that did not Bark.
    Proportion of GDP taken by Corporation Tax has not changed.
    But returns to capital have increased relative to returns to labour, so OTBE, one would expect the proportion taken by CIT to have gone up.
    Therefore the effective UK rate on effective profit has gone down.
    (effective profit, because HMRC and CH profits only show those booked in the UK, and much more is now booked outside the UK.

Leave a Reply

Your email address will not be published. Required fields are marked *