
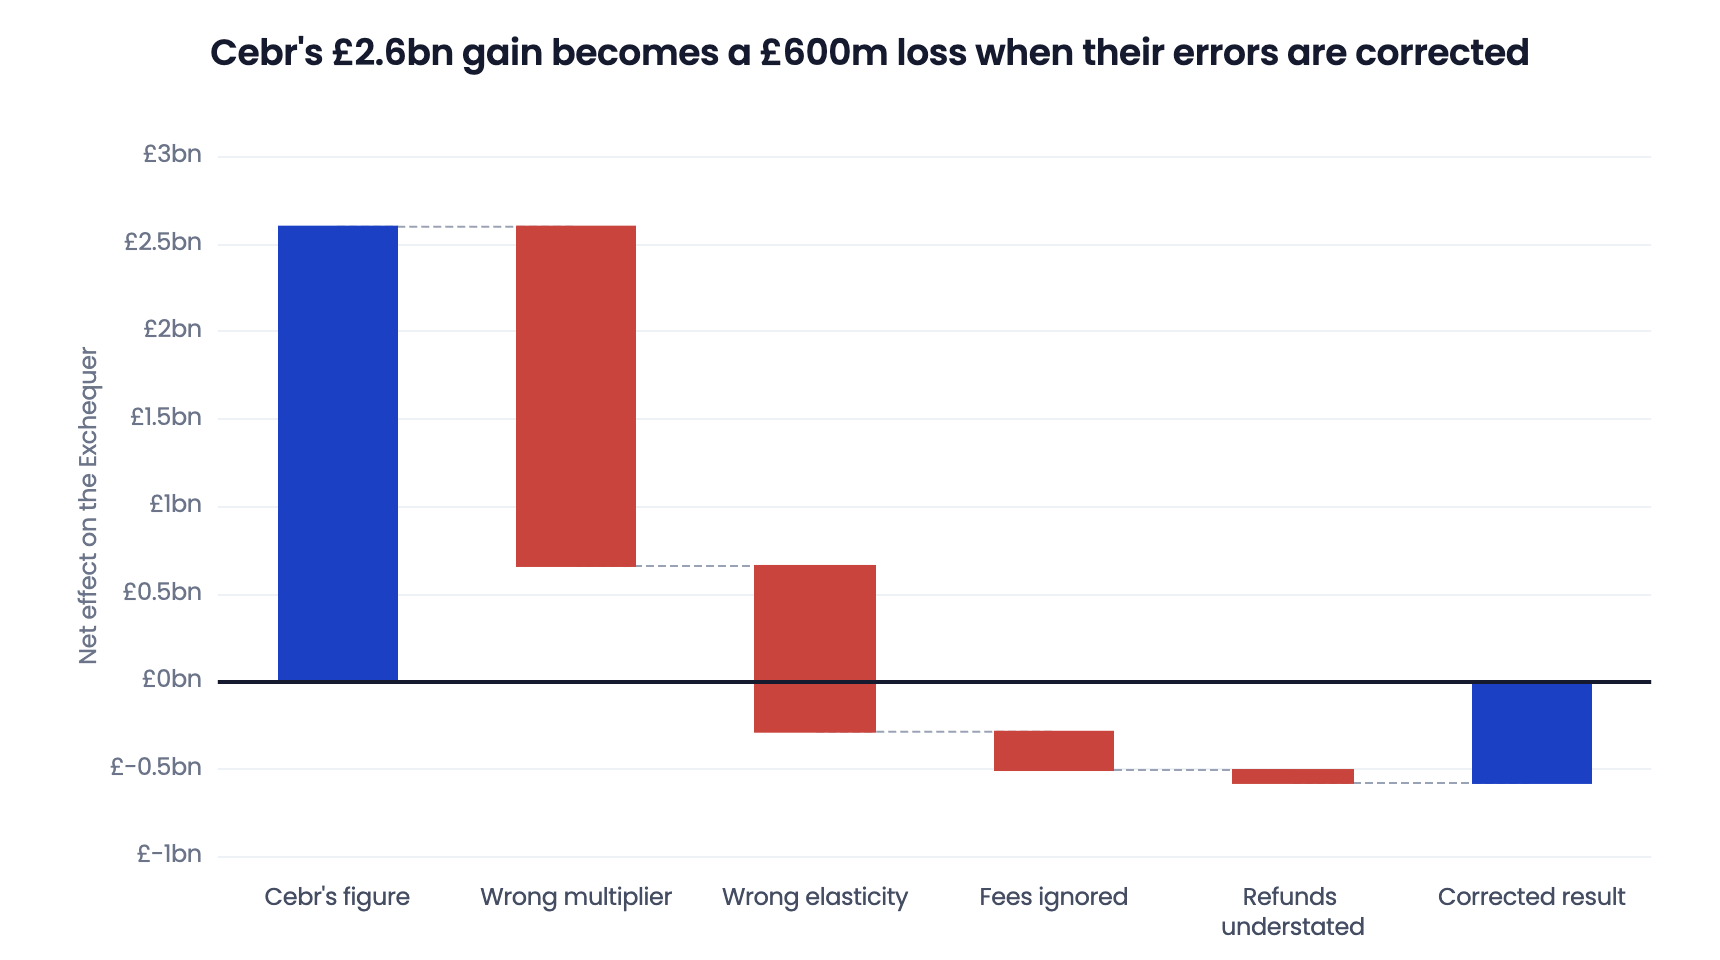
The retail lobby wants tourists to be able to claim a VAT refund for their UK shopping. So they commissioned Cebr to produce a report claiming it would deliver a multi-billion pound boost to the Exchequer. It convinced Sadiq Khan and Kemi Badenoch. But we rebuilt their model and found four fatal errors – once fixed, their model shows a huge loss.
Tourists used to be able to claim a refund for VAT when they shopped in the UK – it was required by EU law.1 The UK stopped it after Brexit, but retailers want VAT-free shopping to return. Earlier this month the economic consultancy Cebr (the Centre for Economics and Business Research) published a report for the Heart of London Business Alliance concluding that this would add £11.5bn to the UK economy, support 153,000 jobs and hand the Exchequer a net £2.6bn: a tax cut that pays for itself. This has convinced Sadiq Khan, the Mayor of London, who cited Cebr’s claim of a “multi-billion boost to the economy” and said he too wants VAT-free shopping reinstated. It also convinced the Conservative Party.
But the report is badly wrong. Our team has identified four serious errors:
First, Cebr apply an economic multiplier twice the size of anything in official statistics:
Their report initially justified this by reference to a Deloitte paper, which it misquoted. When we pointed this out, Cebr said this reference was a mistake, and the multiplier instead was derived from a World Travel & Tourism Council report. But Cebr refused to share their calculation.
Second, Cebr combine two figures for how tourists respond to tax cuts (“elasticity”), resulting in a number which is completely out of scale with all the other estimates we could source:
Cebr’s report spends time carefully constructing elasticities and then junking them in favour of a figure that’s twice as high. They did not explain why.
Third, Cebr’s calculations ignore the fact that tourists claiming VAT refunds usually pay a sizeable fee to an intermediary:
Cebr admits this was missed from their original paper, but refuses to change their headline numbers.
Fourth, when Cebr count the cost of the scheme, they leave out the VAT refunded on the very sales the scheme is meant to create. Again, Cebr admits their report was incorrect, but won’t change their numbers.
Fixing these four errors turns the £2.6bn gain into a £600m loss to the Exchequer.2
On that basis, there’s still £2.5bn of modelled economic output and 36,000 jobs supported. Adding our central assumptions reduces those figures to £400m of output and 6,000 jobs supported, with a £640m cost to the Exchequer. 3
We put all four errors to Cebr and the Heart of London Business Alliance before publishing this, and invited them to respond. Cebr changed its explanations of the multiplier and elasticity, acknowledged that refund fees reduce visitors’ savings, and corrected its description of the refund cost. It continues to defend its calculations and has left the headline figures unchanged.
Heart of London Business Alliance did not respond.
To understand how extraordinary Cebr’s assumptions and model are, let’s imagine a different proposal: give every tourist a £100 shopping voucher. If we apply Cebr’s assumptions and calculations, this generates approximately £13bn in additional tax receipts, against £4.3bn in voucher costs. The Government would make an £8.9bn profit by giving tourists money.
Cebr are saying there’s a free lunch. That should make anyone question Cebr’s assumptions. If Cebr reject our proposed money-making voucher-machine, they need to explain why.4
An important point: this report replicates and critiques Cebr’s model. It is not an independent costing of VAT-free shopping, and we have not built a Treasury-style model of the policy. Our report has two conclusions. First, Cebr’s published £2.6bn gain does not follow from a corrected version of their own model. Second, if we replace their “upper-bound” inputs with assumptions we consider more realistic, the modelled results look even worse. However, both figures are scenarios inside Cebr’s framework, not estimates of the true fiscal effect. They should not be quoted as an independent cost of VAT-free shopping.
Our duplication of Cebr’s model
We’ve built an open model of Cebr’s calculation so you can check all of this for yourself. It starts with Cebr’s own approach and reproduces their headline figures, with the remaining discrepancies explained below. You can then correct the four errors, change the other assumptions and calculations individually, or use our presets. All the code is on our GitHub.
The four errors
We started reviewing the Cebr report because it seemed “too good to be true”. The central claim is hard to believe, and their own press release presents a single figure as if the answer were certain. Serious economic analysis discloses uncertainty, presents a range, shows how the result changes under different plausible assumptions. Instead, Cebr claim a degree of precision that this kind of economic forecasting simply can’t have.
We expected we’d find that their assumptions were overoptimistic. We certainly found that, but also something more basic: four serious errors in their methodology.
Here’s a summary of the four errors – our model lets you switch them each on and off individually, and see how they change the result.
1. The 2.8 multiplier can’t be right
On page 20 of the original report, Cebr concluded that the scheme would increase GVA (the output of producers minus intermediate consumption costs) by £11.5bn. Here’s the reasoning:
Consistent with VisitBritain’s estimates of the UK tourism economy, we apply a GVA multiplier of 2.8, suggesting that every £1 of tourism spending ultimately supports £2.80 of GVA across the wider economy.
The original report cited the Deloitte and Oxford Economics study for VisitBritain. That was a strange citation, because the 2.8 in that study is a value-added multiplier: £2.80 of value added for every £1 of value added created directly by tourism, not for every £1 spent.5
When we pointed this out, Cebr said the citation was a mistake and that the 2.8 is its own calculation from World Travel & Tourism Council data. It says it divides tourism’s contribution attributable to international visitors by their spending, averaging the annual ratios for 2013 to 2019. Its later explanation adds a subtraction for domestic tourism. Cebr hasn’t supplied the annual figures or the workings for that subtraction, so we haven’t been able to reproduce its calculation (see our correspondence with Cebr below).
But, whatever the source, the number can’t be right. As the chart above shows, £1 of final demand generates at most £1 of GVA in the ONS tables, and that’s an accounting identity rather than an observation – absent subsidies, it literally can’t be any higher. Scotland’s tables add the induced round, which tops out at a total of £1.32 – but the more tourist-relevant sectors are between 50p and 95p.6
For our alternative calculation, we use an historical benchmark of £1.44 of GVA per £1 of visitor spending, drawn from the Deloitte and Oxford Economics study for VisitBritain. That’s generous to Cebr, because it’s higher than any official figure we could find. And its totals include government spending and investment as well as visitor purchases.7
Using that benchmark roughly halves Cebr’s £11.5bn estimate. It doesn’t establish how Cebr went wrong: that would require the calculation it hasn’t supplied.
There is also a simple sense-check. Applying Cebr’s 2.8 ratio to all the tourist spending in the VisitBritain study would imply tourism contributed 22.5% of UK GDP, against the study’s own (high) estimate of 11.4%.8 Cebr says international visitors justify a higher ratio, but hasn’t supplied a calculation that substantiates the difference.9
Cebr’s choice of 2.8 made a massive difference. Using our illustrative benchmark instead reduces the estimated net benefit to the Exchequer by about £1.9bn. And any figure below 2.4 will (with the other errors corrected) result in a net fiscal loss.
2. The extra spending is counted twice
Two separate things happen when shopping gets cheaper: more tourists come, and each tourist spends more. You can analyse these effects together, or you can analyse each separately. Cebr looks at them separately.
Cebr first applies an arrivals elasticity of −1.3, meaning that a 1% fall in the cost of a visit brings 1.3% more visitors. But the British Tourist Authority study behind that number estimates the response of real tourism receipts to exchange rates, not visitor numbers. It does not establish the arrivals response Cebr assumes.10 So Cebr is using the correct approach here but a figure that may not be correct. That’s a leap, but not a serious error.
The problem comes with the next step: how much more each tourist spends. Cebr uses an elasticity of −1.6, which its original report inferred from a simulation in Gago and others (2006), a study of tourism taxes in Spain. But the simulated response in Gago is for total tourist spending, so it already includes the spending of extra tourists. Using that aggregate response as a spending-per-visitor response, on top of a separate arrivals response, counts the arrivals component twice.11 Cebr now says −1.6 is a calibrated assumption, with Gago providing an indicative anchor. The question is whether it has substantiated that calibration.
This all results in a model in which a 1% price cut raises total tourist spending by about 3%. That’s more than four times the UK figure Cebr’s own report quotes on its page 1412, and more than four times its own regression result of −0.7 on page 15.13
Using −1.6 once, as a response of total spending, instead of combining it with a separate arrivals response reduces the estimated net benefit to the Exchequer by about £1.8bn, with the rest of our reconstruction unchanged.
Cebr gave three responses to this, none addressing the point. They said −1.6 is a calibrated spending-per-visitor assumption “informed” by Gago and the OBR. They said that scheme users are likely to be more price-sensitive than average visitors. And they noted that arrivals and spending per visitor are distinct responses. At no point did they explain how its cited evidence establishes −1.6 for spending per visitor, or how it justifies an aggregate response more than four times its own spending regression.
3. Refund fees are not accounted for
When the refund scheme actually operated, someone had to claim the refunds. Sometimes this was the retailer itself, particularly for large retailers such as department stores. Sometimes it was a third party. They charged a fee for this, and it was a nice little business. Various estimates of the average fee that was charged: 20%, which the OBR used in its 2024 review, 36%, which a Treasury minister gave in a Commons debate in September 2023, and 39%, from an HMRC survey of people who’d tried to claim.14
The report ignores this and assumes that refunds are costless. That’s a problem, because the elasticities should be applied to the price cut the tourist actually receives rather than to the part that disappears in fees. At a 20% fee a 4.2% saving becomes about 3.3%, and a smaller price cut produces a smaller response.
Using the OBR’s 20%, the lowest of the three, this alone reduces the net benefit to the Exchequer by about £0.8bn.
Cebr’s first reply called this “a scenario assumption”. Its revised report then added a sentence conceding that refund operators “typically deduct a commission in practice, which lowers the realised saving and the associated demand response”. But they didn’t change their calculations or their headline numbers. That seems indefensible.
4. The cost of the refund scheme omits the cost of refunds on the new sales
The scheme costs money because, obviously, VAT gets refunded. Cebr puts that cost at £1.4bn, sets it against £4.0bn of extra tax, and reaches their £2.6bn net gain figure.
The original report said the £1.4bn covered refunds on everything: purchases visitors would have made anyway, purchases by the additional visitors the scheme attracts, and the extra spending of both groups. But on Cebr’s own assumptions that total is £1.56bn.1516
This understates the cost to the Exchequer by about £170m, which makes it much the smallest of the four errors.
Cebr’s revised report concedes that the £1.4bn was wrongly described, and its second reply confirms that the £1.54 figure was reached after deducting £1.56bn of refunds, leaving a net £2.39bn. But their headline number remains £2.6bn. It is, again, not clear how that can be justified.
Questionable assumptions
Cebr was entitled to make judgment calls, but some of the assumptions in their report are hard to understand.
This is less significant than the four errors we identify above – modifying the assumptions doesn’t change the net cost to the Exchequer very much, but it does dramatically change the economic benefit. Our model lets you adjust each assumption as you wish.
All of the extra activity is treated as new to the UK
Cebr counts every pound of its new GVA as activity that wouldn’t otherwise have happened anywhere in Britain. This is only true if the workers, premises and capital were sitting idle, in the right places, at the right times of year.17
As the Treasury Green Book states, policy analysis needs to distinguish genuine change in economic activity from activity merely moved from one place to another. Officials are told to assume, absent compelling evidence, that new jobs displace jobs elsewhere rather than adding to national employment. That’s what the OBR did when it reviewed the costing of abolishing the old scheme, and concluded that the measure “is more likely to have reallocated employment and activity between the UK’s sectors and regions”.18
Cebr does not explain why it allows no displacement. The closest it came was in its second reply to us, where Cebr argued that inbound spending is “an injection of external demand”, whereas domestic tourism is “to an extent a reallocation”. That is a displacement argument. It’s being used to justify a bigger multiplier, while displacement is applied nowhere in the model. And it’s just vibes; Cebr seem to have made no attempt to quantify the effect.
The Bank of England’s July 2026 report identifies spare capacity in the economy and labour market, which gives some scope for extra demand to raise output, but of course does not provide quantitative data that would establish a percentage for this analysis.
Working out exactly how much of the GVA would be genuinely new is a difficult question requiring sophisticated modelling that’s outside the scope of this exercise. The four economists we spoke to thought it was appropriate to use 50% as an illustrative starting point; all four expected the actual figure to be lower than this. It’s also the “medium” level of displacement in the official Additionality Guide, and close to the average in a database of UK programme evaluations created for the Department for Business, Innovation and Skills.19 Other published assessments apply adjustments of a similar scale, although none is directly on point for this policy. Oxford Economics’ work for the government applies much larger deductions to supply-chain and resident-spending effects. These examples support testing substantial displacement, but don’t establish the right percentage for a UK shopping refund.20
Cebr derives its own elasticities – and then uses other, higher, ones instead
Chapter 1 of the Cebr report contains a serious piece of work. Cebr runs its own regressions of EU visitor numbers and EU visitor spending against the real sterling-euro exchange rate over 2002 to 2019, publishes the results, and says they are “broadly consistent with the wider academic literature”. It uses this to derive elasticities −0.9 for visitor numbers and −0.7 for spending. It says, correctly, these are consistent with the one UK study it cites, Blake and Cortés-Jiménez, at −0.6.
But these figures are not used in its calculation. Instead, they take −1.3, from a British Tourist Authority exchange-rate model, for arrivals, and −1.6, derived from a simulation of Spanish tourism taxes, for spending. Those figures are substantially larger than its own estimates. The report doesn’t explain why it prefers them, and nor did either of Cebr’s replies to us.21
If we use Cebr’s own two elasticities, and change nothing else, then the £11.5bn of GVA falls to £6.3bn and the £2.6bn Exchequer gain falls to £0.8bn. That, however, would still be incorrect, because it retains the double-counting problem we mentioned above (i.e. the −0.7 also measures total spending, so it should not be compounded with the arrivals response).22
There are a variety of elasticities in the literature23, but the mystery remains: why did Cebr disregard their own analysis?
Everyone claims
Cebr’s headline numbers assume that every eligible purchase results in a claim. That is, pretty obviously, not correct. Cebr calls that an upper bound, which is fair enough, but we don’t believe it’s then reasonable to only publish the result from that unevidenced upper bound.
Cebr mentions a 50% claim rate without giving the resulting figures. We can use the old scheme as a cross-check, but we can’t assume its figures can be directly read-across to a new scheme (given a new scheme would apply to EU as well as non-EU visitors). In 2019 the Exchequer refunded £525m of VAT on purchases by non-EU visitors, against £17.8bn of visitor spending. Gross refunds were therefore 2.95% of that spending, before fees.24 Our central case assumes 80% eligibility and 70% take-up. Applying the historical refund ratio to 2025 requires further assumptions about EU visitors’ shopping and claiming behaviour; our illustrative alternatives give £704m to £980m of baseline refunds. At 80% eligibility, that corresponds to 64% to 89% take-up.
The model also lets you set how much of the saving a visitor anticipates when deciding to travel. Cebr effectively sets this to 100%, which can’t be correct (and a refund that someone does not anticipate cannot affect their decision to travel). However, as we have no UK estimate of the actual anticipation figure, we retain 100% as a reference assumption.2526
Everything qualifies
Cebr treats every pound of shopping as capable of producing a VAT refund. This is plainly incorrect for zero-rated goods and goods consumed here. Under the retail export scheme rules, goods carrying either standard-rate or reduced-rate VAT can qualify if the other conditions are met, including export in the traveller’s luggage. Services never qualify.27
Cebr calculate shopping using data from VisitBritain’s Foresight 112. They add up four product categories: clothes and fabric £2,340m, souvenirs, gifts and household goods £1,620m, food and groceries £540m, and books, papers and maps £180m.28
Printed books, newspapers and maps are generally zero-rated and generate no VAT refund. The food category also includes zero-rated goods and purchases eaten here. But these broad survey categories do not tell us the VAT status of each purchase or how much was taken home. We use 80% eligibility as an illustrative judgment about that mix.29
The OBR’s March 2024 review supplies a useful further check: £525m refunded in 2019, 5,755,000 forms and 1,154,000 travellers. It also shows spending on eligible goods as 21% of non-EU visitors’ total spending.
Retailers don’t push up prices
As we’ve written before, the full benefit of VAT cuts is rarely passed on to consumers – in the lingo, “pass-through” is less than 100%. Retailers can push up prices so that, after the price increase and the VAT cut, consumers end up in the same place as they started. We demonstrated this ourselves by looking at what happened when VAT on tampons was abolished, and VAT on e-books was abolished.
VAT-free shopping is a rather different case: it is a refund rather than a price cut at the checkout. And a further complicating factor: most of the items on which refunds could be claimed are bought by locals as well as tourists, so a retailer can’t raise prices without charging locals more. Take these factors together, and there is much less scope for a retailer to slyly put up the price and get some of the VAT benefit itself. There will, however, be cases where this is different. One can imagine, for example, a high-end jewellery shop where a significant proportion of its customers are foreign.
However, we are unable to find any research or evidence on tourist refunds pass-through effects, so we are for the moment assuming 100% pass-through.
Every £1 of output is assumed to yield tax at the national average rate
Cebr uses 34.4%, the OECD’s share of UK national income collected in tax, and applies it to its GVA figure. But an average across every activity and every tax isn’t the tax raised on this particular activity.
The point is of limited significance, so for the moment we are retaining 34.4% as an illustrative assumption.
The free lunch
Our model also lets you run a fourth scenario. Choose “Free lunch” and the VAT refund is replaced by a simpler idea – every visitor arriving in Britain is handed a cash voucher to spend on goods. A shopping voucher is not the same as a VAT refund, but the evidence suggests the consequences will be very similar.30
It starts at £100 but you can set it at various different levels, including £31.90 – the same cost as Cebr’s proposal.31
At £100, if we apply Cebr’s assumptions and calculations, this generates approximately £13bn in additional tax receipts, against £4.3bn in voucher costs. The Government would make an £8.9bn profit by giving tourists money. A £150 voucher would generate £20.7bn of additional tax.32
Cebr have created a money pump.33
We think most people, specialists and non-specialists, will agree that this is not a plausible result. It’s a free lunch.
Evidence from other research
We should be cautious about applying results from other countries to the UK, but it is, in any event, hard to do so because the published research is both limited and mixed.
We reviewed 43 additional sources for this piece. The most directly relevant:
- Tsai and colleagues studied a 2016 refund reform at Taipei 101 with daily data and a difference-in-differences design, and found roughly 37% more refund applications but “no statistically significant impacts on the overall international tourists’ expenditures”. Average spending per claim actually fell. The authors argue their design if anything overstates the effect, and conclude that an insignificant result therefore means the policy really was ineffective.34
- Zhang and Zheng, using a panel of 57 Chinese tourism cities from 2004 to 2019, report inbound visitor numbers 46.5% higher and tourism foreign-exchange income 83.3% higher in cities that adopted departure refunds. This is a large, even spectacular, positive result. We haven’t been able to obtain the full text so we can’t say any more, other than that, we wonder whether what was, in fact, happening is that the tourism cities were poaching shopping from neighbouring districts and cities that didn’t permit refunds.
- Chansarn found higher shopping expenditure after Thailand’s refund policy, on 32 quarterly observations. But Chansarn says he cannot tell whether tourists spent more because of the refund, or spent the same and simply switched to shops in the scheme in order to claim. He also reports that in 2004 Thailand had 11.65 million foreign tourists and 244,140 refund claims, which is a vanishingly small percentage (about 2%).35
- Nabilah found that Indonesia’s refund policy significantly raised the number of Singaporean visitors. That’s no surprise, given that you can take a ferry from Singapore to Batam and get there in just over an hour. But we wouldn’t give very much weight to the paper. It’s a 60-month regression of monthly arrivals on an exchange rate, a price index and a step dummy for the policy, with no control for trend or season (when we’d expect monthly tourist arrivals to be dominated by both).36
- Dimanche’s study of the Louisiana scheme found that users spent significantly more per day on shopping than non-users, and that 48% of those surveyed said the refund made them spend more than they had planned. The same paper criticises the programme’s published economic-impact estimates for attributing all international visitor spending to the scheme.
We have found no studies of the impact of abolition of VAT-free shopping on the UK. That may be because the periods that a study would focus on coincide with both Brexit and the COVID pandemic.
There is one relevant piece of evidence from the UK, but not from academic research. There was an attempt to judicially review the abolition of the old scheme (doomed as most such challenges are). The Treasury official responsible provided a witness statement explaining why the government had never produced the kind of number Cebr now offers. Any estimate of the wider effects, he said, “would be heavily dependent on key behavioural assumptions which were uncertain (e.g. on how it would affect purchasing decisions and someone’s decision to visit the UK in the first place)”, and making those judgments, together with the difficulty of getting granular sales data from retailers, “was a key issue with conducting this kind of ‘precise’ estimate”. We are hosting a copy of the witness statement here. This is, of course, evidence from one-party litigation and so cannot be regarded uncritically. It is, however, good evidence of the then position of the British government.
We list all the research we reviewed in the references section below.
Cebr’s response
We sent our four points to Cebr and the Heart of London Business Alliance on the morning of Monday 14 September. Cebr revised the report the next day, adding an update note on the cover.37
Two days after our letter, Cebr’s chief executive replied, and again two days after that when we said the first reply didn’t resolve anything. The full exchange is in the PDF below. In summary:
The multiplier. The report cited Deloitte for the 2.8. The first email said Deloitte “should not have been cited” and that the figure was Cebr’s own, “the external contribution of tourism to GDP” divided by international visitor spending derived from a report by the World Travel & Tourism Council (WTTC), which two sentences later had become “a ratio of output to spending”; the revised report then said “output”. The second email referred to “output” again and added a step that appears in neither version of the report, building the numerator “by stripping out the elements attributable to domestic tourism”. We don’t understand this. WTTC’s tables split tourism spending by where visitors come from, not GDP. Whatever was subtracted isn’t in the published data, and Cebr wasn’t willing to show us the calculation.
We repeatedly asked how Cebr reconciled its own Scottish estimate, £1,346m of GVA from £485m of spending (implying a 2.78 multiplier), with the highest official Scottish Type II GVA effect of £1.32 per £1. Cebr’s chief executive did not answer.
The elasticity. Cebr says −1.6 is a calibrated spending-per-visitor assumption informed by Gago and the OBR, citing the greater price sensitivity of scheme users. Its revised report calls Gago an indicative anchor rather than a direct estimate. The second email stresses that arrivals and spending per visitor are distinct responses. None of this supplies the quantitative link between the evidence and its chosen coefficient, or reconciles the resulting aggregate spending response with its own much smaller regression estimate.38
We repeatedly asked why the report discarded its own elasticities in favour of a different, higher figure. Again there was no response.
Refund fees. The first email called this “a scenario assumption” consistent with an upper bound. The revised report then added a sentence conceding that refund operators “typically deduct a commission in practice, which lowers the realised saving and the associated demand response”. We responded that this isn’t an “upper bound” – it’s simply wrong. The calculations in the report never changed.
The cost of the refunds. The cover note concedes that the £1.4bn was wrongly described, and the second email confirms that the report’s claim of £1.54 of tax for every £1 refunded was reached after deducting £1.56bn of refunds, which leaves a net £2.39bn. Again, the calculations in the report never changed.
The full correspondence is here:
Cebr has done this before
Cebr’s own website cites a client saying how “brilliant” their report was for PR and lobbying.

The website doesn’t mention the times that third parties have reviewed Cebr client reports, and found them badly lacking.
Alcohol pricing. In 2009, brewer SABMiller commissioned Cebr to challenge research supporting higher alcohol prices. Cebr reviewed a model prepared by Sheffield University’s, and said that it overstated how much harmful drinkers would respond to price increases. The House of Commons Health Committee asked its independent adviser, Professor Christine Godfrey, to check this. She concluded that Cebr had fundamentally misunderstood the model, and that “These arguments invalidate all of their empirical estimates in the report.” In an echo of the VAT-free shopping report, Cebr had used elasticities inappropriately, distorting the result.39
Congestion charging. In 2005, Cebr produced a report for the West London Residents’ Association and Federation of Small Businesses forecasting that extending London’s congestion charge would cost around 6,000 jobs. GLA Economics published a 15-page rebuttal saying Cebr had employed a “dubious and opaque methodology”, with results that “do not survive a commonsense check”. Of course the GLA was defending its own research but, as with the VAT-free shopping report, we see basic errors which produce a distorted result, helpful to their client.
Passport delays. In 2022, Cebr estimated that delayed passports would cost holidaymakers more than £1.1bn. But all of this rested on a key assumption: people had only a 50% chance of getting their passport renewed in time to travel. Full Fact repeatedly asked for evidence supporting this. Cebr had none – and explained it was an assumption made for illustrative purposes. But, as with the VAT-free shopping report, that assumption both undercuts their headline and is not mentioned in press releases (and therefore media coverage).
Conclusion
The errors in the Cebr report are serious. Using our illustrative £1.44 GVA benchmark (higher than any official figure) and correcting the other three problems turns its £2.6bn gain into a £582m loss to the Exchequer, using Cebr’s own model and assumptions.
The questionable assumptions are also serious. The “upper bounds” identified in the report40 are, each time, used as inputs to the model without explanation. And, if we replace these assumptions with approaches we consider more realistic, Cebr’s modelled economic output all but vanishes.
This is the second time in a month that we have looked at a report commissioned by an industry group and found numbers that are, in our view, greatly inflated.
That suggests there’s a wider problem. Public debate on tax is increasingly driven by reports commissioned by lobbyists. They’re rarely, if ever, verified by anyone independent. We never know the terms under which they were written. The methodology is often opaque. The underlying calculations are almost never set out in full. The incentives for the consultancies are to produce nice reports that say exactly what the lobbyists want.
The obvious answer: policymakers and media should be sceptical of all such reports unless there is complete disclosure and publication of the underlying calculations, so that anyone can run it and test it. That means full publication of the working model and the data behind it, not a methodology annex or a description of the approach.
If that’s something we are able to do with our limited resources, then it’s certainly something the large economic consultancies should be able to do. Everything behind this report, including the model, is published on our GitHub (if you identify any errors, please get in touch).
And we should all be sceptical of anybody claiming there’s a free lunch.
Methodology
At the centre of this report is a model we constructed by reverse-engineering Cebr’s calculation. We did that by reference to its report, and the sources the report cites.41 Every step and every input to the report can be adjusted by the user. All the code is open source and fully documented, and available on our GitHub.
Our model reproduces Cebr’s published results closely (although not perfectly, particularly employment, where our tourism productivity proxy differs from Cebr’s regional economy-wide method and produces a 7.4% discrepancy).
The model runs an annual scenario using Cebr’s 2025 baseline. It starts from £33.2bn of overseas visitor spending and about 43.3m visits, calculates the potential refund and estimates the response of total spending. In Cebr’s reproduction mode it separates arrivals and spending per visitor. In both alternative presets it applies one response to total spending and does not estimate additional visits. Extra spending is converted to GVA, then to tax receipts, with refunds deducted.
These are the key assumptions:
| Assumption | Our central value | Cebr | Status | Basis | Sensitivity |
|---|---|---|---|---|---|
| Baseline visitor spending and visits | £33.2bn, 43.3m visits | Same | Published baseline and geographical assumption | Cebr’s spending baseline. Visits are VisitBritain’s 43.6m multiplied by 33.2/33.4, assuming the same geographical reduction as spending; they are not back-solved from per-visitor outputs. | Spending scales the financial results. Baseline visits affect the visit and per-visitor displays, not total spending or the fiscal result. |
| Share of visitor spending that is shopping | 25% | Same | Historical survey and scenario assumption | VisitBritain shopping categories from 2011, applied by Cebr as a hypothetical upper bound for 2025. | Net cost £507m at 20%, £767m at 30%, with other central settings fixed. |
| Share of that shopping eligible for a refund | 80% | 100% | Judgment informed by categories | Goods must carry VAT and be exported in luggage. Reduced-rate goods can also qualify. VisitBritain does not measure VAT status or export behaviour: 80% is our illustrative assumption about the mix. | Significant. Net cost £555m at 70%, £800m if all of it qualifies |
| Share of eligible purchases actually claimed | 70% | 100% | Conditional calibration | £525m of gross 2019 refunds is 2.95% of non-EU visitor spending, before fees. The assumed 70% rate depends on 80% eligibility and assumptions about EU visitors; historical refunds do not measure these separately. | Significant. Net cost £580m at 64%, £814m at 89%, £918m if everyone claims |
| Refund operator and retailer fees | 20% of the refund | 0% | Evidence, low end | The OBR used 20%. A minister gave 36% in 2023 and an HMRC survey found 39% | Significant. Net cost £601m at 0%, £669m at 39% |
| Share of the remaining refund that reaches the shopper | 100% | 100% | Generous to the scheme | Retailers can offset a refund with a higher price or a smaller discount. We found no study measuring this for tourist refunds, so we left it at the most favourable value | Significant but reasonably uncontroversial. Net cost £705m at 50% |
| Visitor response to a cheaper trip | −1.0 on total spending | −1.3 on arrivals and −1.6 on spending, compounded | Judgment within the evidence | −0.61 is a UK aggregate spending estimate; the −1.6 inferred from Gago concerns Spain. Other studies give larger responses. Our −1.0 is an illustrative choice, not an estimate for a UK shopping refund. | Significant. Net cost £692m at −0.6, £553m at −1.6 |
| GVA per £1 of additional visitor spending, before displacement | £1.44 | £2.80 | Tourism-specific benchmark, above every official input-output figure | Deloitte and Oxford Economics: (58.0 ÷ 113.1) × 2.8. The totals include government spending and investment, so this does not establish the marginal effect of extra visitor spending. | Roughly halves GVA and the tax that follows. Result not sensitive to precise figure – with the other corrections, the scheme loses money at any value below about 2.4 |
| Share of overall GVA that adds to UK output | 50% | 100% | Judgment | One overall percentage, informed by economists’ judgment and published appraisal examples; see the evidence and its limitations above. | Significant. Net cost £483m if the whole footprint is new, £713m at 25%. GVA £890m against £222m |
| Tax raised per £100 of extra output | £34.40 | £34.40 | Illustrative judgment | We retain Cebr’s 34.4% as an illustrative assumption because the point is of limited significance. | £53m across the £26 to £38 sensitivity range at current central settings. |
| Refunds counted as a cost | All of them | Baseline purchases only | Arithmetic | The original report said £1.4bn included induced purchases; the revision says baseline purchases only. Cebr confirms total refunds of £1.56bn in its separate £1.54 calculation. | £172m |
| Output per supported job | £70,400 | Not stated | Historical forecast proxy | VisitBritain’s 2013 forecast for 2025: £324bn of tourism contribution against 4.6m jobs. Cebr uses regional productivity instead, which we haven’t rebuilt | Jobs only, in proportion. No effect on GVA or tax |
The model has four presets: Cebr’s published approach; our alternative GVA benchmark with the other three corrections; our central assumptions, which retain that benchmark; and our “free lunch” voucher proposal.
Changing the assumptions to our central value cuts the economic benefit by more than four-fifths.
Here are the steps our model goes through:
1. The refund
Eligible shopping is baseline spending multiplied by the shopping share and the eligible share. Because visitor spending is measured VAT-inclusive, the refundable VAT within it is one sixth, not one fifth. Multiply by the claim rate and we have the baseline refund bill: £33.2bn × 25% × 100% ÷ 6 = £1.383bn on Cebr’s settings, and £0.775bn in our central case (£33.2bn × 25% × 80% × 70% ÷ 6).
2. The price cut the visitor retains
We adjust for any price increase (from partial pass-through), then fees. What’s left, expressed as a share of total trip spending, is the price reduction that changes incentives.
3. How visitors respond
Cebr runs two responses and compounds them: more visitors, and more spending per visitor. So the extra spending is £33.2bn × ((1 + 5.42%) × (1 + 6.67%) − 1) = £4.13bn, against its published £4.1bn.
Our model optionally corrects this by applying one elasticity to total spending.
4. From spending to output
To reproduce Cebr’s calculation, we multiply additional visitor spending by 2.8, because that is the figure Cebr uses. Its original report attributed the figure to Deloitte and Oxford Economics’ study for VisitBritain. Cebr has since withdrawn that attribution and says it calculated 2.8 from World Travel & Tourism Council data. We haven’t been able to reproduce that calculation, and Cebr hasn’t supplied the annual figures and complete workings we requested.42
Our two alternative presets use £1.44 of GVA per £1 of visitor spending as an illustrative historical benchmark – it’s higher than any official figure. We calculate it from the Deloitte and Oxford Economics study for VisitBritain: (£58.0bn ÷ £113.1bn) × 2.8 = £1.436. The £58.0bn includes tourism-related government spending, and the wider footprint also includes private and government investment. Dividing these totals by visitor spending does not establish a marginal effect for the proposed scheme, and if anything overstates it.43
Displacement therefore has to be applied separately, on top of the multiplier. Cebr applies none. Our model enables you to add this in.
We apply one additionality percentage to the overall GVA figure. Deloitte’s totals do not isolate three rounds generated by visitor purchases: in particular, the difference between £126.9bn and £58.0bn includes investment as well as supply-chain effects. We therefore don’t use those differences to set separate percentages for direct, supplier and staff-spending effects.
Our central case treats 50% of the overall GVA as additional UK output. This is an illustrative judgment, informed by the evidence and qualifications above. On Cebr’s own assumptions, the scheme pays for itself only if more than about 35% is additional. With our £1.44 benchmark and the other three corrections, even 100% additionality leaves a fiscal loss. That remains the case for any multiplier below about 2.4; every official figure is well below that.
5. Tax and refunds
Tax is the modelled GVA multiplied by the yield per pound of output. Against it sits the refund bill: the VAT given back on purchases visitors would have made anyway, plus the VAT given back on the extra purchases the scheme induces. Cebr’s headline includes only the first, which is the fourth error.
The tax-yield assumption makes a relatively small difference at our central settings. We retain 34.4% as an illustrative assumption. Varying it from £26 to £38 per £100 of GVA changes the fiscal result by £53m. 44
6. What the model does not do
As this is a reconstruction of Cebr’s model, it inherits every limitation of that model.
We don’t model the tax paid by refund operators on their fees, so switching fees on takes money out of the visitor’s pocket without crediting it anywhere.
The model doesn’t re-price anything: the pass-through control applies a fixed offset rather than recalculating prices and refund bases. The elasticities are applied linearly, which is standard for a price change of this size, but not exact. And “supported jobs” is Cebr’s own term, which by its own footnote includes existing jobs doing more work, so it isn’t a count of new jobs.
It also ignores what the scheme costs to run and to police. The Australian National Audit Office’s 2019 audit of Australia’s equivalent scheme found its administration only partly effective, with weaknesses in compliance controls. An OECD case study of Latvia shows the effect of minimum purchase thresholds. Both demonstrate that a refund scheme has running costs and leakage that a simple model like this one can’t capture.
We’ve published all the code for our model – please let us know if you identify any errors.
References
We list below all the papers that we reviewed when preparing this report, as well as the papers we would have liked to review but were not able to obtain.
The report under review, and the sources it uses
- Cebr for the Heart of London Business Alliance, on reintroducing VAT-free shopping: original report, September 2026
- Cebr for the Heart of London Business Alliance: revised report, marked Updated September 2026
- Deloitte and Oxford Economics for VisitBritain, The economic contribution of the tourism economy in the UK, 2013
- VisitBritain, Foresight 112, Shopping, February 2013
- Gago, Labandeira, Picos and Rodríguez, on taxing tourism in Spain, 2006
- British Tourist Authority, on the price sensitivity of tourism to Britain (we host a copy)
- British Tourist Authority, Sensitive tourists, submission on air passenger duty
Official UK sources
- Office for Budget Responsibility, VAT Retail Export Scheme: review of the 2020 policy costing, March 2024
- OBR, the shorter published box version of the same review
- OBR, covering letter to Sir Geoffrey Clifton-Brown
- HM Treasury, The Green Book, 2026
- HM Treasury, technical note on withdrawing the VAT Retail Export Scheme and airside tax-free shopping, 9 October 2020 (we host a copy)
- HMRC Policy Lab, VAT RES user survey findings, May 2020 (we host a copy)
- Second witness statement of Michael James Cunningham, HM Treasury, 27 January 2021 (we host a copy)
- HMRC internal manual on VAT Retail Export Scheme administration charges
- HMRC guidance on VAT rates for different goods and services
- House of Commons debate on tax-free shopping for international visitors, 7 September 2023
- Written question 20557 on the VAT Retail Export Scheme, March 2024
- House of Commons Library briefing on tax-free shopping, 2023
- House of Commons Library briefing on tourism statistics and policy
- ONS, Travel trends, and the overseas residents visits datasets
- ONS, Travel trends 2024
- ONS, UK Tourism Satellite Account, 2023
- ONS, Consumer card spending, UK tourism-related sectors: 2019 to 2024
- ONS, International Passenger Survey methodology
- ONS, International Passenger Survey background notes
- ONS, an introduction to the UK national accounts
- Bank of England, Monetary Policy Report, July 2026
- OECD, Revenue Statistics 2025
- Competition and Markets Authority, Fintrax and GB Tax Free merger decision, 2017
- Welsh Government, review of visitor levies in global destinations, 2024
Tourism demand and price response
- Blake and Cortés-Jiménez, The drivers of tourism demand in the UK, for DCMS, 2007
- Cortés-Jiménez and Blake, on demand modelling by purpose of visit and nationality, 2011
- Durbarry, on tourism taxes and UK tourism demand, 2008
- Peng, Song, Crouch and Witt, meta-analysis of international tourism demand elasticities, 2015
- Scottish Government, Review of evidence of elasticities relevant to tourism in Scotland, 2021
- Song, Seetaram and Ye, on taxes and the allocation of a holiday budget, 2019
- Seetaram, Song and Page, on Air Passenger Duty and outbound travel, 2014
- Tourism Alliance, Facts and figures, 2025
- Anguera-Torrell, Aznar-Alarcón and Boto-García, on the Manchester accommodation levy, 2025.
Vouchers, rebates and spending behaviour
- Hastings and Shapiro, How Are SNAP Benefits Spent? Evidence from a Retail Panel, 2018
- Epley, Mak and Idson, on how describing income as a bonus or rebate affects spending and saving, 2006
- Ding, Jiang, Msall and Notowidigdo, Consumer-Financed Fiscal Stimulus: Evidence from Digital Coupons in China, 2025
Multipliers, economic impact and appraisal method
- Dwyer, Forsyth and Spurr, on evaluating tourism economic effects, 2004
- Dwyer, Forsyth and Spurr, the same paper in full text
- Jago and Dwyer, Economic evaluation of special events: a practitioner guide, 2006
- Faber and Gaubert, on tourism and economic development in Mexico, 2019
Tax-free shopping schemes elsewhere
- Paliś and Śliwińska, on the possibility of recovering VAT as a determinant of shopping tourism, 2019, which surveys Polish travellers on whether they know refunds exist
- Statistics Canada, Government revenue attributable to tourism, 2007, which covers Canada’s abolition of its own GST visitor rebate in March 2007
- Oxford Economics for the Association of International Retail, Economic impact of tax-free shopping in the UK, 2022
- Dimanche, on the Louisiana Tax Free Shopping programme, 2003
- Alijani and Speyrer, economic impact and visitor profile for Louisiana Tax Free Shopping, 2008
- Louisiana Tax Free Shopping refund-centre tables, 2001 to 2011 (we host a copy)
- Nabilah, on exchange rates, relative prices and the tax refund policy in Indonesia, 2016
- Australian National Audit Office, Management of the Tourist Refund Scheme, 2019
- OECD, on using tax-free shopping data to enhance tourism statistics in Latvia, 2025
- Wang and Stewart, on the law and policy of VAT tourist refund schemes, 2021
- Bai and Shen, on departure refunds in Hainan, 2016
- Honajzrová Banús, on four South American refund systems, 2020
Cross-border shopping and tourism taxes
- Baggs, Fung and Lapham, on exchange rates, cross-border travel and retail, 2015
- Friberg, Halseth, Steen and Ulsaker, on cross-border shopping and tax revenue, 2024
- Gooroochurn and Sinclair, on tourism taxation in Mauritius, 2005
- European Commission and PwC, on taxes and European tourism competitiveness, 2017
- Biagi, Brandano and Pulina, on Italian accommodation taxes, 2017
- Heffer-Flaata, Voltes-Dorta and Suau-Sanchez, on accommodation taxes and UK travellers, 2021
- Cavallero and Zagler, on competition between Italian coastal destinations, 2025
- Aguiló, Riera and Rosselló, on the short-term price effect of a tourist tax, 2005
- Rosselló and Sansó, on the Balearic accommodation tax, 2017
- Rosselló-Nadal and Sard, review of tourism taxation, 2026
VAT pass-through and who gets the money
- IMF, Estimating VAT pass-through, working paper 15/214
- Benzarti, Carloni, Harju and Kosonen, on asymmetric VAT pass-through
- DellaVigna and Gentzkow, on uniform pricing in US retail chains, 2019
- Busse, Silva-Risso and Zettelmeyer, on the pass-through of car rebates, 2006
- Sallee, on the incidence of hybrid vehicle subsidies, 2011
- Butters, Sacks and Seo, on local sales taxes and prices, 2022
- Byrne, Martin and Nah, on negotiated prices, 2022
- Irish Fiscal Advisory Council, on VAT rate changes and pass-through, 2025
Our own earlier work on VAT pass-through
- Proposals to abolish VAT on sunscreen and EV charging
- Our analysis of the abolition of the tampon tax
- Our analysis of the abolition of VAT on e-books
- Proposal to reduce VAT on hospitality to 10%.
Read using machine translation, not checked by a native speaker, and so should be regarded with caution
- Aribowo and Ardiana, on the VAT refund policy at Ngurah Rai airport in Bali, 2020. The full paper, in Indonesian. It carries its own English abstract.
- Chansarn, on Thailand’s VAT refund for tourists policy, 2009. The full paper, in Thai. The journal publishes its own English abstract.
- Tsai and colleagues, on the Taipei 101 refund reform, 2018 conference version. The full paper, in Chinese. The paper carries its own English abstract.
Relevant work we could not obtain, or could not read
- Zhang and Zheng, on the inbound tourism effect of departure tax refund policy, 2023. Published in Chinese. We have the English abstract only.
- 賴琦捷, on the effect of tax-refund policy changes on foreign visitors’ consumption, 2016. A Chinese-language master’s thesis. The institution’s site timed out and we obtained neither the thesis nor its record.
- Yamagishi and Nagai, on Japan’s tax-free shopping environment, 2024. Abstract only.
- Tsai and colleagues, the final 2021 journal version of the Taipei 101 study. We obtained the 2018 conference version and read it in machine translation. The final journal article was not obtained.
All the code behind the model and the web app is available on our GitHub.
Many thanks to P and G for the underlying analysis and original model, A, K and B for additional research, and V and O for industry insight. Thanks to I for additional comments, and to B2 for their review.
And thanks, as ever, to the authors of Apache ECharts and the other open source tools we rely upon so heavily.
Capital gains tax reform was right. Now it’s dead.
37 ways Andy Burnham could raise £4.7bn
The £12bn VAT cut for hospitality. Who really benefits?
The Budget – what it says

The Budget small print: six key reforms to watch
Betting on tax avoidance – is Sky Bet avoiding £55m tax per year?
Footnotes
Proponents often point to the 27 EU countries who have VAT-free shopping, and suggest that this makes the UK an outlier. They’re ignoring the fact that this is not 27 individual choices – it’s a requirement of EU law. Outside the EU, the position is mixed. ↩︎
Each bar shows one change, applied on top of those to its left. The changes interact, so their separate effects cannot simply be added together. The size of each bar after the first depends on the changes already applied. Hover over a bar for the figure. ↩︎
Our job figures use Deloitte’s tourism productivity proxy. Cebr uses regional economy-wide productivity, so the employment comparison also changes that assumption. Neither calculation estimates newly created jobs. ↩︎
If their answer is that vouchers are less effective at incentivising spending then (1) they need to deal with the literature, which does not obviously support that claim (see further below), and (2) show not just that vouchers are less effective, but that they are very significantly less effective (the gross tax yield from our voucher proposal has to fall by about 2/3 before the proposal becomes loss-making). ↩︎
The study states the definition four separate times: in the executive summary on page 4, in the section 4.2.1 definitions, in the page 29 text, and in its own aggregates. ↩︎
ONS input-output analytical tables 2023, Type I GVA effect per £1 of final demand: the maximum is exactly 1.000 across all 103 products, because GVA, imports and taxes on products sum to £1. Scottish Government supply, use and input-output tables 2022, Type II GVA effect: maximum 1.324 across 98 industries, median 0.78. The ONS publishes Type I only, which is why the Type II figures are Scottish. ↩︎
The study defines direct tourism activity to include tourism-related government spending (printed p.7). Its wider tourism economy also includes private and government investment, alongside supply-chain effects. On printed p.11 it reports £58.0bn of direct GVA and £113.1bn of visitor spending. Applying its rounded Type II multiplier of 2.8 (Figure 4.2.2b, printed p.29) gives (58.0 ÷ 113.1) × 2.8 = 1.436. We retain this broad historical comparison as an illustrative assumption. Cebr now attributes its own 2.8 to WTTC; it hasn’t supplied the full calculation. ↩︎
The Deloitte study, printed pages 11 to 12, estimates a total contribution of £160.5bn against £113.1bn of visitor spending in 2013: a ratio of approximately 1.42. Its often-quoted 11.4% of GDP includes tourism-related government spending and investment as well as visitor purchases and their wider effects. For comparison, DCMS estimates tourism’s direct contribution at 2.4% of UK GVA in 2024; when comparing different sectors, we believe this is the more appropriate figure to use. ↩︎
Multiply 2.8 by the £113.1bn of tourist spending in that study and you get £317bn, equivalent to 22.5% of GDP on the study’s figures. Its own total contribution estimate is £160.5bn, or 11.4%. The spending figure is in Figure 2.2.1a and the contribution figures are in Figure 2.2.3a, both on printed page 11. This compares Cebr’s international-visitor ratio with a historical tourism-wide estimate; it is a sense check, not a like-for-like estimate of the proposed scheme. ↩︎
British Tourist Authority, The Price Sensitivity of Tourism to Britain, 2001, printed pages 15 and 16. The estimated exchange-rate coefficient is −1.280; the dependent variable is real tourism receipts. See also Cebr’s discussion on page 14. ↩︎
Gago’s simulation produces a 3.2% reduction in total tourist spending following a 2% price increase, implying the −1.6 used by Cebr. Its underlying aggregate expenditure elasticity is calibrated at −1.73. This is not a separately estimated spending-per-visitor elasticity. ↩︎
Blake and Cortés-Jiménez, The Drivers of Tourism Demand in the UK, report for DCMS, December 2007, executive summary on page 2 and Table 3 on page 18. Their aggregate expenditure coefficient is −0.61, rounded to −0.6 by Cebr. ↩︎
Cebr ran its own regressions of EU visitor numbers and EU visitor spending against the real sterling-euro exchange rate, reported on page 15, and got −0.9 and −0.7. It then used −1.3 and −1.6 from other sources in the policy calculation. Cebr argues that scheme users may be more price-sensitive than average visitors, but hasn’t shown quantitatively how that justifies the gap between its regression results and its modelled responses. ↩︎
HMRC’s Policy Lab surveyed VAT RES users in May 2020 as part of work on digitising the scheme. The 39% is a mean among respondents who gave an estimate, and the survey itself warns that part of its sample is unreliable. It surveys people who had already attempted a claim, so it describes claimants rather than visitors generally. We use the OBR’s 20% precisely because it’s the lowest and best sourced of the three. ↩︎
Baseline spending of £33.2bn plus the £4.1bn of extra spending it forecasts is £37.3bn; a quarter of that is shopping; and the VAT within that is one sixth, giving £1.56bn. The £33.2bn baseline is on page 19 of the Cebr report, the £4.1bn of additional spending on page 20, the 25% shopping share on page 18, and the £1.4bn refund figure on page 21. ↩︎
The report’s separate claim of £1.54 of tax for every £1 refunded only works from the £1.56bn figure. Start with roughly £4bn of extra tax and deduct £1.56bn of refunds: that leaves about £2.4bn, or around £1.54 of net gain for each £1 refunded. So the report uses the larger refund bill in one paragraph and the smaller one in the headline. Cebr has since confirmed this reading, see its response below. ↩︎
Displacement should be accounted for by an adjustment on top of the multiplier, and techniques that fail to do so have been criticised. Dwyer, Forsyth and Spurr, writing in Tourism Management in 2004, open by noting that “techniques such as multiplier analysis and Input-Output analysis are still very commonly used to make estimates of the economic impact of changes in tourism expenditure. These techniques have serious limitations”. Their point is that real computable general equilibrium models embed an input-output matrix but add the resource constraints and price responses. Cebr did not do this. ↩︎
VAT Retail Export Scheme: review of the 2020 policy costing, March 2024. The OBR also declined to include any supply-side GVA channel of the kind Cebr relies on. ↩︎
The Additionality Guide (Homes and Communities Agency, fourth edition, 2014), Table 4.8 on printed p.30, defines medium displacement as “About half of the activity would be displaced”, 50%, for use “in the absence of specific local information”. Its Table 4.5, on p.29, is one reason we expect the true figure to be lower: displacement measured at UK level in the City Challenge evaluation was 75% to 100%, against 8% to 17% within the programme areas.
Research to improve the assessment of additionality (BIS Occasional Paper No. 1, October 2009), paragraph 8.5 on p.30, found a mean net additionality ratio of 50.3% and a median of 48.8% across 226 observations at regional level. Those are regional programmes, and the ratio also removes activity that would have happened anyway, which Cebr’s baseline already excludes. ↩︎
Oxford Economics’ Greater Cambridge: Growth Scenarios, commissioned by MHCLG and published by it in November 2025, applies explicit displacement deductions to estimate additional UK-wide GVA. See Table 4, which uses 25% to 50% displacement for life sciences and high-tech services, 50% to 75% for market and other knowledge-intensive services, 90% to 100% for supply-chain effects, and 66% to 78% for resident spending. That leaves only 0% to 10% of supply-chain effects and 22% to 34% of resident-spending effects as additional UK output in that assessment. We don’t transfer those percentages to this policy or claim that Deloitte’s totals identify equivalent rounds.
Dwyer, Forsyth, Spurr and Ho, The Economic Impacts and Benefits of Tourism in Australia (Sustainable Tourism CRC, 2004), Tables 3 and 4, printed p.21, compare input-output and general equilibrium estimates for two events. National GDP impacts fall from A$43.267m to A$13.697m and from A$1.881m to A$0.690m: approximately 32% and 37% remain (reductions of approximately 68% and 63%). The authors add that these “may be on the high side”. The modelled events include domestic visitors, so some of the adjustment reflects spending switching between destinations. Their separate overseas-visitor analysis also identifies losses elsewhere through exchange-rate and resource effects (Table 5). ↩︎
Other studies do report still larger responses, albeit in other contexts, so these are not the largest figures in the literature – we can imagine justifications for the -1.3… they’re just not in the Cebr report. ↩︎
We don’t adopt −0.7 and −0.9 ourselves. Our central case uses −1.0 on total spending, between the British estimates and the Spanish one, because Cebr’s regressions measure a response to exchange-rate movements rather than to a shopping refund, and it’s questionable if the response will be the same (because tourists internalise an approximate exchange rate rather than the actual exchange rate). ↩︎
Durbarry, modelling 11 origin countries over 1968 to 1998, reports own-price coefficients of −2.0 and −2.3 for arrivals and −1.5 to −1.9 for total real expenditure, which is larger than even Cebr’s −1.6. The data is old and the price measure is a broad index rather than a shopping refund. Blake and Cortés-Jiménez’s estimate splits out into −0.61 for aggregate spending but −1.23 for holiday spending, and their later article finds enormous variation by market, from −1.08 for American holiday visitors to −2.48 for Spanish. Peng and colleagues, pooling 195 studies, conclude that elasticities vary so much with origin, destination and specification that a single average is often the wrong tool. The Scottish Government’s 2021 evidence review, which the OBR also relies on, found only two UK-specific studies and took a median of −1.53 from them, concluding that UK tourism demand is “generally price elastic”. That’s well above our −1.0 and we should say so. None of these measures a response to a retail refund, which plausibly is different to a response to general changes in pricing. ↩︎
OBR review, March 2024, paragraphs 1.10 to 1.12. The non-EU spending denominator is £28,448m less £10,661m of EU spending, from ONS Travel Trends 2019. These figures exclude international fares. ↩︎
Paliś and Śliwińska surveyed 124 Polish travellers in 2019 and found only a third knew VAT on purchases abroad could be reclaimed at all: 42% had never heard of it, and a further 27% had heard of it but didn’t know the rules. Poland is not London, but these figures are still very low. Aribowo and Ardiana’s study of the refund desk at Bali’s main airport concludes that Indonesia’s scheme has done little to raise visitor numbers, and recommends publicising it to tourists and easing the registration that retailers find difficult. Both are small, and neither is a causal estimate: a 124-person survey and a qualitative case study. ↩︎
There is also a published use of historical refund data to build a baseline. Oxford Economics’ 2022 report for the Association of International Retail, which campaigns for the scheme’s return, builds its baseline the same way we do: “According to data from HRMC, VAT refunds from TFS in this year totalled £500 million with a further £150 million claimed on airside shopping i.e., £650 million in total… this would imply that total associated spending was in the region of £3.3 billion”, from 1.2 million users. ↩︎
HMRC Notice 704, paragraph 2.7. The current Northern Ireland scheme retains the relevant distinction. Our simplified calculation applies the selected VAT rate to all shopping counted as eligible. ↩︎
Foresight Issue 112, February 2013, Chart 4, “Estimated spend on types of shopping”, for 2011. The figures are in the chart image rather than the text. Note that this is 2011 data being applied to 2025 spending; we don’t know if that would make a difference. The relatively high inflation since 2011 has been very different across these categories. ↩︎
Our category assumptions are 90% to 95% for clothes and fabric, 92% to 98% for souvenirs, gifts and household goods, 5% to 15% for food and groceries, and zero for books, papers and maps. Weighting them by the survey totals gives roughly 77% to 83%; the categories and their composition may also have changed since 2011. ↩︎
Our hypothetical voucher gives the visitor its full face value. VAT refund intermediaries deduct fees: the lowest published estimate discussed above is 20% of the refund, reducing the visitor’s saving accordingly. A voucher scheme would have some administration costs, but we expect less than a VAT refund. Conversely, a fixed £100 voucher stops subsidising additional purchases once it is exhausted, whereas a proportional VAT refund continues to reduce the cost of further eligible purchases.
Behaviour may also differ. Someone could use a voucher for shopping they already intended to do and pocket the saving. But an immediately available voucher might encourage extra purchases because it feels like money set aside for shopping. A refund received after the trip could instead be saved or spent back home. There is evidence that these distinctions change behaviour. Hastings and Shapiro’s study of US food benefits found that they increased spending on eligible food substantially more than equivalent cash income, even among households already spending more on food than their benefits covered. Experiments by Epley, Mak and Idson also found that people spent more of a payment described as a bonus than one described as a rebate.
Some voucher schemes have generated large spending responses. A study of Chinese digital coupons estimated additional spending of 3.1 to 3.3 yuan per yuan of government subsidy. Those coupons required minimum purchases, creating different incentives from our £100 voucher. None of these studies establishes how overseas tourists would respond to our proposal, or that the resulting tax receipts would cover its cost. It’s not a serious forecast for the impact of a voucher scheme. ↩︎
Cebr’s refund bill on its own assumptions is £1.383bn, across 43.34m visits, which is £31.92 a head. ↩︎
These figures follow Cebr’s own approach, which we think is wrong: they ignore the vouchers handed to the extra visitors the scheme attracts, just as Cebr’s £2.6bn ignores the refunds on the purchases its scheme induces. The result of the free lunch model is therefore wrong, but consistently so. ↩︎
Under Cebr’s structure the tax returned per £1 handed over is q × M × (ε + 2.08d), where q is the 34.4% tax yield, M the 2.8 multiplier, d the voucher as a share of visitor spending, and ε the combined elasticity of 2.9. As d falls to nothing the return settles at £2.79, and it rises with the size of the voucher: £3.06 at £100. Break-even would need q × M × ε below 1, and 0.344 × 2.8 × 2.9 is 2.79. We should repeat that this approach is not correct because it is preserving all of Cebr’s errors. ↩︎
The paper is written in Chinese. We reviewed it in machine translation, which we have not had checked by a native speaker, so we would not want to rely on the translation too greatly. Their reasoning is that Taipei 101 sells high-value goods and the 2016 changes were small in money terms, so the refund amounts at stake there are unusually large relative to the reform, biasing the estimated effect upwards. Their two explanations for the null result are that downtown refund desks add convenience in claiming but not spending, and that cutting the claim threshold from NT$3,000 to NT$2,000 was too small to change behaviour. ↩︎
The paper is written in Thai. We reviewed it in machine translation, so the same caveat as above. Chansarn warns that he could not remove the time trend from his equations, and that this inflates his R-squared. His figures show real shopping expenditure trending downwards across the sample, with the nominal rise merely tracking domestic prices. ↩︎
The influence of exchange rate analysis, TCPI and tax refund policy toward foreign tourists in Indonesia, Economics Development Analysis Journal 5(1), 2016. Ordinary least squares on 60 monthly observations from January 2009 to December 2013, with the policy dummy switching on in April 2010. The dependent variable is the number of Singaporean visitors, so the study does not measure shopping at all. R-squared is 0.65 with three regressors and no trend or seasonal terms. Chansarn, by contrast, included a time trend and quarterly dummies precisely to avoid this, and Tsai and colleagues designed around it with difference-in-differences. ↩︎
The revised report says it was updated in September 2026 to clarify the sources and methods for its elasticity and multiplier, and to correct the description of the £1.4bn refund cost. The Heart of London press release links to the original report. ↩︎
The revised section 3.1 acknowledges that Gago models general tourism demand rather than the response of scheme users to a VAT refund. The OBR figure it invokes concerns claimants’ spending on eligible goods and changes in those goods’ prices. That is a different quantity from the response of total spending per visitor to a change in the whole trip cost. ↩︎
See paragraph 298 of the committee’s report and the section headed “CEBR Critique of the Sheffield Modelling Study” in Godfrey’s evidence. Sheffield modelled different consumer groups and products, taking account of consumers substituting from drinks to other goods. ↩︎
The £4.1bn of extra spending is “under the assumption that 100% of all potential tax refunds are reclaimed”, the 153,000 jobs are “in the upper bound case”, and the refundable base is “a hypothetical upper bound”. ↩︎
We were very aware of the danger of duplicating their results by twiddling the model and assumptions until we had a best fit – so we were careful not to do that. Instead we carefully designed the model from first principles. ↩︎
Cebr says it divides tourism’s contribution to the economy attributable to international visitors by their spending, then averages the annual ratios for 2013 to 2019. Its subsequent explanation says it removes the contribution attributable to domestic tourism from the numerator. It hasn’t provided the figures or workings for that subtraction. See the correspondence discussed above. ↩︎
See the study’s definitions on printed p.7, the totals on p.11 and the Type II multiplier in Figure 4.2.2b on p.29. We use its rounded 2.8 multiplier, which gives a slightly different result from dividing the £160.5bn total directly by £113.1bn of spending. Cebr’s own 2.8 has a different denominator: Cebr applies it to spending; Deloitte applies it to direct GVA. ↩︎
There is also a correction that favours the scheme. The OECD ratio uses GDP, which includes product taxes excluded from GVA. Applying the 2024 ONS GDP/GVA ratio of 1.1083 to 34.4% gives £38.13 per £100 of GVA. With the other settings fixed at our alternative preset, that reduces its loss from £582m to £488m. ↩︎


Leave a Reply