Screenshot of an opinion piece in The Telegraph by Lord Young, dated 6 October 2021: The Telegraph News Ukraine Sport Business Opinion Money Life Style Travel Culture Plu

UK news Politics World Coronavirus Royals Health Defence Science Education Environment Investigation

COMMENT

With all due respect Prime Minister, Margaret Thatcher would be cutting taxes not raising them

She would have known that higher taxes and spending spell the death knell for our recovery

LORD YOUNG

6 October 2021 • 8:00pm

In his speech at the Conservative Party conference, Boris Johnson invoked the name of Margaret Thatcher in support of his decision to increase taxes to fund extra spending on health. She would have said, he went on, that increased borrowing today would mean higher interest rates and higher taxes tomorrow. With respect, Prime Minister, she might well have said that, and she might well have felt
[illegible]

Mrs Thatcher – tax snatcher?

8 June 2022

Leave a comment

Mrs Thatcher is still heralded as a tax-cutter by many. But what actually happened to UK tax revenues, as a proportion of GDP, over her premiership?
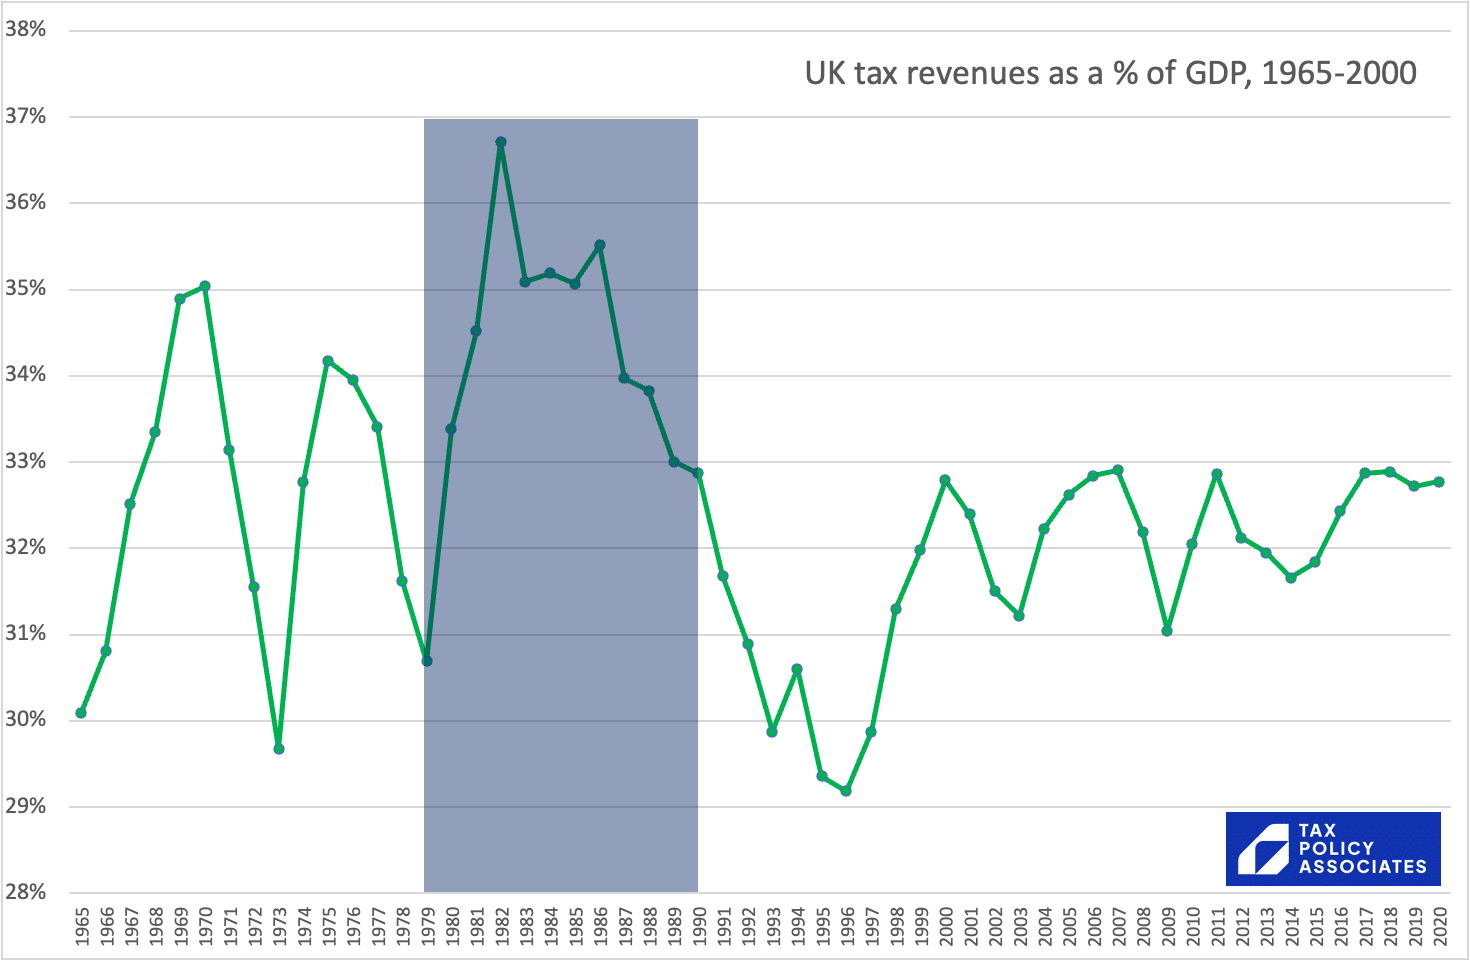
Line graph showing UK tax revenues as a percentage of GDP from 1965 to 2020, with Margaret Thatcher's premiership highlighted: During Margaret Thatcher's tenure from 1979 to 1990 (shaded in blue/grey), UK tax revenues as a percentage of GDP rose sharply from about 30.7% in 1979 to a peak of approximately 36.7% in 1982, before declining to roughly 32.9% in 1990. The 1982 peak represents the highest tax-to-GDP ratio shown across the entire 1965–2020 period.

Title: UK tax revenues as a % of GDP, 1965-2000
Vertical axis: 28% to 38% in 1% increments
Horizontal axis: Years from 1965 to 2020
Shaded region: 1979 to 1990
Logo: TAX POLICY ASSOCIATES

Approximate plotted values (percent of GDP):
1965: 30.1%
1966: 30.8%
1967: 32.5%
1968: 33.4%
1969: 34.9%
1970: 35.0%
1971: 33.1%
1972: 31.5%
1973: 29.7%
1974: 32.7%
1975: 34.2%
1976: 34.0%
1977: 33.4%
1978: 31.6%
1979: 30.7%
1980: 33.4%
1981: 34.5%
1982: 36.7%
1983: 35.1%
1984: 35.2%
1985: 35.1%
1986: 35.5%
1987: 34.0%
1988: 33.8%
1989: 33.0%
1990: 32.9%
1991: 31.7%
1992: 30.9%
1993: 29.9%
1994: 30.6%
1995: 29.4%
1996: 29.2%
1997: 29.9%
1998: 31.3%
1999: 32.0%
2000: 32.8%
2001: 32.4%
2002: 31.5%
2003: 31.2%
2004: 32.2%
2005: 32.6%
2006: 32.8%
2007: 32.9%
2008: 32.2%
2009: 31.0%
2010: 32.0%
2011: 32.8%
2012: 32.1%
2013: 32.0%
2014: 31.7%
2015: 31.8%
2016: 32.4%
2017: 32.8%
2018: 32.8%
2019: 32.7%
2020: 32.7%

They went up a lot, then down a fair bit, but not as much as they went up. Was this the result of specific policy decisions to raise tax? Or something else?

But first – can we make any general statement about the relationship between tax vs GDP and the political party in power? Not really:
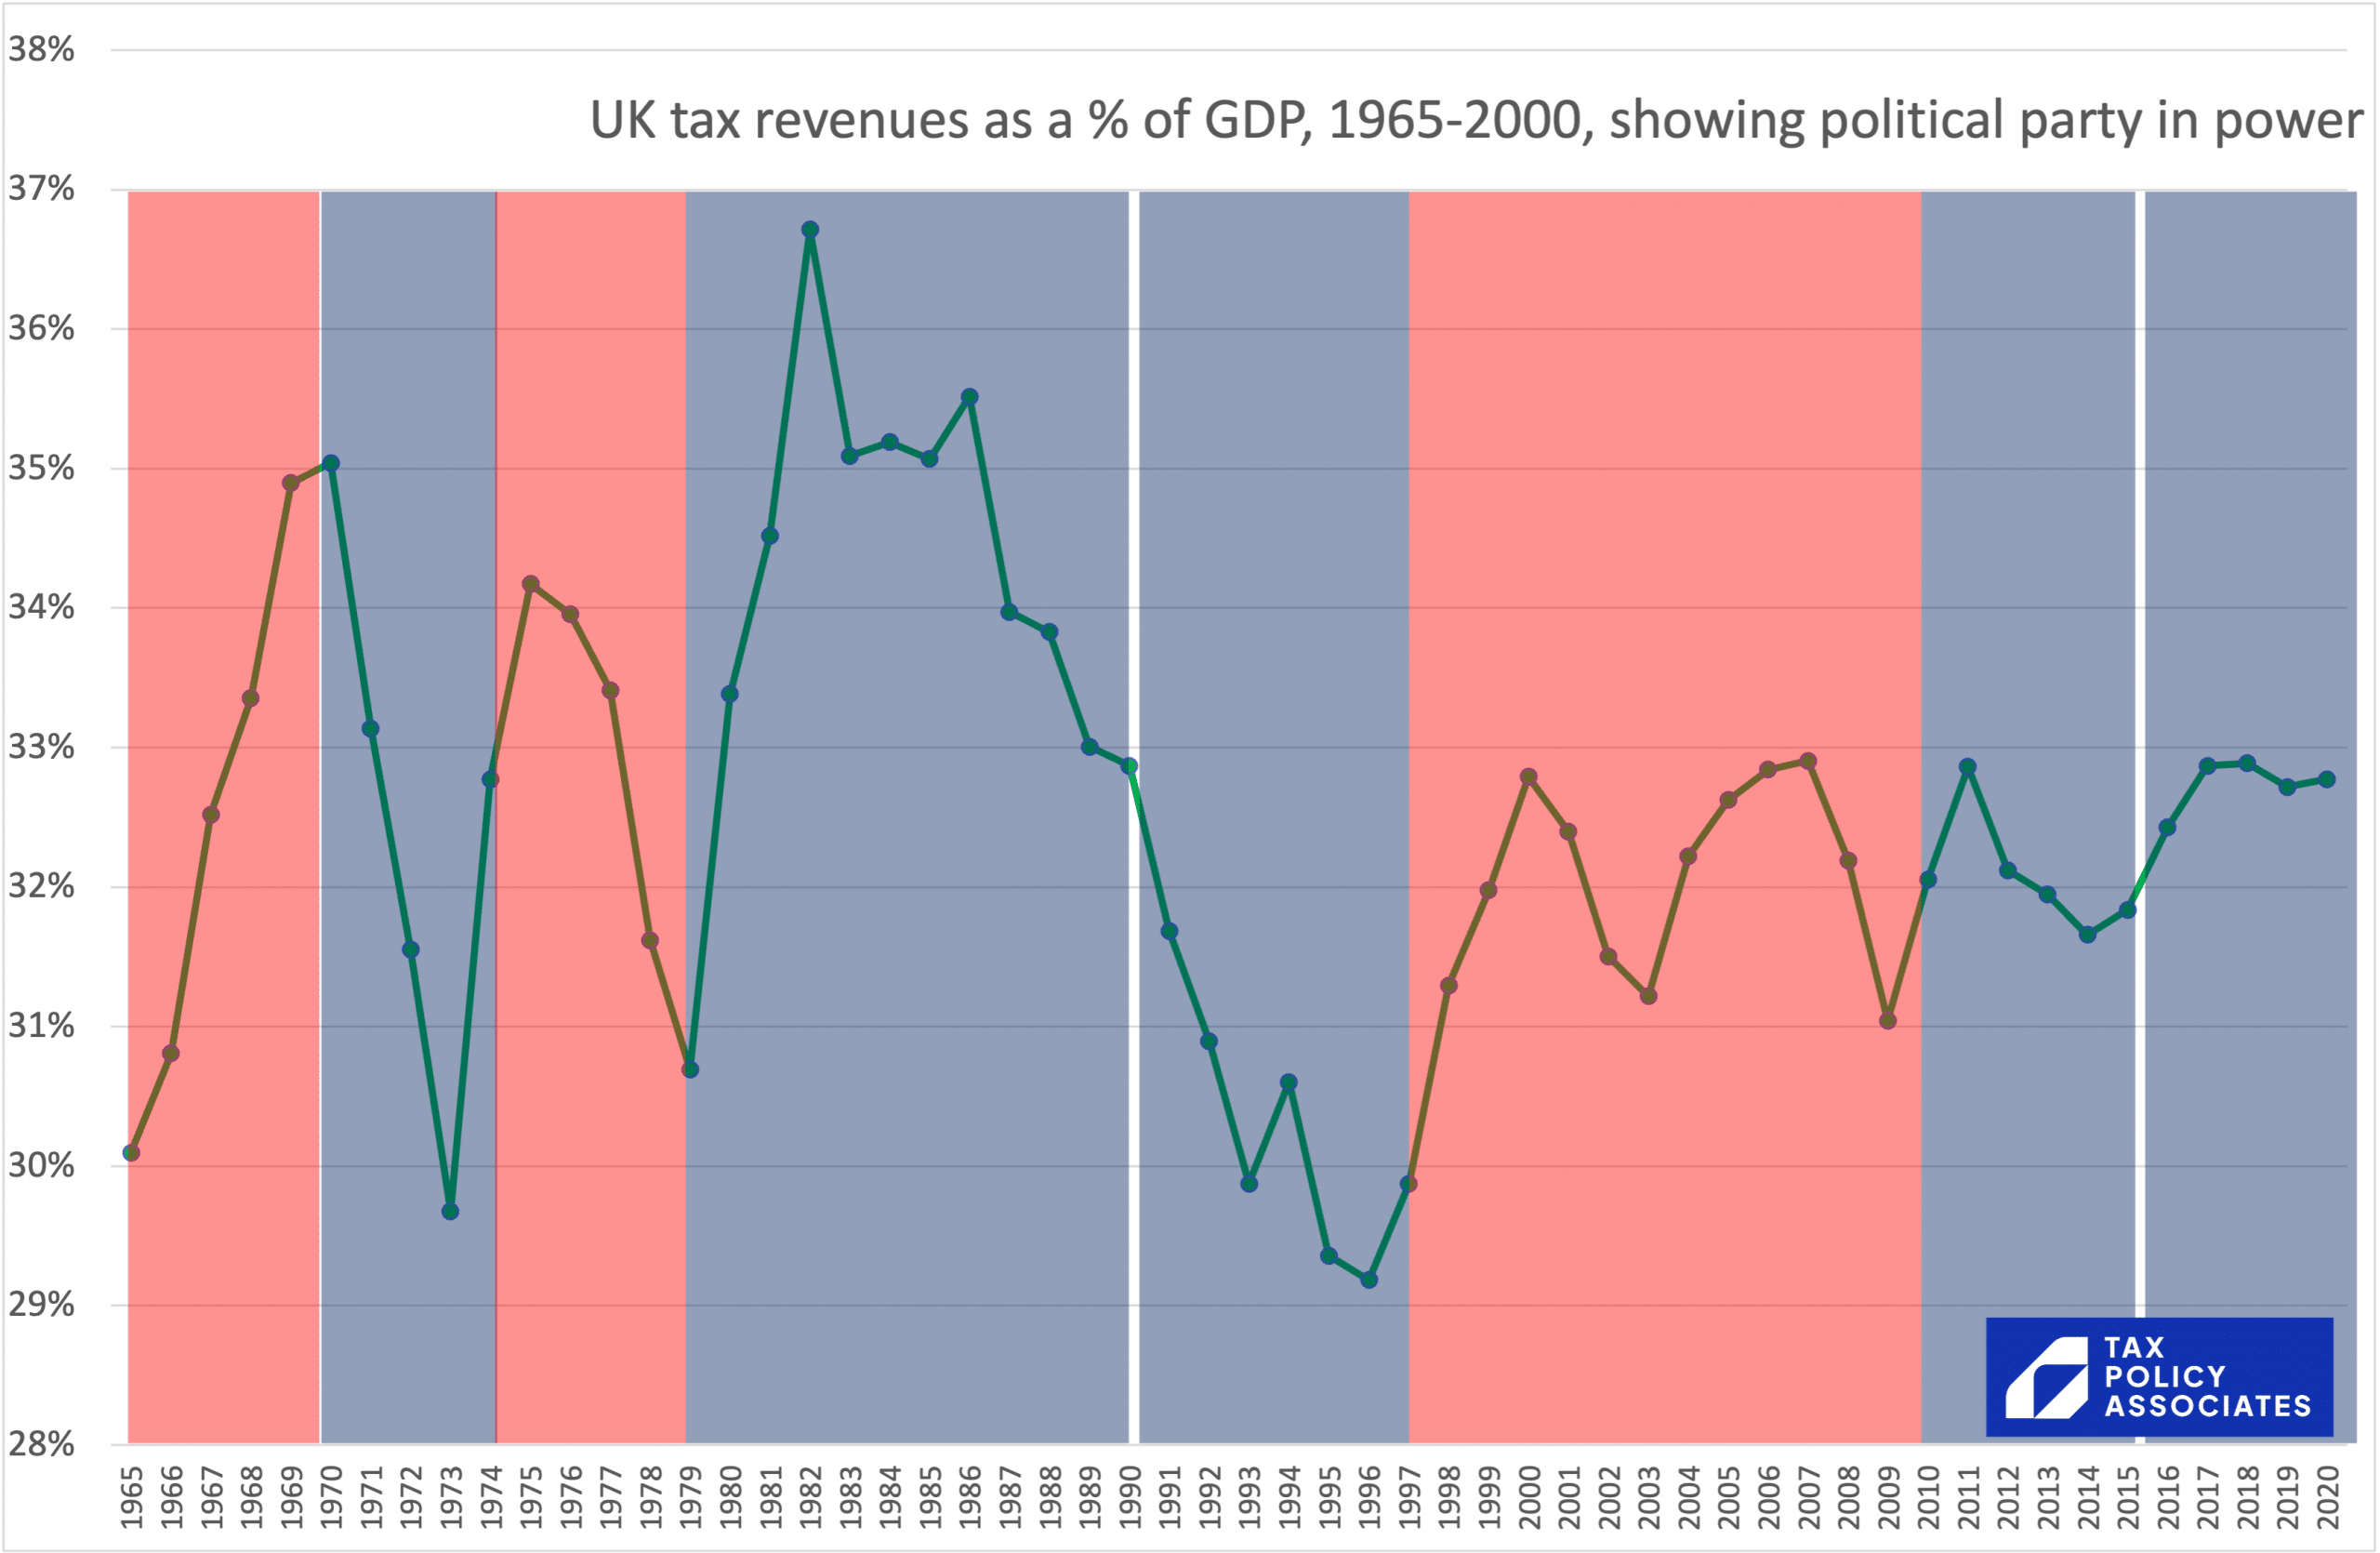
Line chart showing UK tax revenues as a percentage of GDP from 1965 to 2020, shaded by the governing political party: UK tax revenues peaked at nearly 37% of GDP in 1982 under Margaret Thatcher, having risen sharply from under 31% in 1979. Revenues varied between approximately 29% and 37% over the entire period, reaching their lowest point of around 29.2% in 1996 under John Major.

UK tax revenues as a % of GDP, 1965-2000, showing political party in power

Logo: TAX POLICY ASSOCIATES

Y-axis: 28% to 38% (at 1% intervals)
X-axis: 1965 to 2020 (yearly intervals)

Governing parties indicated by background shading:
- 1965 to 1970: Labour (red)
- 1970 to 1974: Conservative (blue)
- 1974 to 1979: Labour (red)
- 1979 to 1997: Conservative (blue, separated by a white vertical bar at 1990)
- 1997 to 2010: Labour (red)
- 2010 to 2020: Conservative/Coalition (blue, separated by a white vertical bar at 2015)

Data points (UK tax revenue as a % of GDP):
1965: 30.1%
1966: 30.8%
1967: 32.5%
1968: 33.4%
1969: 34.9%
1970: 35.1%
1971: 33.1%
1972: 31.5%
1973: 29.7%
1974: 32.8%
1975: 34.2%
1976: 34.0%
1977: 33.4%
1978: 31.6%
1979: 30.7%
1980: 33.4%
1981: 34.5%
1982: 36.7%
1983: 35.1%
1984: 35.2%
1985: 35.1%
1986: 35.5%
1987: 34.0%
1988: 33.8%
1989: 33.0%
1990: 32.9%
1991: 31.7%
1992: 30.9%
1993: 29.9%
1994: 30.6%
1995: 29.4%
1996: 29.2%
1997: 29.9%
1998: 31.3%
1999: 32.0%
2000: 32.8%
2001: 32.4%
2002: 31.5%
2003: 31.2%
2004: 32.2%
2005: 32.6%
2006: 32.8%
2007: 32.9%
2008: 32.2%
2009: 31.0%
2010: 32.1%
2011: 32.8%
2012: 32.1%
2013: 31.9%
2014: 31.6%
2015: 31.8%
2016: 32.4%
2017: 32.9%
2018: 32.9%
2019: 32.7%
2020: 32.8%

One nice symmetry: the overall Thatcher increase in tax from 1979-1990 is almost exactly the same amount as the overall Blair/Brown increase in tax from 1997 to 2010.

So is politics irrelevant? Are the wild swings in fact just driven by recessions, with GDP contracting and so tax/GDP increasing?
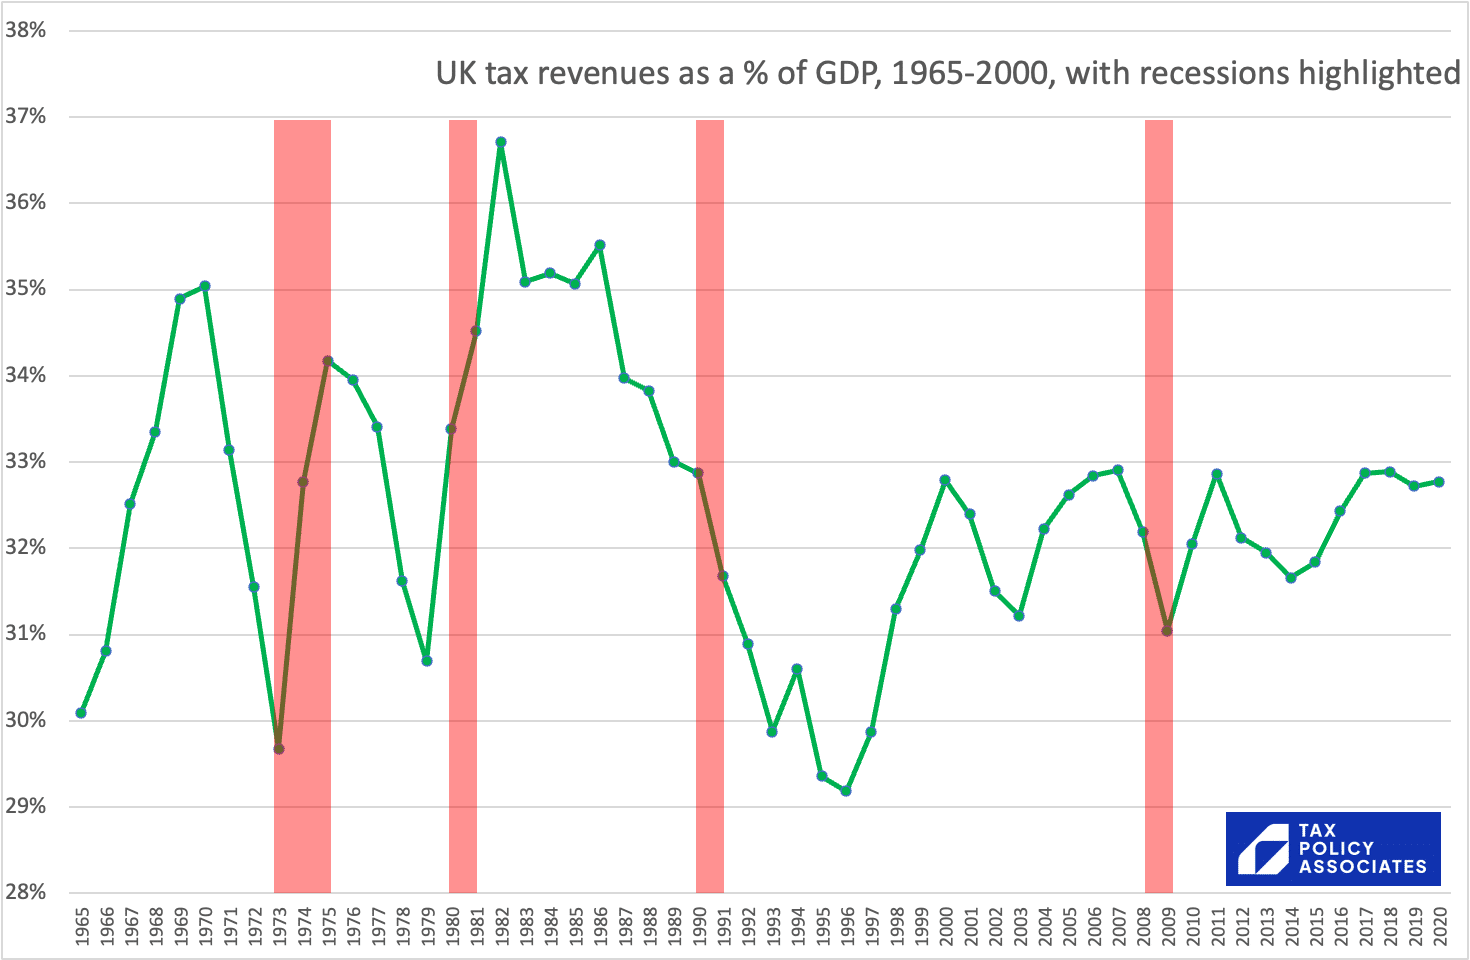
Line chart showing UK tax revenues as a percentage of GDP from 1965 to 2020, with recessions highlighted: UK tax revenues as a share of GDP reached an overall peak of approximately 36.7% in 1982 during the 1980–1981 recession, having previously hit a low of under 30% in 1973. From the mid-1980s high of around 35.5%, receipts declined to a low of approximately 29.2% in 1996 before stabilising mostly between 31% and 33% from the late 1990s through to 2020.

Title: UK tax revenues as a % of GDP, 1965-2000, with recessions highlighted

Y-axis: 28% to 38%, in 1% intervals
X-axis: 1965 to 2020, annually

Recessions highlighted (red vertical bands):
- 1973 to 1975
- 1980 to 1981
- 1990 to 1991
- 2008 to 2009

Approximate data points (tax revenue as % of GDP):
1965: 30.1%
1966: 30.8%
1967: 32.5%
1968: 33.4%
1969: 34.9%
1970: 35.0%
1971: 33.1%
1972: 31.6%
1973: 29.7%
1974: 32.8%
1975: 34.2%
1976: 34.0%
1977: 33.4%
1978: 31.6%
1979: 30.7%
1980: 33.4%
1981: 34.5%
1982: 36.7%
1983: 35.1%
1984: 35.2%
1985: 35.1%
1986: 35.5%
1987: 34.0%
1988: 33.8%
1989: 33.0%
1990: 32.9%
1991: 31.7%
1992: 30.9%
1993: 29.9%
1994: 30.6%
1995: 29.4%
1996: 29.2%
1997: 29.9%
1998: 31.3%
1999: 32.0%
2000: 32.8%
2001: 32.4%
2002: 31.5%
2003: 31.2%
2004: 32.2%
2005: 32.6%
2006: 32.8%
2007: 32.9%
2008: 32.2%
2009: 31.0%
2010: 32.1%
2011: 32.9%
2012: 32.1%
2013: 32.0%
2014: 31.7%
2015: 31.8%
2016: 32.4%
2017: 32.9%
2018: 32.9%
2019: 32.7%
2020: 32.8%

Logo in bottom right: TAX POLICY ASSOCIATES

That looks like an inadequate explanation, only (arguably) fitting the data for the 1973-75 recession.

What if we look at the actual changes in individual taxes?
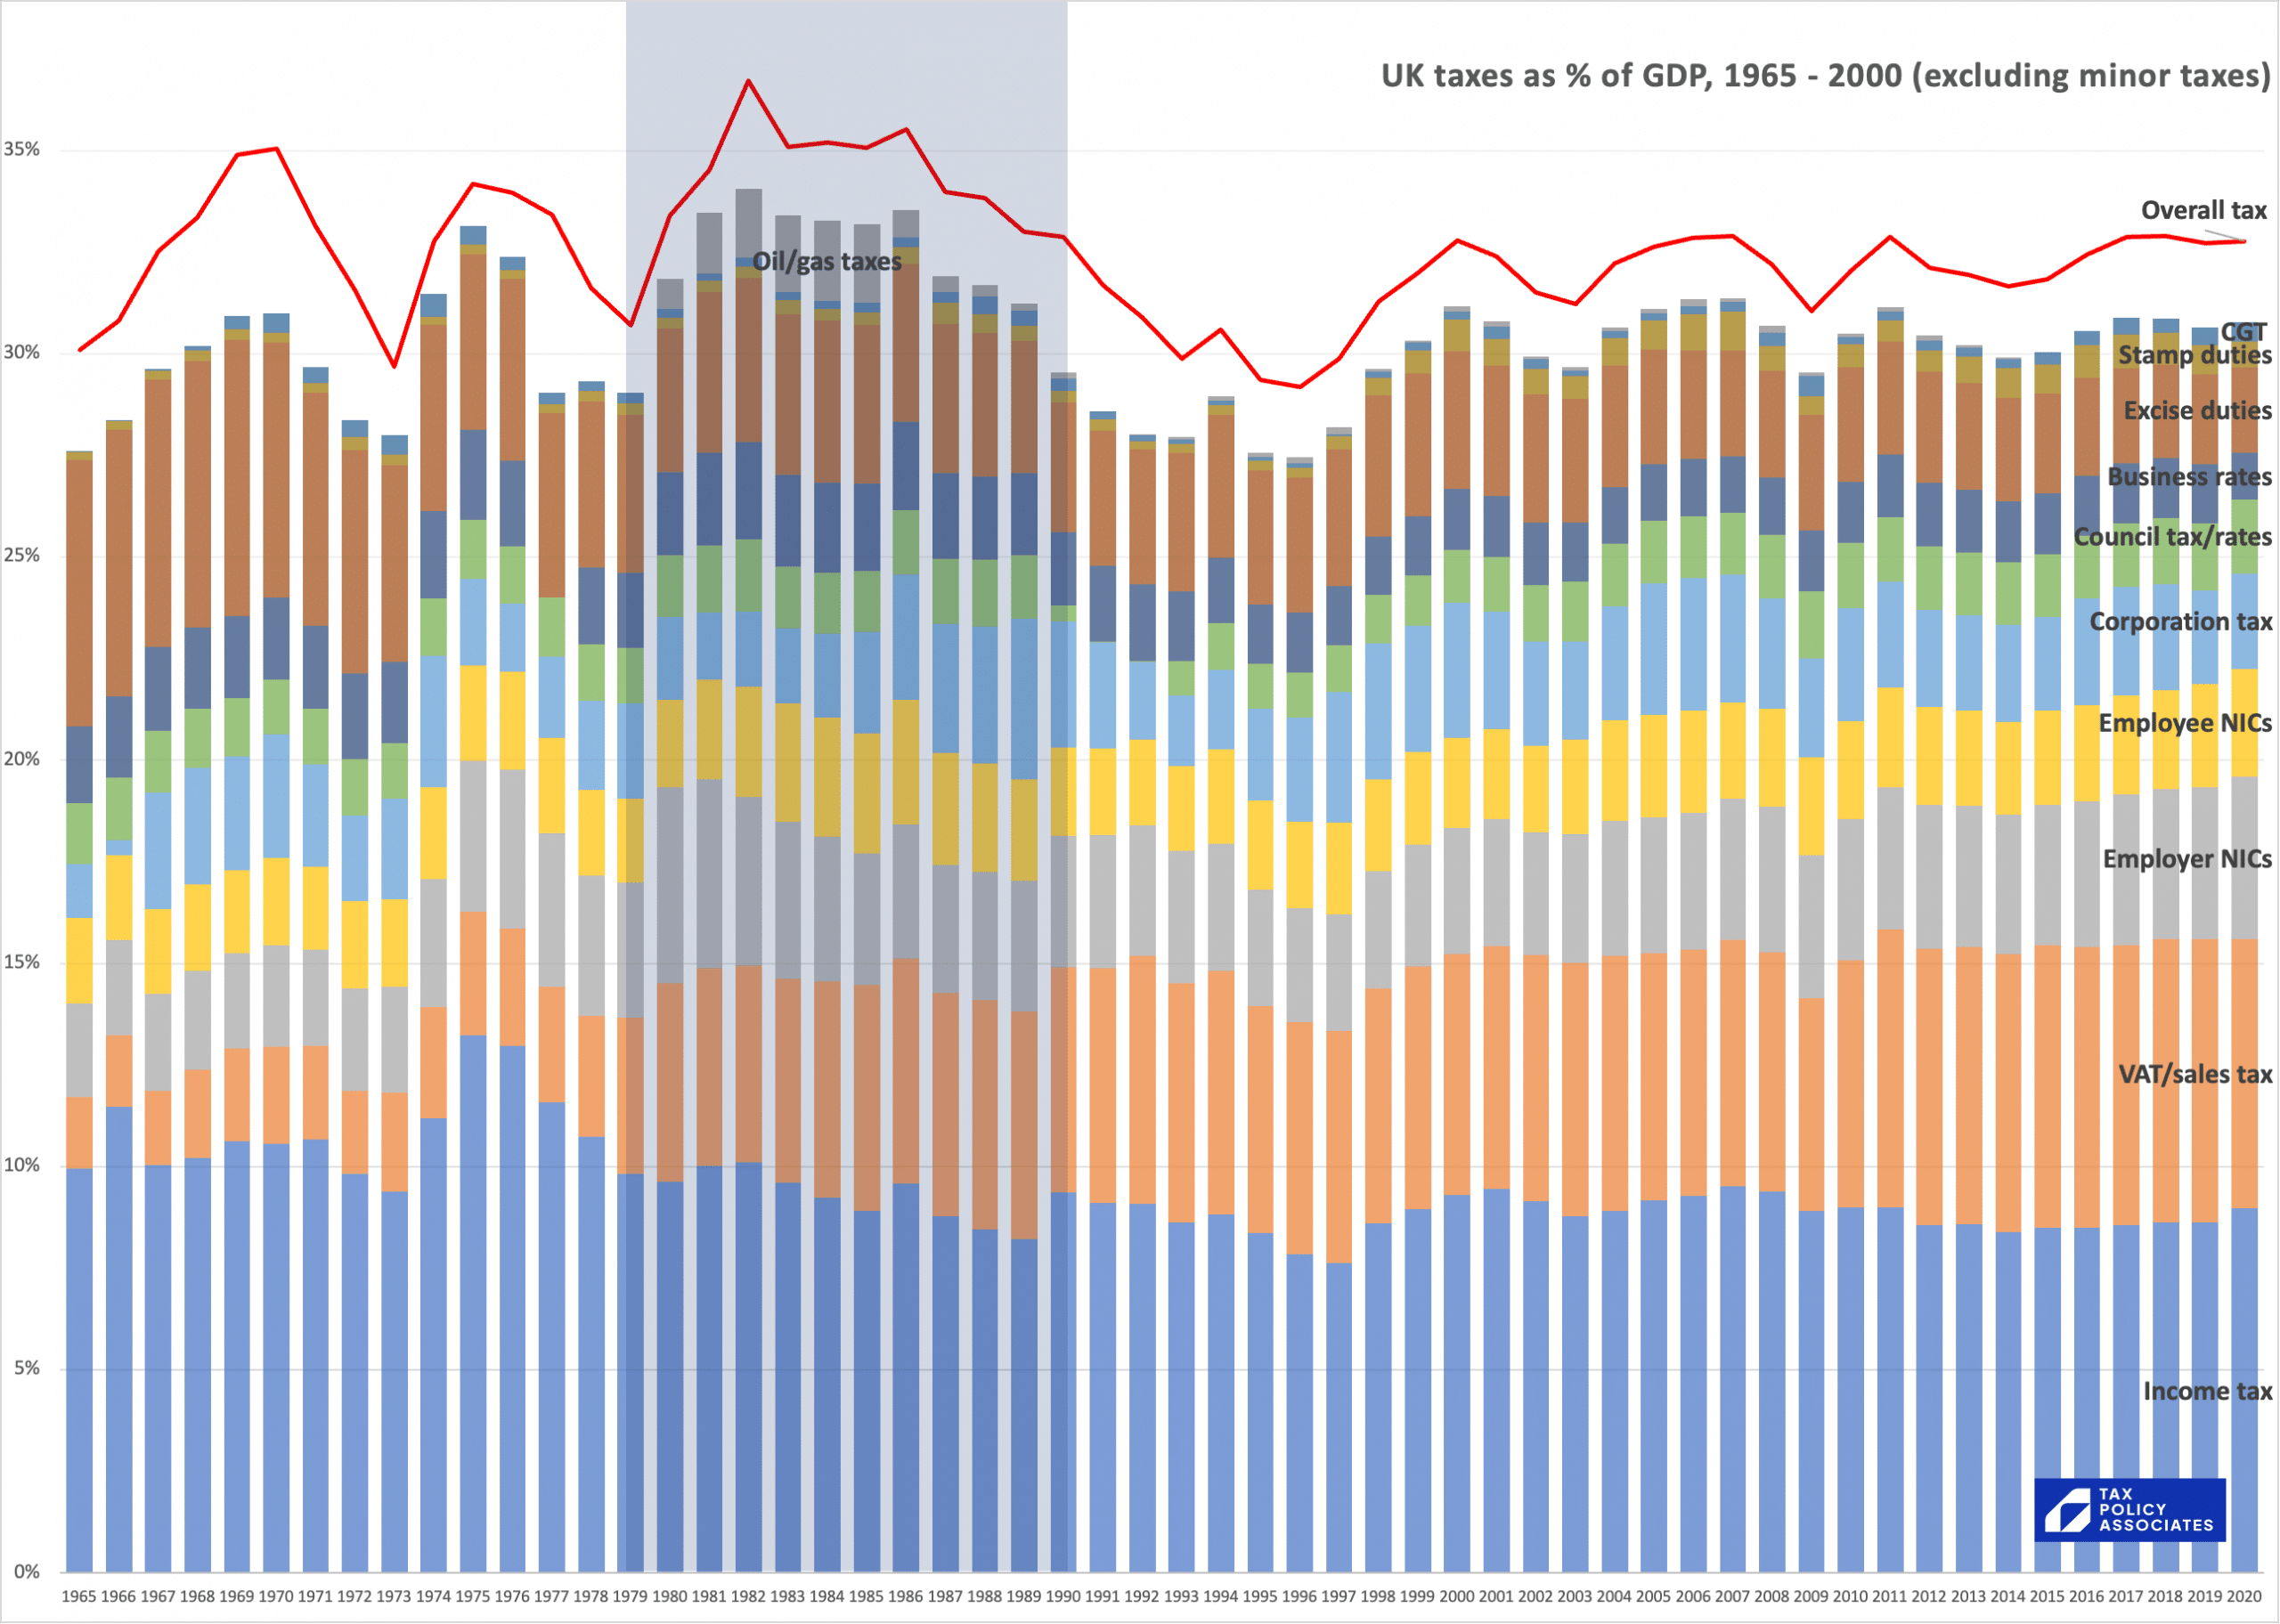
Stacked bar and line chart of UK taxes as a percentage of GDP from 1965 to 2020, highlighting the 1979 to 1990 period: Overall UK taxes rose sharply from around 31% of GDP in 1979 to peak at nearly 37% in 1982, before declining to roughly 33% by 1990. The early 1980s rise was driven by a surge in North Sea oil and gas taxes and an increase in VAT, even as income tax receipts fell.

UK taxes as % of GDP, 1965 - 2000 (excluding minor taxes)

Y-axis: 0%, 5%, 10%, 15%, 20%, 25%, 30%, 35%
X-axis: 1965, 1966, 1967, 1968, 1969, 1970, 1971, 1972, 1973, 1974, 1975, 1976, 1977, 1978, 1979, 1980, 1981, 1982, 1983, 1984, 1985, 1986, 1987, 1988, 1989, 1990, 1991, 1992, 1993, 1994, 1995, 1996, 1997, 1998, 1999, 2000, 2001, 2002, 2003, 2004, 2005, 2006, 2007, 2008, 2009, 2010, 2011, 2012, 2013, 2014, 2015, 2016, 2017, 2018, 2019, 2020

Series and labels:
Overall tax (red line)
CGT
Stamp duties
Oil/gas taxes
Excise duties
Business rates
Council tax/rates
Corporation tax
Employee NICs
Employer NICs
VAT/sales tax
Income tax

Logo: TAX POLICY ASSOCIATES

Now we have it: three drivers for the big tax increase over 1979-82: VAT rising from 10% to 15%, the North Sea oil boom, and the increase in employer NICs. Income tax was certainly cut, although not very dramatically, and that was more than overcome by the increase in VAT.

Seems fair to say that the Thatcher tax increase was an intentional policy-driven rise in tax, not a mere incident of GDP contraction.

All data from the wonderful OECD tax database, with similar taxes consolidated together to produce a reasonable like-for-like comparison across 1965-2020. Full spreadsheet here.
Leave a Reply

Your email address will not be published. Required fields are marked *