
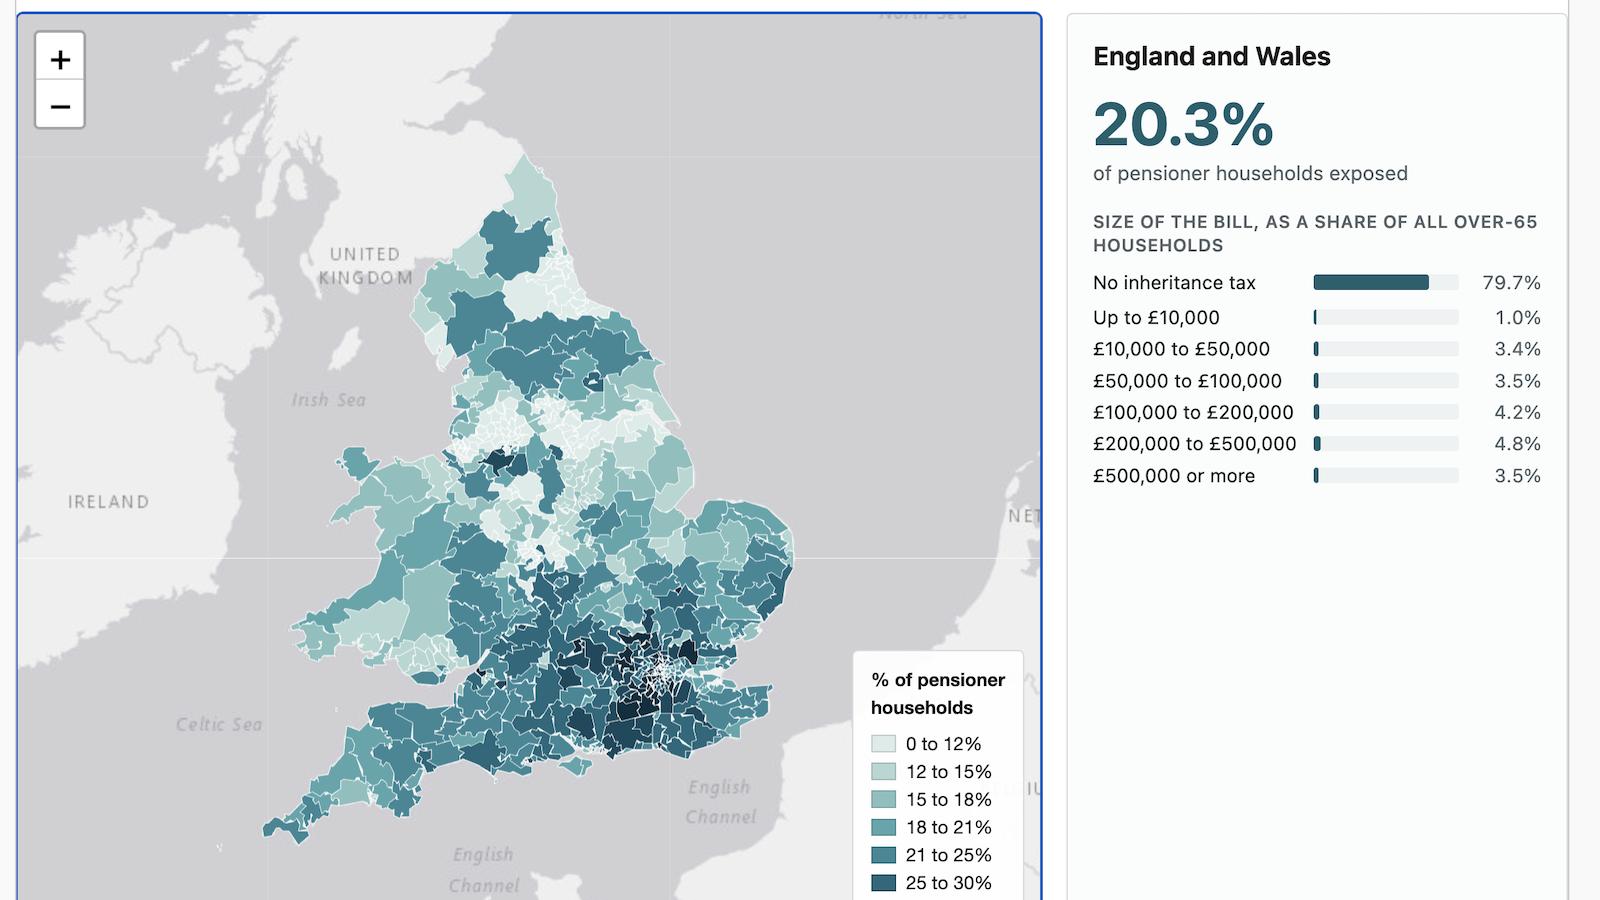
Fewer than 5% of estates currently pay inheritance tax.1 But that statistic counts the dead; if we want to understand why inheritance tax is so unpopular, we should count the living instead. We’ve built a model to do that, across England and Wales and in every Parliamentary constituency.
Our model shows that, by April 2027, 20% of pensioner households in England and Wales will have enough assets to have an inheritance tax liability if the pensioner and any spouse were to die at that point. We think this is a much better measure of the political significance of inheritance tax than the familiar 5% figure.2
The impact becomes clearer if we look at the geographical spread – it rises to 52% in Wimbledon and 46% in Finchley, but falls to around 9% in Durham. We’ve mapped the results across England and Wales – and then tested what might happen at a general election if affected households switched to a party promising to abolish inheritance tax. There’s coverage in The Times here.
What we found
- 20% of pensioner households will be potentially exposed to inheritance tax from April 2027. Far more than the 4.72% of estates that currently pay it. This is not a forecast of eventual liability: it measures how many households have a rational reason to care about the tax today.
- Exposure varies from under 9% to 52%, depending on the constituency. Wimbledon is the most IHT-exposed seat in the country.
- Only about 40% of exposed households are over the line solely because of house price gains. The rest would be taxed even if their home were still worth what they paid for it.
- Liberal Democrat seats are the most exposed on average, with 28.6% of pensioners in Liberal Democrat seats exposed to the tax, ahead of the Conservatives on 23.3% and Labour on 17.6%. This reflects the large Liberal Democrat gains in prosperous southeastern constituencies in the last general election.
- But a promise to abolish inheritance tax may have only limited impact on a general election. Even with generous assumptions about its ability to switch votes, our model finds it produces only about one percentage point of national swing.
This map shows the data, both nationally and in each Parliamentary constituency:
You can view it full screen here, and download the full table here.
The map covers all 575 constituencies in England and Wales – unfortunately the data we rely on doesn’t cover Scotland and Northern Ireland. Details of our methodology are below.3
It’s important to stress exactly what that 20.3% figure is. It is not a forecast of how many households will end up paying inheritance tax. It takes a snapshot of the value of the estates of pensioner households in 2027, and looks at the proportion that are large enough to be within inheritance tax (after accounting for nil rate bands and exemptions). So it’s a psychological measure, not a projection. The percentage who end up actually paying inheritance tax will be smaller (roughly 60%).4 This is what we’d expect. Many of the assets of someone aged 65 will be dissipated before they die, whether as leisure, gifts to children or in care fees. The empirical literature suggests planning is more important than spending – see Margit Schratzenstaller’s 2025 review of behavioural responses to inheritance taxation.[/mfn]
Which constituencies are most exposed to inheritance tax?
Inheritance tax is, and has always been, a deeply political tax.
So it’s instructive to look at the fifty constituencies most exposed to inheritance tax, coloured by the party that won the constituency in 2024. No surprise, it’s mostly London and the Southeast. Some surprise – it’s more Liberal Democrat and Labour than Conservative (reflecting the systemic shifts in support we saw in that election):
And here are the fifty constituencies least exposed to inheritance tax:
The chart looks so flat and uninteresting because, for privacy reasons, HMRC withholds the number of estates in a constituency if there are five or fewer. So we then have to approximate the figures from a constituency’s regional total, deducting the constituencies for which we have precise figures and then sharing the rest between the constituencies with withheld figures. This means we’re unable to see which constituencies are really the lowest – they’re hiding within the flat average of the chart.
Or we can look at the average pensioner exposure to inheritance tax across the whole of each party’s constituencies. Again it’s Liberal Democrat seats which are most exposed:
So no surprise that there isn’t a particularly clear correlation between impacted households and the Conservative vote share:
Or we can split the parties out into a heatmap like this:
What are the assets being taxed?
A common objection to inheritance tax is that it’s double taxation. You earned the money, you paid income tax on it, you saved what was left, and now the state wants 40% of that. A common response is that, actually, most of what’s subject to IHT is the rise in value of the family home, which otherwise goes completely untaxed.
That turns out to be not quite right, and we’ve got this wrong in the past. Around 40% of the pensioner households exposed to inheritance tax are only exposed because of a rise in the value of their home. The other three fifths are not – their estate would be taxed even if they’d received no benefit from house price appreciation.5
Our model runs as at April 2027 because that’s when most unused pension pots fall into the estate for inheritance tax.6 We expected that to move the number of impacted estates significantly; in fact it only moved it from 11.2% of adults to 12.3%. That’s because inheritable pension wealth is a surprisingly small part of what today’s over-65s own: £322bn of defined contribution pots against £5,575bn of property, savings and possessions. The reason is simple. The two big changes in pensions provision have yet to significantly catch up with the current cohort of pensioners.7
Could inheritance tax change an election result?
The Conservative Party have said they’ll abolish inheritance tax when it’s “fiscally responsible” to do so.
A cynic might say they’re doing this because a large number of pensioners are affected in their target seats. Here are the 75 seats the Conservative Party came closest to taking in 2024, in target order, coloured by whoever holds the seat now:8
This is not obvious evidence that inheritance tax is a vote-winning strategy. The average across the 75 is 20.7%, against 20.3% for England and Wales as a whole. The spread is enormous, from Cities of London and Westminster at 48% down to about 10% in Darlington and Middlesbrough South and East Cleveland – the pattern here is there is no pattern at all.
So we built a simple general election model, which switches votes to Conservative where a household is potentially impacted by inheritance tax. You can choose the % of affected voters who switch from other parties, and the % of affected non-voters who now vote Conservative.
The model is very simplistic, and “just a bit of fun“, but we think the result is nevertheless interesting:
The effect of inheritance tax switches is limited. We were surprised by this, given that 20% of pensioners are potentially affected by inheritance tax, and pensioners form the most reliable voting block. The main reason: so many pensioners already vote Conservative.
To be more specific, the Conservatives need about a nine points swing to become the largest party without inheritance tax effects, and around eight with the inheritance tax sliders at what we consider sensible settings (20%, 10%, 5%). So, at best, a promise to abolish inheritance tax is worth 1 point of national swing. This is small, but it is not nothing.
It’s important to note: this is on our assumption – an obviously wrong one – that all voters are selfish. A promise to abolish inheritance tax may attract voters whose estates will never bear inheritance tax. It may also alienate other voters (whether their estates are in scope of IHT or not).
And an obvious caveat: this is calculating the swing from the last general election. It therefore ignores what may, in reality, be a transformed electorate, given the performance of ReformUK and the Green Party.
Methodology – inheritance tax model
All of the code is published on our GitHub.
The method is as follows:
- We start with the ONS Wealth and Assets Survey, round 8: the government’s own survey of what British households own. Fieldwork April 2020 to March 2022, 15,128 households, 7,466 of them with someone aged 65 or over. At this point we lose Northern Ireland, because it’s not included in the survey.
- We identify each relevant household as a unit: one person aged 65 or over living without a partner, or a couple where at least one of them is. 11% of pensioner households have other adults in them as well – this survey doesn’t tell us who owns the wealth but, given the additional adults are usually children, we credit the household’s wealth to the senior members.9 this is a source of error that would tend to overstate the wealth.
- Knock out assets that won’t be part of the estate – defined benefit pensions and annuities.
- Date everything to April 2027. Property comes forward 18.6% on a consistent Great Britain basis, from £234,850 during the fieldwork to £278,518. Savings and pension pots come forward 31.3%, using the ONS consumer prices index.10 We don’t uprate personal possessions at all, because the survey asks what it would cost to replace them, and second-hand furniture and cars don’t follow an index driven by energy and food. They also wear out. All of this is a significant source of error, given the complexity of what happens to money, property and assets over six years. For someone holding just cash, we’ll be overstating their wealth. For someone holding equities, we’ll be understating it.
- It’s been widely noted that the survey misses households at the top of the wealth distribution. We try to repair this by fitting a Pareto tail to the top of the range. We borrow the approach from Advani, Bangham and Leslie. 11 This correction greatly increases the overall tax, but barely moves the percentage of households subject to tax – so it’s not terribly important, given the nature of this project.
- We try to add farms and family companies, but don’t do it very well. The survey’s coverage of business ownership is poor, and it only finds about an eighth of the relief that HMRC identifies. The survey doesn’t identify farmland at all.12 adding both in increases the amount of assets, but in many cases the assets will be relieved from tax. Whilst this is a considerable amount of code, it is of very limited relevance to this project, making almost no difference to the final result (the headline moves from 12.2% of adults to 12.3%).
- At this point, we calculate what happens if the pensioner and spouse die and the estate passes to the next generation (so, if there’s a spouse, the spouse exemption and the transferable bands apply). This is a very simple approach. A more sophisticated approach would be to attempt to model what the future would actually bring for the pensioner and spouse. We could take into account investment growth and spending from now until the actuarial expected date of death, including care costs. That’s difficult, but it’s nothing compared to taking into account the future changes in inheritance tax, which would require us to engage the services of a psychic. So we rejected the more sophisticated approach in part because we didn’t think it could be done in a way that was anything like objective, but mainly because we don’t believe people think like that. We think people think of their assets as a snapshot. As we mentioned above, in all likelihood, their final assets will be significantly less than that snapshot, and so this method overstates the actual tax. This is, again, a psychological exercise, not a prediction exercise.
- The easy bit is working out the tax. £325,000 free of tax each, plus another £175,000 each where a home goes to children or grandchildren, and both bands pass to a surviving spouse. So in most cases £1m for a couple (but of course, that’s a cap, and most people’s assets are nothing like this). 40% on what’s left. We take into account the tapering of the residence band over £2 million and apply business and agricultural relief. The one significant technical rule we don’t model is the downsizing rule, which lets someone who sold up or traded down after July 2015 keep the band they’d otherwise have had. This means we somewhat understate allowances and our headline is a shade too high.
- Our snapshot approach means we’re disregarding decisions as to who receives the legacy. So we just assume (as we think most people do) that everything goes to the children (where there are children) – that maximises use of the nil rate band, which might not happen in reality (so this tends to understates the final tax). We ignore charitable giving, which absolutely does happen in reality (about £4bn across the UK) because, again, we don’t think it’s relevant to “snapshot” thinking. Of course this overstates final tax.
- Gross the survey up to the country, stratifying age bands.
- Add the adult children, because we think they care about inheritance tax as much as their parents do. That takes us from 2.1m households to 12.3% of all British adults, and children are more than half of that figure (of course, it doesn’t change our count of pensioner households). Then adjust for two different types of double counting. A 68-year-old with a liable estate of her own who is also the daughter of a liable 93-year-old must only be counted once (not once on her own account, and then another time when caring about the IHT of her mother). A child whose divorced parents have both re-partnered into liable households must also only be counted once. We stop at children. We could count adult grandchildren, and there are 3.6m of them, but it seems a more questionable choice, and it would introduce further sources of error. So we don’t.
- Push the national answer down to each constituency. HMRC publishes how many estates in each seat actually paid inheritance tax,13 which tells us the shape: where estates are rich and where they aren’t. It can’t tell us the level, because it counts the dead and we’re counting the living. So we take the shape from HMRC and the level from our own model.
- Combine the data. We multiply every household’s wealth by the same factor, re-run the whole tax calculation, and see how many estates that would have generated at death. Then we solve for the factor that reproduces exactly what HMRC recorded in that seat. So Wimbledon needs its households to be about 2.4 times as wealthy as the national sample; Durham needs about 0.6 times. Having found the factor, we measure the share of that seat’s living pensioner households who over the line.
Limitations and caveats
Our model is very much an approximation, albeit we think a useful one. There are numerous limitations and caveats, in particular:
- We are assuming everyone is perfectly rational and selfish. Obviously, that is not true. There are people whose estate will be paying inheritance tax who are content with this, or even happy. There are people whose estate won’t pay inheritance tax who nevertheless deeply dislike the tax – and the evidence suggests there are quite a lot of people like that. It’s often said there are also people who won’t be paying inheritance tax but misunderstand the system and think they do. Our research suggests this is quite a small number. Nevertheless, all of this is ignored by our model, in which everyone is Ayn Rand.
- For privacy reasons, HMRC withholds the estate count for constituencies with a small number of liable estates – that’s 233 of the 573 seats we map (41%). So we have to estimate this from the regional total (i.e. deducting known values from the regional total and then dividing what’s left by the number of withheld results). That’s why the least exposed seats come in flat steps – they share a regional figure. This means we’re not seeing where the really low IHT seats are.
- We repair the survey’s missing top tail above £2m, and that £2m is a point in the wealth distribution rather than a fixed sum of money, so it rises with everything else. Left fixed it would reach further down the distribution every year prices rose, and the repair would grow for reasons unconnected to what the survey actually misses. The choice is worth about £19bn of the latent tax figure, and we’ve made it in the direction that produces the smaller number.
- The survey is four years old, and the the methodology we use to take it to 2027 is as described above: rough and ready. Pension pots and the invested part of savings have beaten consumer prices over these years, which means we understate them. Cash has not, so we overstate it. And elderly people tend to spend money – we ignore that entirely. All complicated by the fact that these were four highly volatile years for markets and prices.
- We ignore historic gifts because we’ve no way of knowing about them, although large recent gifts would be brought right back into the estate. We also ignore tax planning. For example, if an investment portfolio has been moved into AIM stocks, which are often 50% exempt from inheritance tax, then our model cannot know that.
- People whose assets are under the threshold today may rationally worry that their assets will appreciate over time, bringing them within the charge to tax. We don’t take account of that, because attempting to do so requires a large number of assumptions and turns into a very speculative exercise. This will, however, mean that the true number who should be rationally concerned about inheritance tax may be significantly higher than our figure. On the other hand, we also don’t take account of future increases in the nil rate band – it’s been frozen since 2009 but may not be in the future. And we don’t take account of spending. Again, this is a psychological exercise, not a forecasting exercise.
- HMRC’s constituency data is on the old boundaries, so we’ve moved it onto today’s seats using the standard technique of population-weighted areal interpolation, with a crosswalk built from 35,672 small areas.14 This is imperfect, particularly where a new seat draws from several old ones.
- Our calculations assume mortality is the same across the country. It very much is not: a man in the most deprived tenth of England can expect to live 9.7 years less than one in the least deprived tenth, and a woman 7.9 years less.15 That matters here because of how the map is built. We calibrate each seat against the estates HMRC recorded at death, and divide by the people living there now. Where people die younger, a given stock of wealthy pensioners produces more deaths, and so more taxable estates, in any given year. The seat therefore looks wealthier than it is, and we scale its households up to match. So the map flatters poor areas, and the true gap between rich and poor seats is wider than we show.
- Our coverage of farms and family companies is weak, but it makes very little difference to the headline: taking them out of the model altogether moves it from 12.3% of adults to 12.2%. That is because the two corrections nearly cancel. Business assets sit outside the survey’s wealth totals, so adding them adds to estates and pushes the number up; agricultural and business relief then takes most of those estates back out again. The weakness is real, though. The survey asks what a business is worth but never asks whether land is farmed, and its answers are badly wrong: measured against the relief HMRC actually gives, the survey finds about an eighth of the value. So we take who owns what from the survey and what it’s worth from HMRC’s published distribution of claims,16 which is imputation rather than measurement. CenTax have done this properly using HMRC’s own administrative data, and anyone interested in the area should read their work rather than ours.
- We don’t take account of inheritance tax planning, and in particular, we don’t take account of lifetime gifting. CenTax have shown how widely effective rates vary between estates of the same size. None of that variation is in our model – but that’s fine because we’re showing how many people care about inheritance tax, not how much people end up paying.
- We assume family size has nothing to do with wealth, which isn’t quite true.
- ONS deaths by marital status stop at 2019, and that may have changed.
Corrections and challenges are welcome – the code is on our GitHub.
Verification
We verified the tax calculation by running it against 14 worked examples: the £1m for a couple, the taper above £2m, the £650,000 for people with no children, and the new cap on agricultural and business relief.
We checked the aggregate wealth figures that emerge from the model against the ONS’s own summaries of the its survey (at the survey’s own prices so we compare with apples with apples). The model produces median estate of £217,100 for single pensioners against the ONS’s £206,500, and £395,000 for couples against the ONS’s against £423,100 for couples. That’s acceptable given the highly approximate nature of the exercise.
How this compares with other people’s work
We took our inspiration from the 2023 IFS paper by Arun Advani and David Sturrock. They used the same Wealth and Assets Survey, projected it forward on the OBR’s asset price assumptions, assumed people run their wealth down as they age, applied ONS mortality rates by age and sex, and asked how many people would have inheritance tax falling due on their own or their spouse’s death. Their answer was one in eight by 2032-33.
That is a different figure from ours (12.3% of adults, or 20.3% of pensioner households) because it’s measuring something different. The IFS number is an estimate of the % of people actually dying in one future year whose estates will be subject to inheritance tax.
We are more interested in the politics than the distribution of inheritance tax – we’re trying to work out how many people rationally care about the tax. So our figure is a share of households alive in April 2027, looking at whether their assets at that point would (if they died immediately) be subject to inheritance tax. We’ve also added the adult children, as, realistically, they will most often bear the economic incidence of the tax.
As we also noted above, our valuation of farms and family businesses is highly incomplete. The analysis from CenTax does this properly, based on HMRC’s actual estate returns.
However, there are other figures in this area that are created primarily for reasons of PR and are not particularly meaningful. Several published “inheritance tax hotspot” analyses take the average house price in a local authority, add a pension pot estimated from median local earnings, and compare the total against £325,000, or £500,000 where a home passes to children. The most widely reported of them concludes that the pension change pulls 152 more local authorities into inheritance tax.17 The problem with this is that an average is a very different thing from an IHT estate. Wealth is not evenly distributed, and an average can increase without the number of estates above the threshold changing very much, or perhaps at all. More serious than that statistical failure is that this survey uses the simple single-person £325k threshold, when the most common case is a married couple with £1m between them.
Methodology – electoral model
This is an extremely simple model, and election modelling is very much not our expertise. We apologise to actual subject matter experts.
- Start with the 2024 result in every seat, from Parliament’s own Members API.
- Apply the national swing. Add a % to the Conservative share in every seat where they stood, taken off the other parties in proportion to how each did there.
- Count the exposed pensioners. Our model says how many households in a seat would face a bill, and households do not vote, so we only count the pensioner and their partner.
- If the user wishes, we add in their children, because we assume they’d care just as much about inheritance tax. That is a defensible position. Completely indefensible is assuming the children live in the same constituency as their parents, but we have to make that assumption because there’s no other easy way to do it. It’s for this reason. This is an option rather than a default.
- Work out how the pensioners voted. Ipsos has over-65s voting Conservative 43% in 2024 against 23.7% across the country, so the Conservatives do about 1.8 times as well among pensioners as they do overall. The same source gives us turnout by age, which we use in the next step. We apply that ratio to the seat’s own result, and normalise back to 100%.
- The “include children” switch it is off to begin with, because turning it on means assuming they live in their parents’ constituency, and for a great many of them that is simply untrue. We couldn’t think of an easy way to fix this, so we gave up and let you choose between the two unrealistic scenarios: assuming children’s vote isn’t swayed by inheritance tax, and assuming it is, but children never move away from their parents. If the switch is on, we find the children’s age profile from the model’s own fertility table, which is built from ONS cohort fertility by mother’s year of birth. About two thirds of them are aged 35 to 54; none are aged 16 or 17. We take that age profile and weight the Ipsos post-election figures for turnout and vote share by it. This will be wrong because we’re inferring their politics from their age alone, and the children of wealthy parents are likely more Conservative than their age group as a whole. So this factor may overstate the effect of inheritance tax on younger voters (i.e. because some of the relevant voters are already voting Tory).
- Switch votes according to the second slider and the sensitivity threshold. The threshold decides who counts as affected: a household is in the pool only if its potential bill is at least that share of what it owns. Of the people in the pool, we take off the ones already voting Conservative and the ones who didn’t vote, and the slider sets what percentage of the rest switch. Their old votes come off the other parties in proportion to how well each did in that seat.
- Activate non-voters according to the third slider and the same threshold. The slider is capped at 20%, which is twice the largest net increase in turnout any recent general election has produced among an age group. Ipsos puts turnout among over-65s at 73%, so we treat 27% of the exposed pensioners in each seat as non-voters. That is a national figure applied to every seat, which is certainly wrong. Turnout varies by and by wealth, and it varies with wealth in the same direction as exposure, so the pensioners in our pool are probably likelier to vote than the average over-65… our approach may therefore (slightly counter-intuitively) overstate how many spare non-voters there are and therefore overstate the impact of inheritance tax on non-voters.
Thanks most of all to Arun Advani and David Sturrock for their 2023 paper.
Many thanks to G and C for help with modelling and coding, and to B for their review.
Election results from the UK Parliament Members API. Map: constituency boundaries © Office for National Statistics, Crown copyright and database right 2024. Base map © Esri. Built with Leaflet. Postcode search by postcodes.io. Estimates by Tax Policy Associates.

Badenoch’s inheritance tax cut could cost £11bn – almost twice the advertised price
England’s new tourist tax: what it raises, who pays, and what it costs
What would a land value tax actually do?
What if Andy Burnham lowered the mansion tax threshold to £1.5m?
Has Britain run out of “other people” to tax?
The UK has 90 different taxes. France has 348. Germany has 60. Why?
Footnotes
HMRC inheritance tax statistics put it at 4.72% of deaths in 2023-24, which is 30,400 estates paying £7.03bn. See Table 12.1, published 30 July 2026. ↩︎
We’re not the first to think the current estate share is the wrong measure. The Institute for Fiscal Studies published a paper in 2023 which found that one person in eight would have inheritance tax falling due on their own or their spouse’s death by 2032-33. Arun Advani and David Sturrock, Reforming inheritance tax, IFS Green Budget, September 2023. Their datasource is the same as ours, but they calculate the % of deaths liable to tax and we calculate the % of live pensioners who could expect to be liable to tax. Our approach is heavily inspired by and borrows from their work. ↩︎
HMRC does publish the Scottish constituency counts, but the population series we divide them by covers England and Wales only. Northern Ireland is outside the model entirely, because the wealth survey we rely upon doesn’t cover Northern Ireland. ↩︎
We came up with that figure by running our model over a year of deaths and comparing it against what HMRC actually collected, with everything valued at 2023-24 prices so that the comparison isn’t partly measuring inflation. It produces about 1.60 times as many taxpaying estates as HMRC records (42,400 against a comparable HMRC figure of 26,500 for the over-65s in Great Britain). ↩︎
this is a simple calculation looking at nominal gains. If instead we look at real gains, then only 29% of pensioner households exposed IHT are so exposed because of hour price appreciation. ↩︎
Finance Act 2026. See HMRC’s technical note on inheritance tax and pensions. ↩︎
Most people in this age group have a defined benefit pension, or bought an annuity – neither of those is an asset anyone can inherit. We expect this to change significantly over the long term, given that, for example, most 55-year-olds don’t have a defined benefit pension and won’t be required to buy an annuity when they retire. This is why the IFS concluded in 2022 that this change would have “very little effect”. HMRC figures are here, but they measure something very different to us and so are not directly comparable. ↩︎
Full methodology below. This is a simple electoral model. Our IHT model doesn’t have the data for Northern Ireland and Scotland (and the Conservatives don’t stand in Northern Ireland anyway), the only slider that changes these seats is the first one. ↩︎
70% are the household’s own sons and daughters, 12% are a parent or parent-in-law, and only 3.7% are unrelated to anybody there. ↩︎
We take the average across the two years of fieldwork and carry it to April 2027 using the UK House Price Index (property) or consumer prices (ONS series D7BT) (savings and pensions). ↩︎
“The UK’s wealth distribution and characteristics of high-wealth households”, Fiscal Studies 42 (2021), 397-430. They estimate missing wealth at roughly £800bn, about half the Sunday Times Rich List wealth the survey never sees, and about half the statistical correction itself. ↩︎
HMRC tables 12.2b and 12.2c, 2023-24. ↩︎
HMRC, inheritance tax liabilities statistics, table 12.9, which gives taxpaying estates by parliamentary constituency for 2023-24. ↩︎
We take the population-weighted centroid of every 2021 lower layer super output area from the ONS Open Geography Portal, work out which old seat and which new seat each one falls in, and weight each old seat’s estimate by its share of the new seat’s population aged 65 and over. ↩︎
ONS, Health state life expectancies by national deprivation deciles, England: 2018 to 2020. ↩︎
HMRC, inheritance tax liabilities statistics, tables 12.2b and 12.2c for 2023-24. That distribution is a year’s worth of claims at death, spread across the living stock of owners, which is a stretch and is the main reason we’d treat our farm numbers as indicative rather than measured. ↩︎
The Private Office, Inheritance Tax hotspots after 2027 pension changes, based on average property prices by local authority in November 2025. ↩︎


Leave a Reply