

The Conservatives propose exempting family homes from inheritance tax and increasing the tax-free allowance to £500,000 per person. They say this would cost £6bn a year. Our analysis suggests £7.6bn to £10.8bn,1, once we account for the incentive to hold on to homes and move other wealth into housing.
The problem is that the proposal gives wealthy pensioners a powerful reason to buy bigger houses. If you sell investments, and put the money into your home, then your children could save 40p in tax for every £1 you spend. If you downsize, on the other hand, every £1 of house value you sell could increase IHT by 40p.
These effects are substantial. We estimate the proposal could shift £60bn–£110bn from savings and investments into housing and reduce the number of £1m-plus homes coming onto the market in London and the South East by 3%–6% each year. Around 90% of the tax cut would go to the wealthiest fifth of pensioner households.
The Conservative Party recognised the importance of these kind of effects when they published their “The Right Way” document before their conference:
“Tax policy should therefore be judged not only by how much money it raises, but by what it encourages and discourages. As far as possible, people should make decisions because they are economically worthwhile, not because the tax system favours one thing over another.“
For £7.6bn, we could instead raise the tax-free allowance to £900,000 per person or cut the inheritance tax rate from 40% to about 18%. Either would be a better way to cut inheritance tax, without giving people a tax incentive to buy bigger houses or stay in homes they would otherwise sell.
But if the priority is growth, then inheritance tax is the wrong tax to cut.
The analysis in this report is built on the inheritance tax model we developed to show the proportion of pensioner households potentially impacted by IHT. We set out our methodology below, and the code is published on our GitHub, for anyone to check.
What does the Conservative Party propose?
Today, the inheritance “nil rate band” is £325,000 – if your estate is less than this, there is no inheritance tax. There is a complex additional “residence nil rate band” of up to £175,000 for a qualifying home left to direct descendants, which tapers away for estates above £2m.
The Conservatives are proposing two changes:
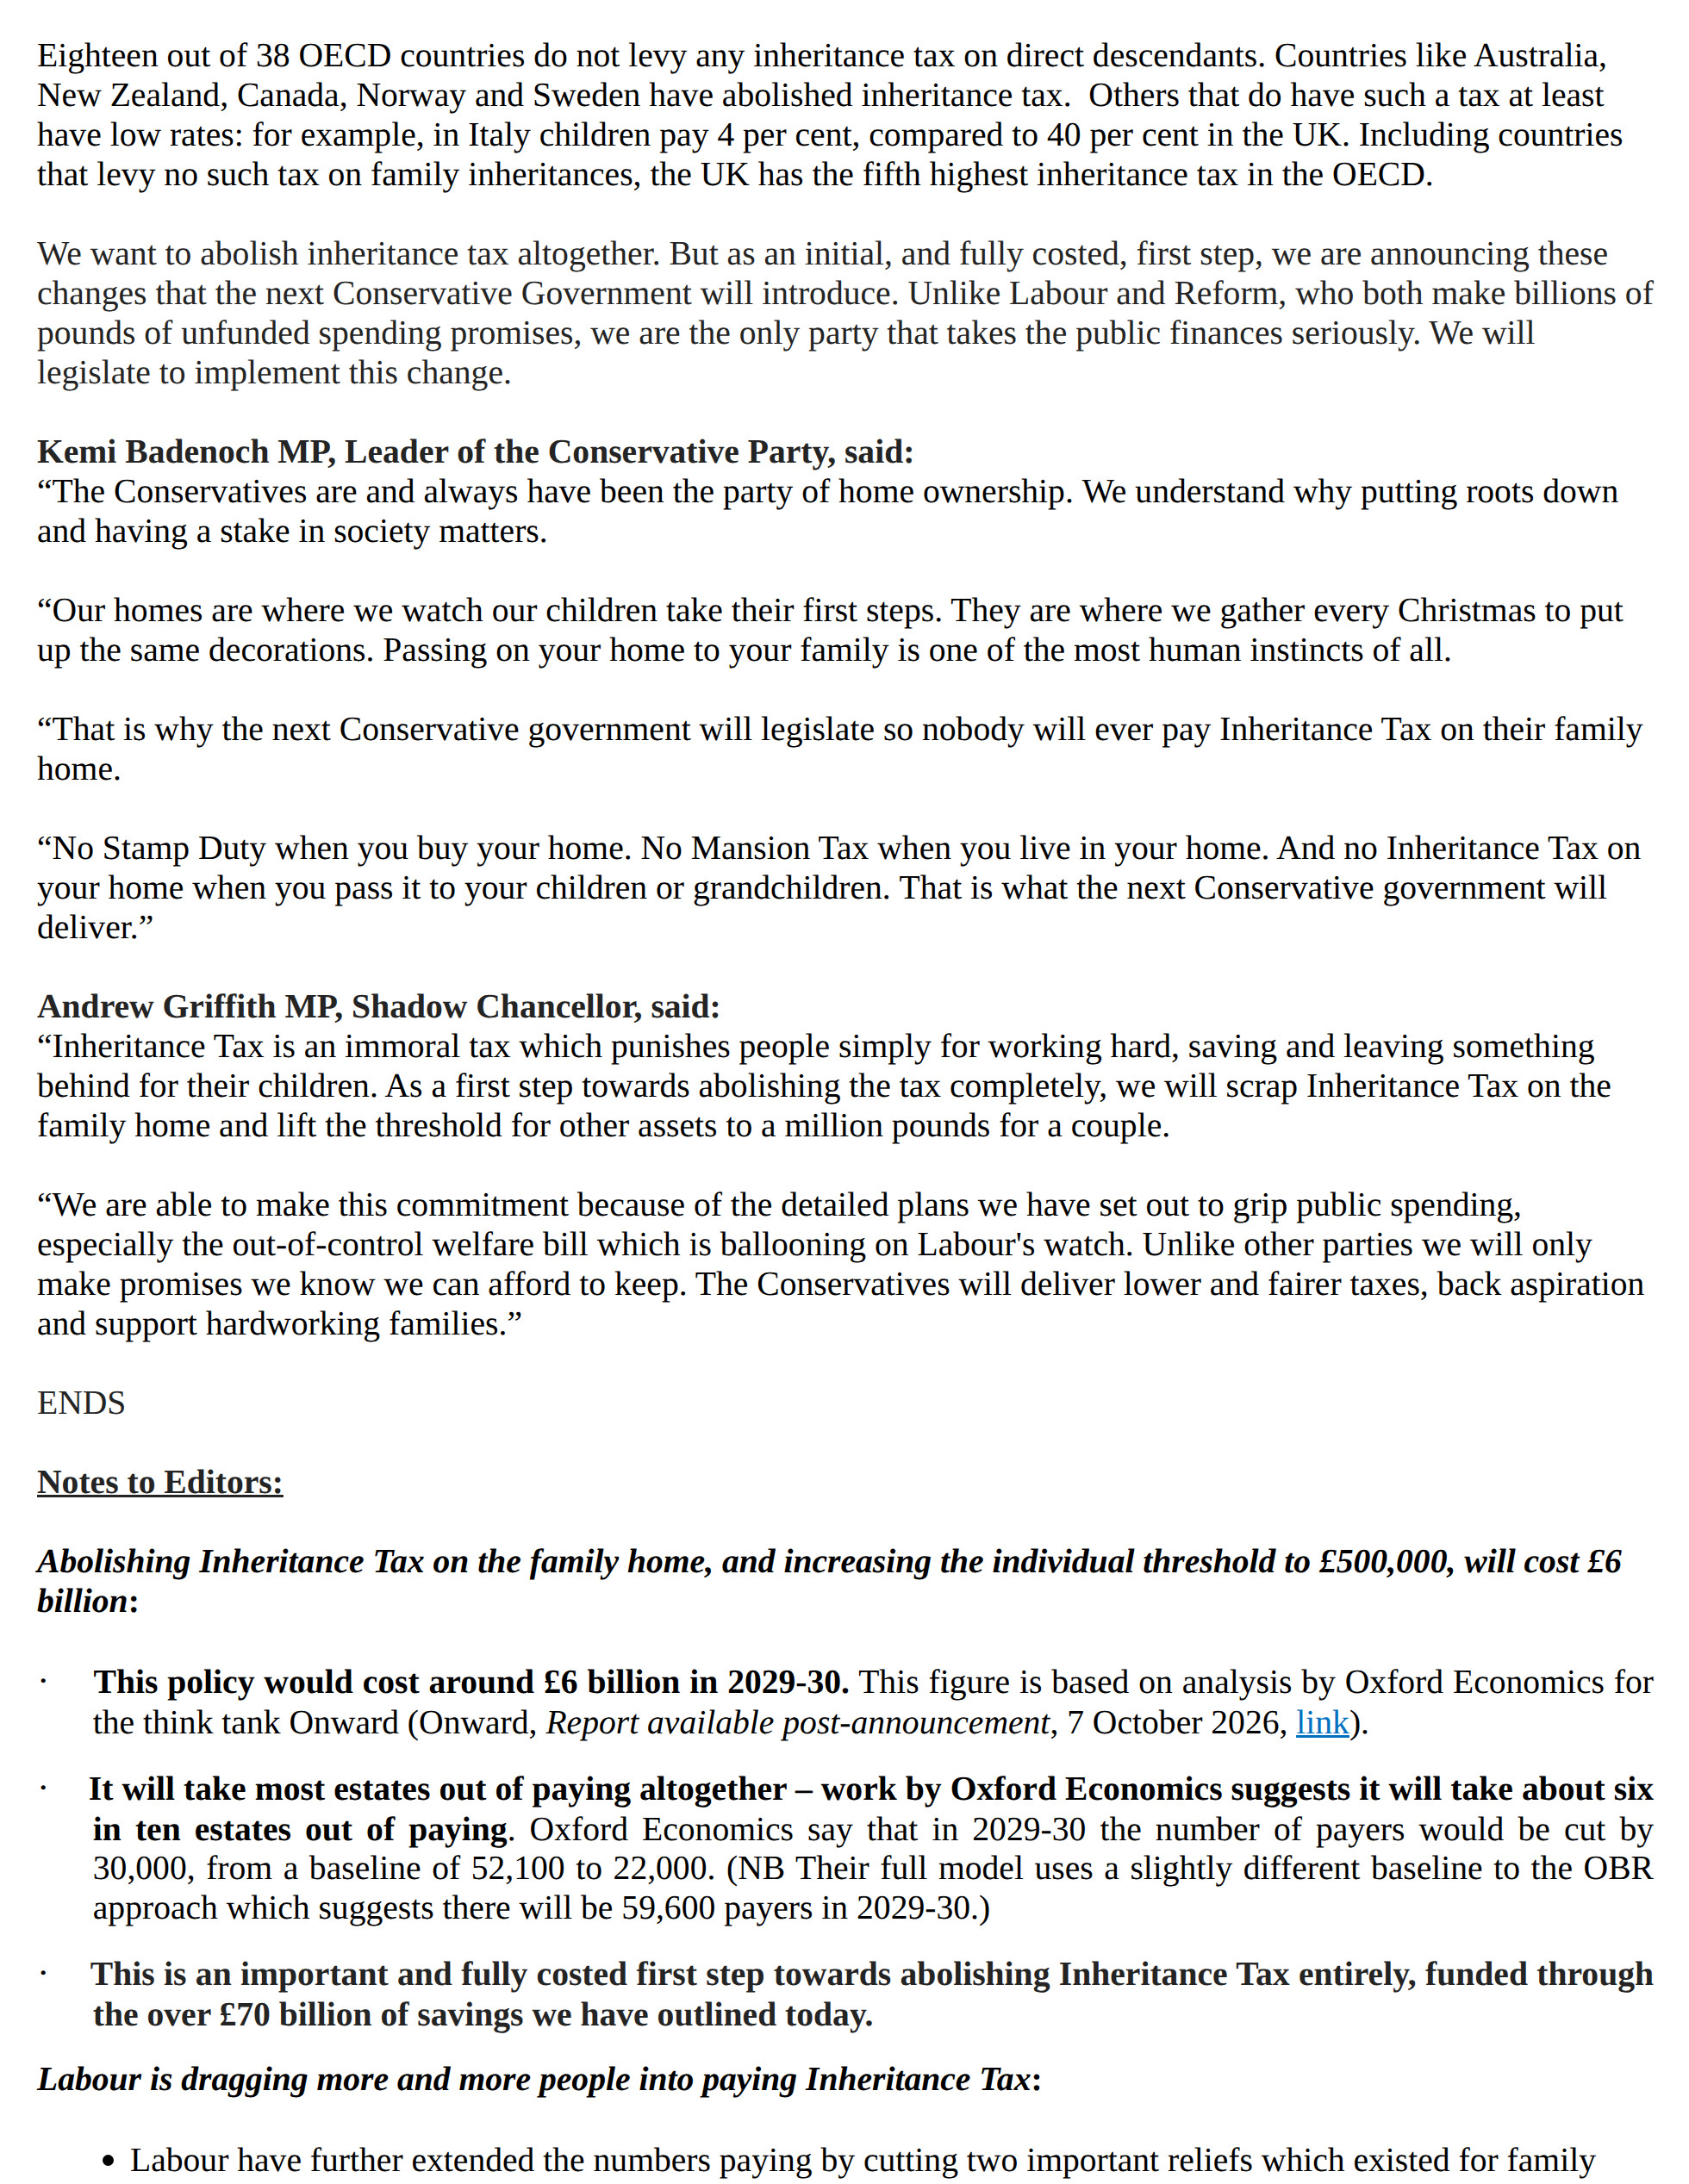
First, replacing the £325k and £175k with one simple £500,000 nil rate band – £1m per married couple.
Second, no inheritance tax at all on a main home passed to children or grandchildren, with (it seems) no cap on the value.
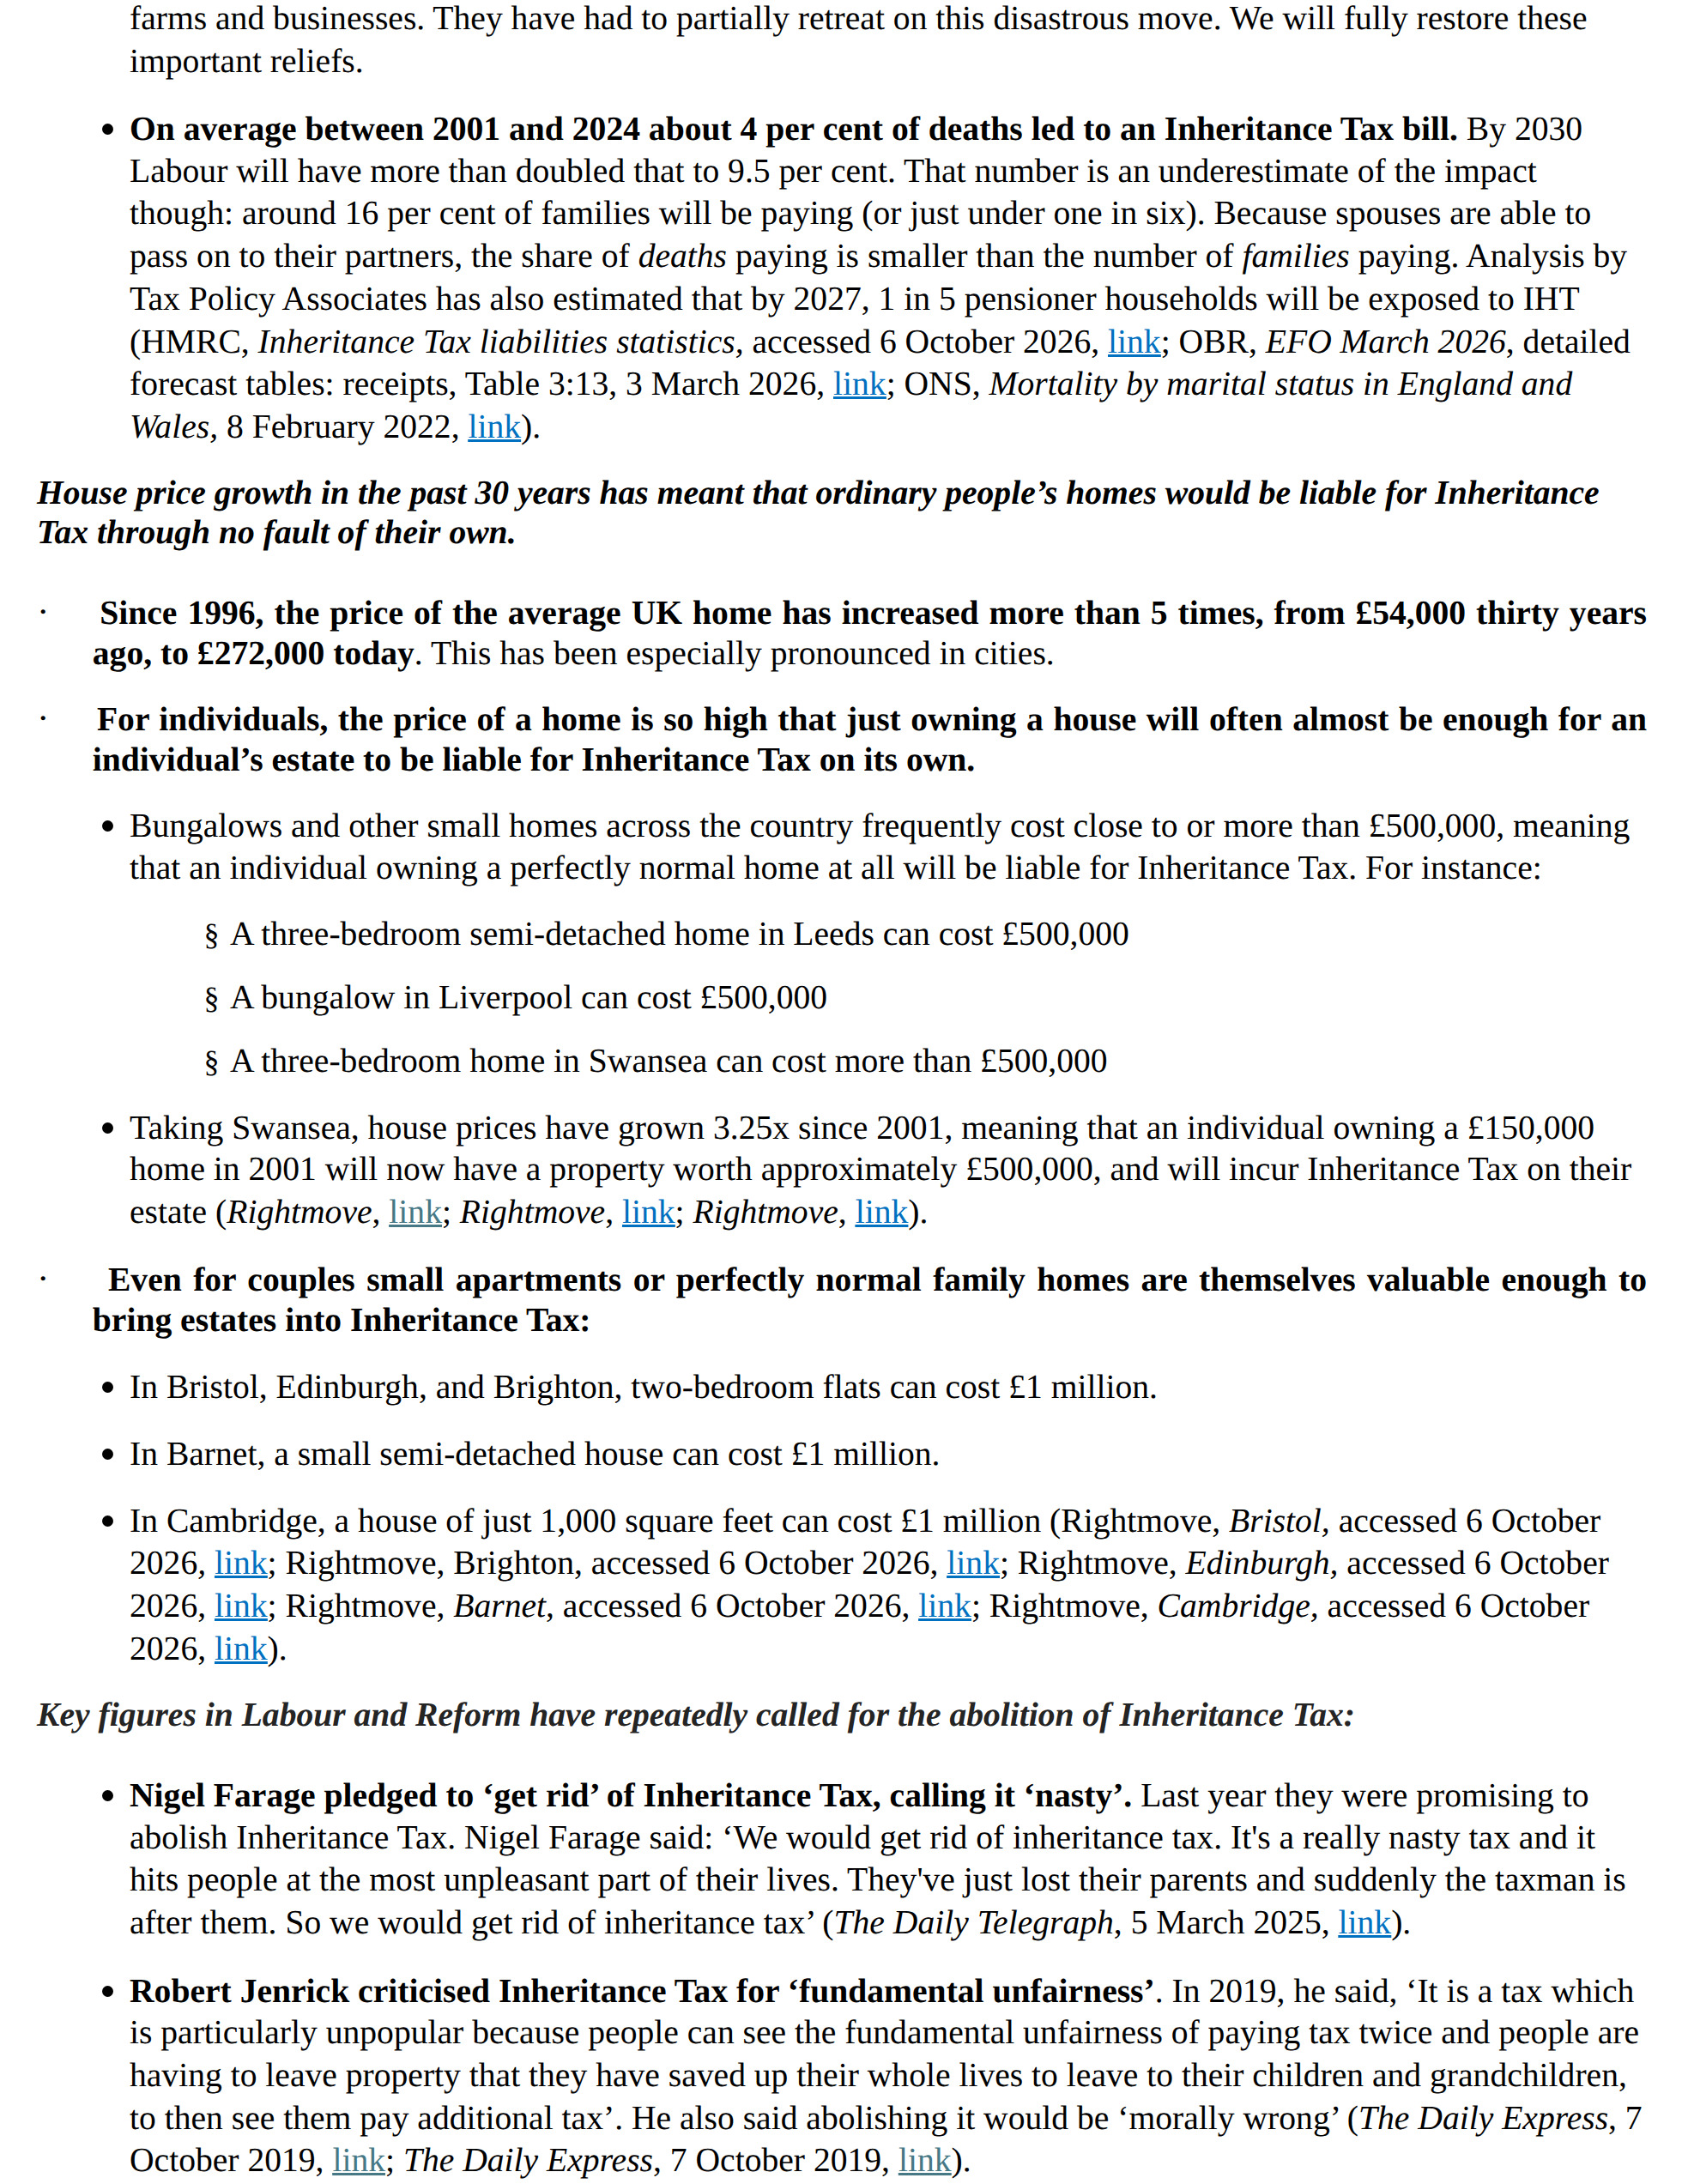
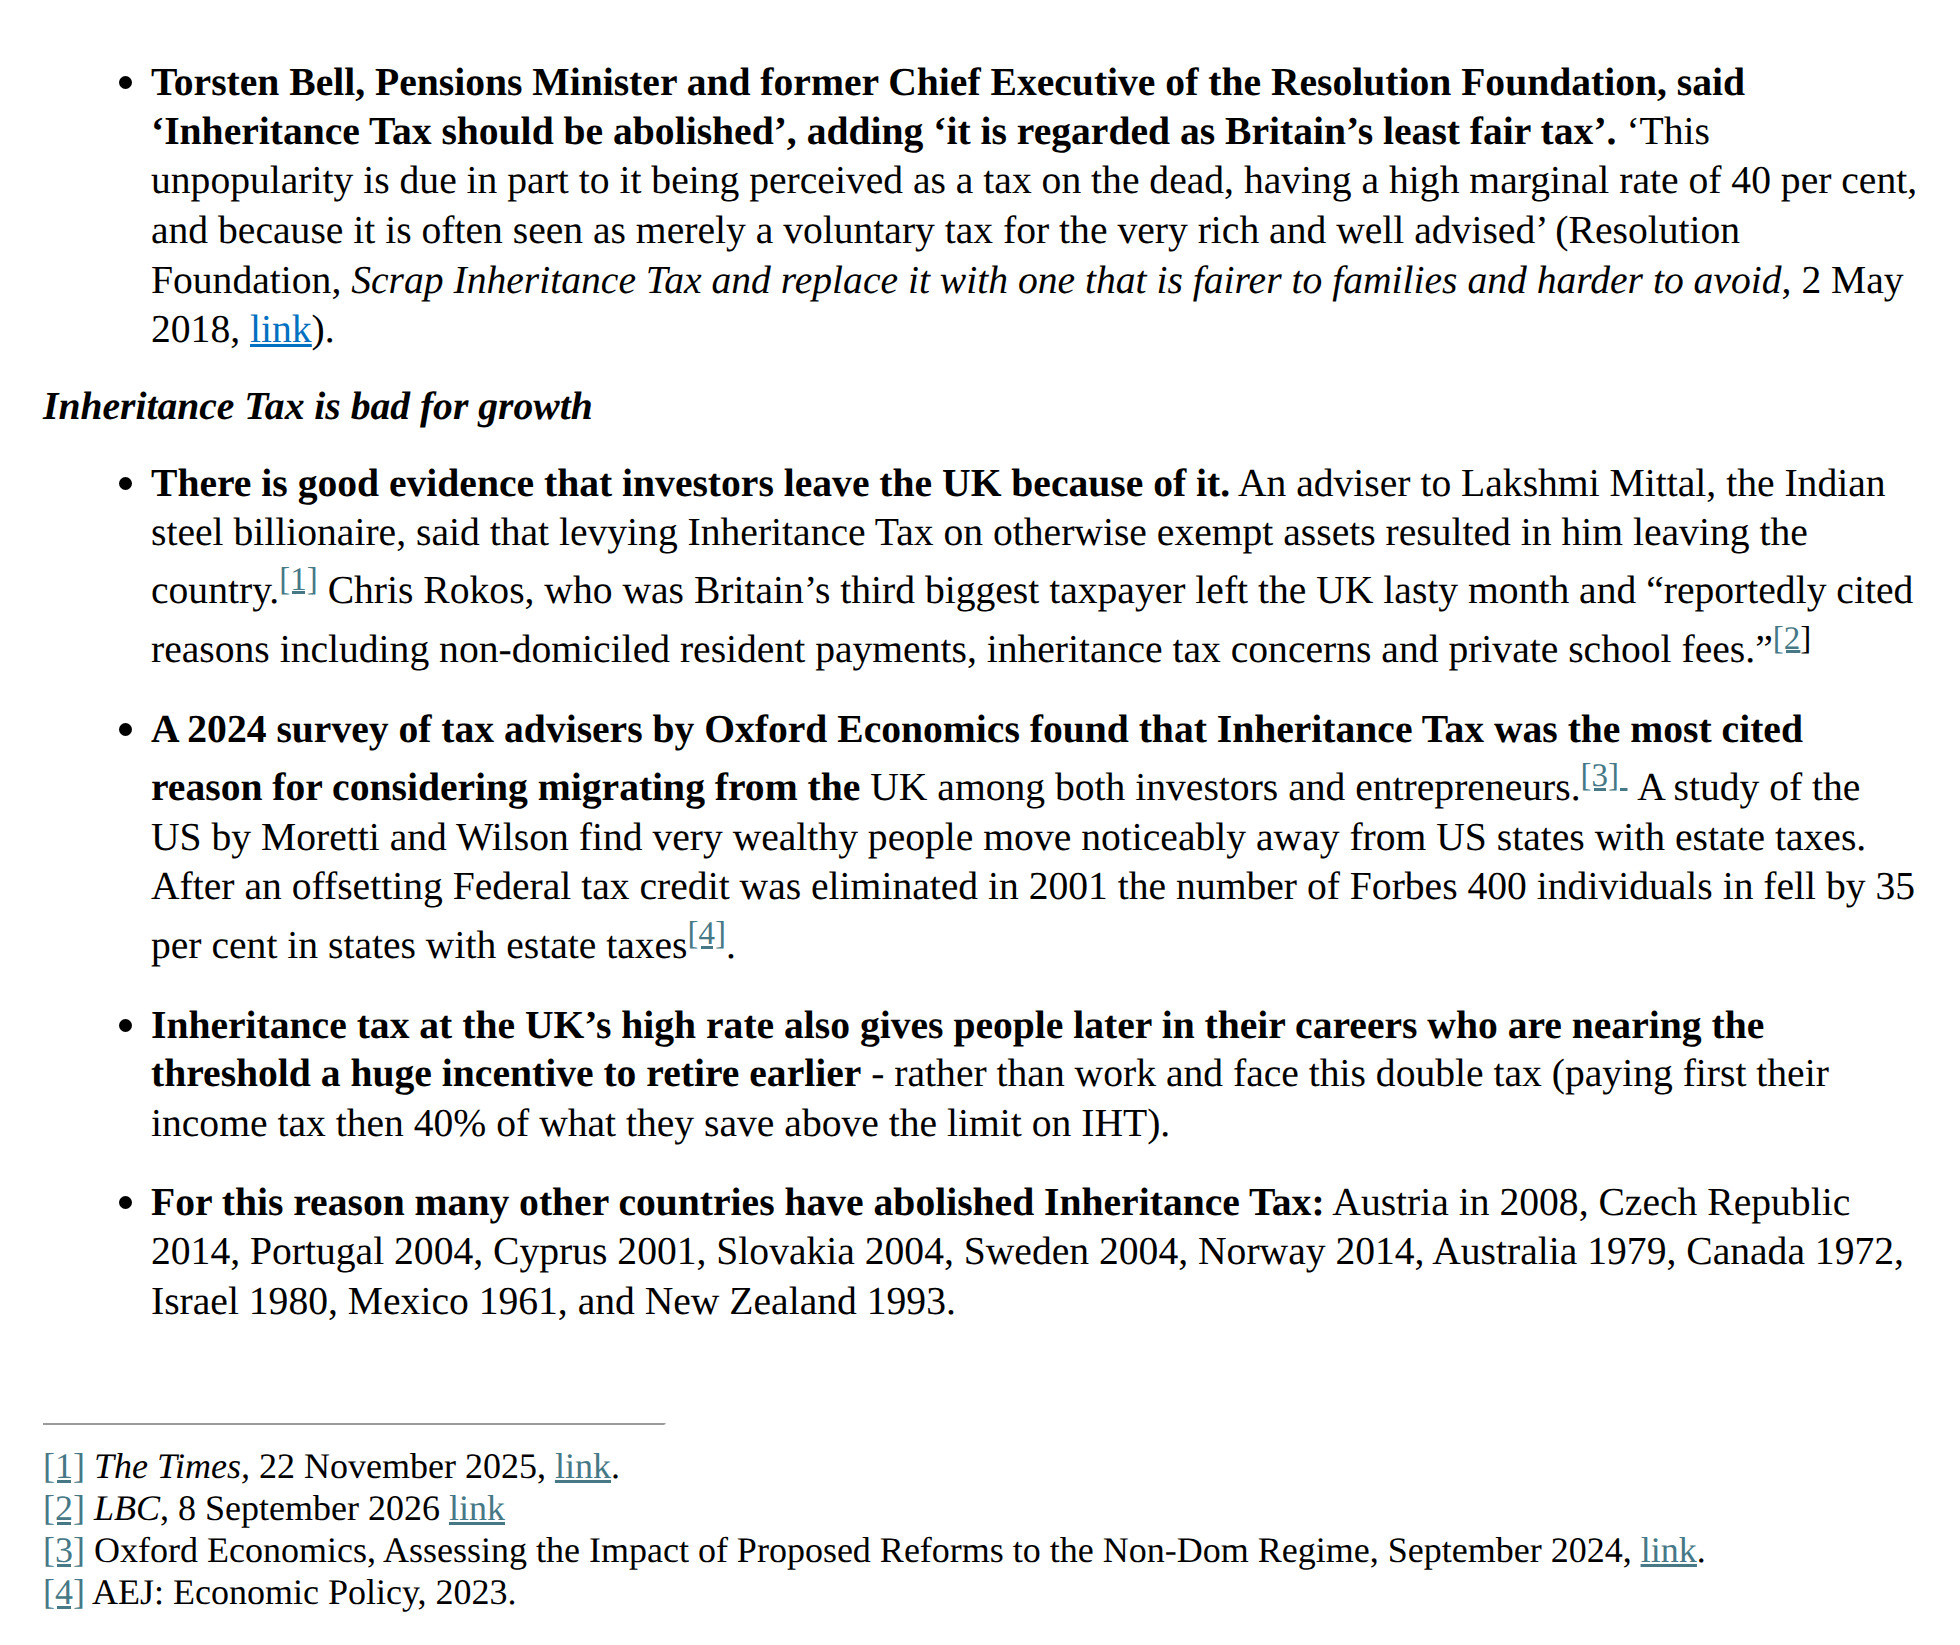
Kemi Badenoch described the policy as “a first step” towards abolishing the tax altogether. Here’s the official press release:
Who benefits?
Our model suggests that 90% of the tax cut goes to the richest 20% of pensioner households, and 40% to the richest 5%, whose estates are worth £1.75m or more.2
Unsurprisingly, most of the benefit goes to London and the South East. Those two regions have a quarter of Britain’s pensioner households but receive 70% of the benefit.3
What does the Conservative Party say it would cost?
“Around £6 billion in 2029-30”, based on modelling by Oxford Economics for the think tank Onward, which also says the number of taxable estates would fall from 52,100 to 22,000.4
The Conservatives say this would be funded from the £70bn of spending cuts they announced at the same time.
What do we think the cost would be?
When estimating the impact of a tax increase or tax cut there are usually two components. First, a static estimate, which assumes nobody changes their behaviour. Second, a dynamic estimate which attempts to build in taxpayers’ behavioural response.
We built our estimate like this:
| Component | Lower estimate | Upper estimate |
|---|---|---|
| Static cost: no change in behaviour | £7.0bn | £9.0bn |
| Keeping homes that would otherwise be sold | £0.25bn | £0.70bn |
| Fewer people downsizing | £0.15bn | £0.50bn |
| Moving savings and investments into homes | £0.30bn | £0.60bn |
| Less tax avoidance: revenue recovered | −£0.12bn | −£0.02bn |
| Total annual cost, rounded | £7.6bn | £10.8bn |
Our methodology is summarised in this section, then set out in detail in the full methodology description below.
Static estimate
We’ve costed the proposal using two approaches. Both give a higher static cost than the Conservative Party’s £6bn figure.5
The OBR forecasts inheritance tax receipts of £13.7bn in 2029-30.6 Applying our estimates to that forecast gives a static cost of £7bn to £9bn.
Dynamic effects – lock-in
Most tax changes cause taxpayers to change their behaviour in some way. Usually these effects are small. In this case, we should expect a substantial effect, because the proposal is economically equivalent to a 40% charge on an elderly person selling their house.
Today, selling a £2m house and moving to a £1m flat won’t change your children’s inheritance tax bill. The estate is the same size.7 Under the Conservatives’ proposal, the £2m house was exempt from IHT, the £1m flat continues to be, but the £1m you released is fully subject to IHT.
Your house move cost your heirs £400,000.8 People are going to respond to an incentive this large. We estimate that fewer people downsizing would reduce annual IHT receipts by £150m to £500m on the 2029-30 receipts scale.9 There is a separate incentive to retain homes that would otherwise be sold without buying a replacement, so the house itself passes to the heirs instead of potentially taxable sale proceeds. We estimate that effect at another £250m to £700m a year on the same basis, assuming the retained home still qualifies for the exemption.
All of which suggests that these two effects increase the cost of the measure by somewhere between £400m and £1.2bn on the 2029-30 receipts scale.
Dynamic effects – upsizing
The proposal also gives people a reason to move their assets into housing – to “upsize”.
We doubt people would buy enormous houses they won’t use – we’d see behavioural changes at the margin. So, for example, an older person looking to relocate nearer their children could acquire a more expensive property than they would have done (not necessarily a larger one). An older person owning property with unused land could build an annex rather than (say) investing into securities.
If, for example, someone with a £2m house and £10m of financial investments sells £5m of investments and buys a £7m house, that potentially moves £5m out of the taxable estate and saves £2m of inheritance tax.10 People may also borrow against investments rather than selling them – particularly attractive where assets would give rise to a capital gain.11
There’s strong evidence that people shift wealth into tax-exempt assets. When Spain exempted owner-managers’ shares from wealth tax in 1994, exempt stock went from 15% to 77% of the total within eight years (see Alvaredo and Saez); business property relief on AIM shares built a £6bn industry in Britain; and in Japan, where residential land is heavily favoured, the elderly hold real estate until death and a 2015 tightening of IHT valuation rules set off a boom in apartment building for tax reasons.12
This history suggests we should expect a significant shift. 13 If eligible homeowners moved 7.5% to 15% of their financial wealth into their main residences, the remaining inheritance tax would fall by about 6% to 12%. On the OBR’s 2029-30 receipts scale, that is an additional annual cost of about £0.3bn to £0.6bn. A 30% shift would cost about £1.1bn.
Dynamic effects – less avoidance
There is an effect in the other direction. If inheritance tax bills become smaller, then there’s less of an incentive to engage in tax planning. Meaning more inheritance tax could be collected than the simple static estimate suggests. Oxford Economics includes this effect in its £6bn costing (but frustratingly doesn’t separate the effect out from its static estimate).
The question is how large this effect would be. There are three categories of estates:
- People currently engaging in IHT planning who wouldn’t need to after the Conservative’s proposed reforms come in, because they’d be paying no IHT even with no planning. That’s a reduction in planning, but it doesn’t boost IHT revenue.
- People currently engaging in IHT planning who still would need to after the reforms, because the new exemptions don’t fully cover them, and they pay 40% IHT on their post-exemption assets. The Conservatives’ proposal gives these people no incentive to reduce tax planning.
- People who still pay IHT on their post-exemption assets, but the marginal rate drops because of the reforms. About 5% of the estates still paying tax would be in this position, because of the personal allowance taper, but it’s a small effect – boosting IHT revenues by c£20m to c£70m.
There could be another effect even where the marginal rate stays at 40%. A smaller bill can make paying for tax planning less worthwhile. The effect is real, but small – likely less than £50m.
Our detailed reasoning is in the methodology section below, but ultimately we believe dynamic effects are only going to have a small positive impact on the costing of this proposal.14
The wider impact
Given the large incentive the proposal creates to shift money from investments into housing, it’s going to have a wider impact. We’re tax people, not economists, so we’re not going to try to estimate the economic impact or the effect on the housing market, but we can estimate the number of homes and value of investment affected. The workings are in the methodology section.
The impact on the housing market
Our model says that, under the Conservative proposal, about 1.5m pensioner households in Great Britain would face an inheritance tax penalty if they sold their home and kept the cash. For 900,000 of them, the penalty would be more than £100,000. And 840,000 would face a penalty just for moving to a home worth half as much, with a typical bill of around £95,000.
That translates into two effects. First, homes that are sold today before their owner dies would instead be held until death: we estimate 1,000 to 3,000 a year. Second, fewer pensioners would downsize. Our rough estimate is 2,300 to 4,000 fewer downsizing moves a year. The first effect is about 50% bigger in tax terms.
Put together, that’s perhaps 3,300 to 7,000 fewer homes coming onto the market each year, against about 1.1m to 1.2m residential sales across the UK.15 That’s under 1%, so as a raw number pretty small… but these aren’t typical homes. Almost half the households facing a downsizing penalty are in London and the South East, and nearly two thirds of those are worth £750,000 or more.
So the more relevant figure is that there would be a 3% to 6% decline in £1m-plus homes going on the market in London and the South East each year.
The impact on savings and investments?
About 460,000 pensioner homeowners would still face an inheritance tax bill after the reform, and between them they hold about £780bn of savings and investments. Every pound of that moved into a bigger house, a renovation or an extension saves 40p of tax.
On the scenario we use above, where 7.5% to 15% of that money moves into homes within five years, that’s £60bn to £110bn shifted out of pensioner households’ financial assets and into housing, or roughly £125,000 to £245,000 per household. That’s somewhere between 3% and 6% of all the financial wealth held by pensioner households.16
These figures are high, but should be seen in the context of a large wider market for inheritance tax products.
Farmland held by passive investors is probably worth something like £15bn to £50bn and, given the low yield of farmland, it is reasonable to expect that most of this is motivated by IHT planning.17 Private woodland in the UK is worth something like £27bn to £42bn at today’s prices.18 We don’t know how much of that is held for inheritance tax reasons, but our sources in the private wealth world tell us it’s a significant amount. That’s validated by pricing – woodland sells for 2.6 to 3.7 times what the national accounts say its timber is worth, which suggests something other than forestry is driving the market.19 About £6bn was invested in AIM portfolios run for inheritance tax purposes before AIM relief was cut to 50% in April 2026.20 Alongside that is a market in unquoted “business relief” schemes, and Octopus’s Inheritance Tax Service alone holds around £3bn.21
What if the money was spent on a simple IHT cut?
If a government really did want to spend £7.6bn a year cutting inheritance tax, there are two simpler ways to do it, neither of which distorts the housing or investment market.
The first is to scrap the residence nil rate band, with all of its complexities, and simply increase the ordinary nil rate band. £7.6bn would take the nil rate band from £325,000 to about £900,000 per person, so £1.8m for a married couple.22 This would make the family home IHT-exempt for the vast majority of people.
The second is to keep the system exactly as it is and cut the rate. £7.6bn would take inheritance tax from 40% to about 18%.23 This would be a significant benefit for the very wealthy, but that can be viewed as a feature – inheritance tax is currently a significant push factor for the wealthy, particularly those who are internationally mobile.
Both of these seem a better use of the money.
Would there be wider economic benefits?
The Conservatives’ press release says inheritance tax is “bad for growth”. The evidence doesn’t support that.
The OECD’s 2021 review of the research concluded that:
“While the number of studies is limited, the empirical literature generally suggests that inheritance taxes tend to have more limited effects on savings than other taxes levied on wealthy taxpayers, and confirms their positive effects on heirs’ labour supply“
In other words, people receiving large inheritances tend to work less, and so a smaller inheritance tax will, at the margin, reduce the incentive to work.24
The Conservative Party’s press release mentions wealthy people emigrating because of inheritance tax on their worldwide assets. That’s a real issue, and there are changes to the non-dom rules that could deal with it. But the family home is of limited importance to this group. If the aim is to stop inheritance tax pushing wealthy people out of the UK, then the answer is to abolish the tax or lower the rate.
How does it compare with other tax cuts?
We like to assess tax cuts by the “bang for the buck”: the amount of GDP growth each pound of tax cut creates. Here’s our rough and ready estimate for sixteen tax cuts, with the family home exemption highlighted:25
If growth is the priority, it’s hard to justify deploying £7bn+ on an inheritance tax cut.
Methodology
This section sets out the workings behind the figures above: the two static estimates, each of the dynamic effects, the housing and investment figures, and why our numbers differ from Oxford Economics’. The code is on our GitHub.
Our baseline, and Oxford Economics’, is current inheritance tax. So neither of us are taking into account other possible changes that could be made first. The Conservatives say they’ll reverse Labour’s APR and BPR changes. We tested if taking this into account changed our results – the difference was negligible. That’s unsurprising because the two measures relieve different assets.
Static estimate – two approaches
Our model of pensioner households, built from the ONS Wealth and Assets Survey, implies that the proposal removes about two thirds of inheritance tax revenue. An estimate built from HMRC’s published estate tables says about half: 50% to 53%. Oxford Economics’ estimate is 48%, including its behavioural adjustment. We don’t know which of our two static estimates is more accurate. HMRC’s tables accurately describe estates at death but are a historical snapshot and lose the detail within each band. The survey has known inaccuracies, and describes living households (not estates at death) – so extrapolation is required to produce figures for estates.
Static estimate – our model
We used the model behind our report on pensioner households, where the methodology is set out in full.
We take every household in the Wealth and Assets Survey with a member aged 65 or over, value their estate in April 2027 money, apply the inheritance tax rules in full (nil-rate bands, the residence band and its taper, the spouse exemption, agricultural and business reliefs, and pension pots from April 2027), and turn the stock of households into a year of deaths using ONS mortality rates.
We then run a backtest against 2023/24, for which we know the actual tax outcome. Using that year’s prices and tax rules, the model predicts about 60% more taxpaying estates and 45% more tax than HMRC records for the comparable population. Some of this may reflect survey error or our modelling assumptions. But most of it is likely because the survey measures living households rather than estates at death. Wealthier people tend to have lower mortality rates, so applying average mortality rates can overstate how many wealthy people die each year.26 Spending, gifts and additional tax planning before death could also reduce the tax ultimately payable. But unfortunately the data we have available doesn’t let us separate these effects or establish their relative importance.
To estimate the reform’s cost, we therefore take the percentage reduction in tax predicted by our model and apply it to the OBR’s forecast of inheritance tax receipts. This adjusts for the overall level of tax the model predicts. It assumes, however, that the model’s errors affect tax before and after the reform in the same proportion. If we disproportionately overestimate tax on estates benefiting from the reform, we will still overestimate its cost; if the error is concentrated elsewhere, we could underestimate it. We don’t know which is the case.
Removing the main home from estates where there are children or grandchildren, abolishing the residence band and setting the nil-rate band at £500,000 cuts modelled tax by 66% under 2023-24 rules and 64% under the 2027-28 rules with pension pots in estates. The number of taxpaying estates falls by about three quarters. We tested possible valuation errors: marking homes down by 5% and financial wealth up by 25% takes the 2023-24 cost share to 60%; homes down 10% and financial wealth up 50% takes it to 55%. These are sensitivity assumptions, not estimates of the survey’s errors.
We also tested different asset drawdowns. Applying annual reductions of 1% to the main home, 3% to financial assets and 5% to pension pots for ten years brings the model’s count of taxpaying estates to within 20% of HMRC’s and raises the cost share to 67% (those rates are taken from Oxford Economics, but this is a simplified stress test, not a replication). Pension changes don’t affect the tax calculation in this test because it uses 2023-24 rules. If we reduce homes by a fifth while holding other assets fixed then that takes the cost share to 59%.
Sensitivity to the survey round
The Wealth and Assets Survey is collected in two-yearly “rounds”. Round 7 covered April 2018 to March 2020; Round 8 covered April 2020 to March 2022. We used Round 8 because it’s the most recent available. Projecting household wealth forwards is a highly uncertain and error-prone process, and it’s undesirable to add another two years’ projections.
Round 8 has recognised quality problems because it was conducted during the pandemic, when response rates fell and interviews moved from face-to-face to telephone. Its accredited status has been suspended.27 So there’s a choice to be made between accepting those problems (and therefore more uncertain base data) and using older data (and therefore more uncertain projected data). We chose the newer survey, and those are the figures presented in the body of this report.
After the first version of this report was published, we ran a sensitivity analysis using Round 7, keeping the model assumptions and tax rules the same and bringing both surveys’ asset values to a common price basis. The survey-based static estimate falls from about £8.7bn to £8.0bn on the same 2029/30 receipts scale. That’s a material reduction, but still within our £7bn to £9bn static range.28
The estimated numbers of households facing an incentive to retain their home or avoid downsizing are almost unchanged whichever Round is used.29
However, the back-test gets substantially worse using Round 7. Modelled tax liabilities are 62% above the comparable HMRC outturn, against 45% using Round 8. Round 7 performs slightly better on the number of taxable estates, but that doesn’t resolve the discrepancy.30 This finding is specific to this application and doesn’t mean Round 7 is generally less reliable than Round 8; it may mean it’s less reliable for our application. This finding provides some support for our decision to use Round 8 for this report, quite aside from the additional uncertainty involved in projecting older data forward by a further two years.
Static estimate – HMRC data
HMRC’s table 12.3b gives, for each band of tax liability in 2023-24, the number of taxpaying estates, how many owned UK residential property, and its value. Existing residence relief should then be deducted from the extra exemption. Our simulation varies tax bills and home values within each band. It assumes 80% of estates have qualifying descendants,31 42% have a transferred band32 and the main home is 85% to 100% of HMRC’s residential category. We then approximate the residence-band taper by tax-liability band. That gives a home-only cost of 27% to 31% of revenue, a threshold-only cost of 14% to 15%, and a package cost of 50% to 53%. If we vary the descendant and transferred-band assumptions, that gives 48% to 53% for the package.
Dynamic effects – overall scope
We chose to focus our downsizing calculation on homeowners aged 65 or over because they are the most obviously affected by inheritance tax incentives, and 65 is a frequent cutoff band in official statistics. But of course, in reality, incentives do not suddenly start at age 65 – the incentive would also affect younger households expecting an inheritance tax bill. Plausibly, such households have a smaller incentive but more opportunities to act (e.g., at the margins, buying more expensive homes).
Whilst our analysis is occasionally informed by data on slightly younger households, in the main it is not. This choice means our dynamic effects are lower than they would be if we looked at a wider age range, but we haven’t conducted a sensitivity analysis to see quite how much lower.
Dynamic effects – lock-in
The data shows that significant numbers of people currently sell their houses as they age. 20% of taxpaying estates of people aged 85 and over don’t include a house. See HMRC table 12.5c, 2023-24: 12,300 of the 15,600 taxpaying estates aged 85 and over contained UK residential property. The figure is only 10% for those aged 65 to 74. And if we look at living households of the same age and wealth in the Wealth and Assets Survey, 97% own their home. Under the Conservatives’ proposal, most of those families would have been better off, often by hundreds of thousands of pounds, if the house had been kept (provided there were children to leave it to, and it still counted as the main residence).
The best evidence on how strongly a tax on selling suppresses sales is American: Shan (2008, published 2011) finds each $10,000 of capital gains tax saved by not selling cut the sale rate by 7% to 13%. Cunningham and Engelhardt (2008), discussed by Shan, find that the 1997 removal of the age-55 restriction raised moves among homeowners aged 52 to 54 by 22% to 31%. The reform replaced the old reliefs with a new capital gains exemption; it didn’t abolish the tax.
The penalty here is 40% of the equity released, typically £50,000 to £200,000.33 The historical inputs are for 2023-24; we scale revenue amounts to 2029-30 by (£13.7bn / £7.03bn). If every taxpaying estate aged 65-plus that holds no house had kept one worth the average for its age band, the potentially sheltered wealth would be £2.9bn a year. We approximate their tax bills using HMRC’s distribution of estates without residential property across tax-liability bands. We then assume 80% have qualifying descendants and 42% have a transferred band, as in our static HMRC calculation. Finally, we apply the new £500,000 bands and cap each saving at the remaining tax bill.
This reduces the tax at risk to about £260m to £440m before behavioural responses, allowing for none or all of the eligible estates having claimed existing downsizing relief. At this level of wealth care fees are paid from savings, so these sales will generally be a choice rather than a necessity. Under the proposal there would be a six-figure reason not to make that choice.
If we assume 50% to 80% of eligible households reverse that choice, it would mean £130m to £350m of IHT is sheltered on the 2023-24 basis, or about £250m to £700m on the 2029-30 receipts scale.
Dynamic effects – downsizing
About 30,000 to 50,000 older owners in England downsize each year, releasing £4bn to £7bn34; a fifth to a quarter of that would remain taxable after the new allowances,35 and half to 70% is still there at death,36 so if the incentive halved downsizing numbers then that shelters £75m to £245m of tax each year on the 2023-24 basis. Multiplying by (£13.7bn / £7.03bn) gives about £150m to £500m on the 2029-30 receipts scale.
Dynamic effects – upsizing, and the shift out of savings and investments
From our model, under the Conservative proposal: households with a member aged 65 or over, owning their home and weighted by the chance they have children or grandchildren, whose estate would still be taxable if they died today. Their financial wealth (cash, savings accounts, ISAs, shares, bonds and investment funds) totals £775bn, and their combined taxable excess over the thresholds is £734bn. For comparison, all households with a member aged 65 or over hold about £1.8tn of financial wealth on the same basis. The model includes our correction for the survey’s under-coverage of the very wealthy, so the top of these totals is partly a statistical reconstruction.
We apply the 7.5% and 15% to each household’s financial wealth, but cap the amount moved at the household’s taxable excess: there’s no tax reason to move more than that. The result is £57bn at 7.5% (about £125,000 per household) and £113bn at 15% (about £245,000). A 30% shift would be £219bn.
Dynamic effects – less avoidance
The current residence allowance tapers away above £2m, creating an effective marginal rate of 60% for some estates. Removing that taper reduces the rate to 40%. So people in this position would have a weakened incentive to tax-plan. We rebuilt the calculation around those marginal rates. With an assumed responsiveness of 0.2, it recovers about £45m a year on the 2029-30 receipts scale. Varying that assumption from 0.1 to 0.3 gives about £20m to £70m. We held the home and business assets fixed and allowed ordinary non-housing wealth to respond with a constant elasticity to the share of an additional pound retained after tax. A fall from 60% to 40% raised that share from 0.4 to 0.6; at an elasticity of 0.2, responsive wealth rises by (0.6/0.4)^0.2 minus 1, or 8.45%. We solved the new tax schedule including the £500,000 threshold, so an estate initially outside tax cannot keep a 0% incentive after crossing into the 40% band. We then recalculated each estate’s liability. The £45m is the resulting revenue increase divided by modelled baseline tax and multiplied by £13.7bn. Restricting the response to financial wealth gives £34m. These calculations exclude fixed planning costs, income effects, migration and changes in gifts that the survey does not observe.
If an arrangement costs £10,000 and saves 20% of the potential tax bill, it makes sense when the bill is £100,000 but not when it’s £30,000. Someone who would previously have paid for the arrangement might now decide to pay the tax. Assume planning saves 20% of the bill, costs £10,000, and a quarter to a half of applicable households would use it. Applying those assumptions to our model gives about £6m to £13m a year of additional revenue on the 2029-30 receipts scale. Varying the assumed cost from £5,000 to £20,000 widens that to roughly £1m to £30m.
The housing market – the penalty for selling or downsizing
These figures come from our Wealth and Assets Survey model, using April 2027 prices and the 2027-28 rules (with pension pots in estates). We take every household with a member aged 65 or over that owns its home, and ask what the inheritance tax bill would be under the Conservative proposal in three cases: if they kept the home; if they sold it and held the proceeds as cash; and if they moved to a home worth half as much and kept the difference. The penalty is the extra tax. Because the exemption only applies where there are children or grandchildren, each household is weighted by the chance that it has descendants. We get 1.48m households with any penalty from selling up (24% of pensioner homeowners with descendants), 1.17m with a penalty over £50,000 and 0.88m over £100,000. The median penalty for selling up, among households facing one, is about £134,000. For moving to a home worth half as much, it’s 0.84m households, 0.62m over £50,000, and a median penalty of about £95,000. Under current law these penalties are close to zero, because the residence nil rate band follows the sale proceeds under the downsizing rules. The figures assume everyone dies today, as our model always does; they measure the incentive, not what will happen.
The housing market – homes kept until death
HMRC table 12.5c, 2023-24: 4,780 taxpaying estates of people aged 65 and over held no UK residential property at death (390 aged 65 to 74, 1,090 aged 75 to 84, 3,300 aged 85 and over). As above, allowing for qualifying descendants and the new allowances leaves about 1,900 to 3,800 estates with a tax incentive to retain a home, depending on existing downsizing relief. We assume 50% to 80% of those homes would be kept under the proposal, so about 950 to 3,060 a year, worth £0.6bn to £1.8bn at the average residential value for each age band. These are mostly delayed sales rather than lost ones: the heirs would usually sell after the death. If the delay averages two to three years, which is roughly the length of a typical stay in residential care,37 that’s something like 2,000 to 9,000 homes held off the market at any one time. Many would be empty.
The housing market – fewer downsizing moves
We assume that between 1.5% and 2% of older homeowner households move each year.
The first version of this report used 2%. The English Housing Survey’s 2020/21 report on older people’s housing found that 6.0% of owner-occupier households headed by someone aged 65 or over had moved within three years (and, obviously, dividing by three gives 2.0%). It also found that 4.77% had moved between one and three years previously. These are useful cross-checks, but dividing a multi-year proportion by the number of years doesn’t directly measure an annual moving rate. We should have made that distinction clearer.
Thanks to Neil O’Brien whose criticism made us look at this point again. He pointed out that the survey’s annual figures for 2018-19 to 2020-21 were only 1.2% to 1.7%. That’s correct, but the five years before were all between 1.7% and 2.2%. The problem is that the annual EHS estimates vary considerably: our calculations from table FA4141 and table FA1201 give 2.18% in 2016/17, 1.24% in 2018/19 and 1.68% in 2019/20. Small numbers of movers make these estimates imprecise. The 2020/21 sample contained 2,413 older owner-occupier households; at its estimated moving rate of 1.24%, an equally weighted sample would contain only about 30 movers (but we can’t recover the actual number from the weighted percentages). We therefore wouldn’t rely on any single year’s estimate. Pooling 2014-15 to 2021-22 gives 1.7%, but we lack the information on the survey design to construct a reliable 95% range.
It’s therefore helpful to look at other sources. An IFS study of housing wealth at older ages analysed 38,091 possible two-year transitions in the English Longitudinal Study of Ageing between 2002/03 and 2014/15. Approximately 4% of owner-occupiers aged 50-plus moved over two years, roughly 2% annually. That includes slightly younger owners (50+) and moves into institutions such as care homes. A 2024 MHCLG-commissioned report, using Understanding Society, found annual moving rates of approximately 2% in each of the 65 to 74, 75 to 84 and 85-plus age groups, although these cover all tenures and it’s a rounded number, so it could be anywhere from 1.5% to just under 2.5% (and the confidence interval could be even wider). Census 2021 gives another comparison: 2.02% of people aged 65-plus living in owner-occupied homes in England had changed address within the UK in the preceding year (165,014 out of 8,149,812) – restricting to households headed by someone aged 66 or over gives 1.79%. This counts people rather than households, identifies tenure at Census Day rather than before the move, and covers a pandemic year.
Taking these sources together, we consider 1.5% to 2% a reasonable modelling range. But this is very much a modelling judgment, not a confidence interval. Where we are in that range makes little difference – 1.5% vs 2% reduces our low end dynamic estimate by £50m.
We assume that 36% to 47% of older homeowners’ moves release housing equity. This is an illustrative range informed by two studies, which measure different aspects of downsizing.38
Applying those rates to the 0.84m households that would face a penalty for halving the value of their home gives 4,500 to 7,900 downsizing moves a year. If the penalty halved them, that’s 2,300 to 4,000 fewer. Unlike the first effect, these are not just delayed: someone who doesn’t downsize at 75 will usually stay put until they die, so the effect builds up. After ten years it could be in the region of 23,000 to 40,000 family-sized homes occupied by people who would otherwise have moved, though that assumes the halving persists and ignores deaths along the way. Halving is an assumption; the US evidence on capital gains lock-in suggests that a five or six figure tax on moving reduces moves by a large fraction, but nobody has measured a penalty of this size.
The housing market – London and the South East
From our model, under the Conservative proposal: of the 840,000 households facing a downsizing penalty, 391,000 are in London or the South East, and 252,000 of those have a home worth £750,000 or more at April 2027 prices (151,000 at £1m or more, 61,000 at £1.5m or more). Applying the same assumptions as above (1.5%-2% move each year, 36% to 47% of movers downsize, half deterred) gives 1,050 to 1,800 fewer downsizing moves a year in the two regions, 400 to 700 of them involving homes worth £1m or more. For homes kept rather than sold, we split the national 1,000 to 3,000 using HMRC’s regional table, which puts 39% of taxpaying estates in London and the South East, and assume those homes are spread by value like the homes of the remaining payers in those regions in our model (39% at £1m or more). The denominators are standard sales in 2024 from the Land Registry’s price paid data: 210,000 in London and the South East, of which 20,900 at £1m or more and 8,400 at £1.5m or more, with the thresholds deflated by 7% to put them in 2024 money. 2024 was a quiet year; against the year to March 2025 the percentages would be about a tenth lower. The survey records bedrooms for only one household in ten, so we can’t identify large houses directly and use value instead. In London a £1m home is often not a large one. Nine in ten of these households live in houses rather than flats.
Why does Oxford Economics get £6bn?
The Conservative Party rely upon a £6bn figure from a report by Oxford Economics for the think tank Onward. The report describes the method in two pages and an appendix. It sets out the main assumptions, but not the model, and it doesn’t quantify the behavioural adjustment it makes.
As a matter of principle, we don’t think much weight should be placed upon commissioned reports that don’t publish their full methodology.
So we can’t be sure precisely what Oxford Economics did, but there appear to be four reasons why their figure differs from ours:
- Oxford Economics forecasts £12.6bn of liabilities in 2029-30, against the OBR’s £13.7bn of receipts.39 Applying their percentage reduction to the OBR figure gives £6.5bn, not £6bn.
- Oxford Economics don’t appear to take any account of dynamic effects that increase the cost of the policy, as taxpayers’ behaviour is distorted and reduces yields. That is surely not correct.
- On the other hand, their costing includes a favourable behavioural adjustment which they don’t set out, but for the reasons explained above, may be mistaken (because it applies elasticities to average, not marginal rates).
- Our high-end static estimate comes from our survey model, and this shows a significantly larger reduction in IHT than our HMRC calculation. Oxford Economics also used a Wealth and Assets Survey model, but with different assumptions.
Oxford Economics have now published a response to this report. Their criticisms of our static estimate are about the limits of the Wealth and Assets Survey. Some are fair, but they’re the reason we also costed the proposal from HMRC’s data and said we don’t know which of the two estimates is more accurate. Their own back-testing only checks total liabilities and the number of estates paying, so it doesn’t establish how accurately their model captures the cost of exempting homes.
Oxford Economics now give the size of their behavioural adjustment – it’s small (£200 million).
On the incentive to move wealth into housing, they say they “chose not to seek to model this effect” because it would be “marginal” for reasons they list but don’t quantify. One of those reasons is the existence of stamp duty land tax, which the Conservatives are pledged to abolish. They assert that people aren’t likely to invest in low-yielding and illiquid assets, despite the experience of people doing exactly that (AIM shares, woodland, agricultural property). They they don’t engage with past experience of such effects in the UK and elsewhere. Most seriously, Oxford Economics doesn’t mention the incentive to hold on to a home rather than sell or downsize, which is the larger of the behavioural effects we identified
So overall this does not look like a serious attempt to engage with incentive effects. And Oxford Economics haven’t published their model or explained their methodology any further.
It’s a disappointing response.
The underlying household model is on GitHub.
Thanks to T for help with modelling for this report, and G, C and B for our original IHT model development.
Photo by Toa Heftiba on Unsplash.
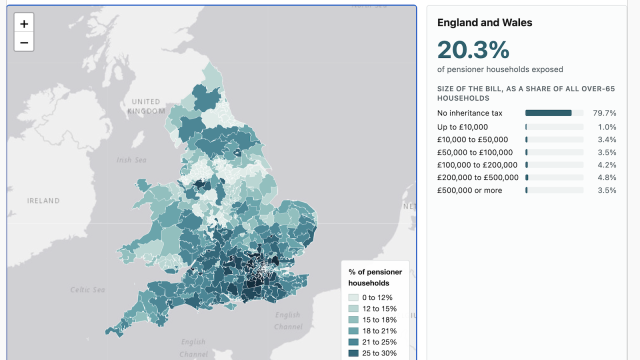
The hidden reach of inheritance tax: one in five pensioner households
MP Estate Planning: the unregulated firm selling defective trusts to the elderly

The problem with unregulated tax advisers: a scheme from Property118 that could cost clients £100k+

Did Keir Starmer use a trust to avoid inheritance tax?

A fair solution to inheritance tax on farms and small businesses

How to stop IHT avoidance but protect farmers
Footnotes
The original version of this report, published on 8 October 2026, gave the range as £7.7bn to £10.9bn. On 9 October we corrected an erroneous assumption in the downsizing estimate: we had assumed that a quarter to a third of the equity released by downsizers would remain taxable after the new allowances, when our own model puts it at a fifth to a quarter. The correction is explained in the methodology section. That change reduced the “fewer people downsizing” component from £0.25bn to £0.65bn to £0.20bn to £0.50bn, and the headline range by about £0.1bn. ↩︎
Households with a member aged 65 or over are ranked by estate wealth at April 2027 values. The top 1%, 5%, 10% and 20% wealth thresholds are approximately £4.6m, £1.75m, £1.24m and £840,000. The survey misses the very wealthiest, so, in all likelihood, this chart understates the benefit to that cohort. These are model results for Great Britain. ↩︎
Model results: London receives 41% of the tax cut and the South East 27%, against 11% and 16% of pensioner households. The regional distribution file (distribution_by_region.csv) is in our GitHub. ↩︎
Assessing the implications of inheritance tax reforms in the UK, Onward and Oxford Economics, October 2026. ↩︎
Their £6.2bn headline minus a £200m behavioural adjustment. ↩︎
Economic and fiscal outlook, March 2026, Table A.5. Applying our estimated percentage reductions to that forecast is an approximation: it assumes the saving shares carry over to 2029-30 and does not model payment lags between liabilities and receipts. ↩︎
Existing rules can preserve residence relief after downsizing – subject to the conditions for HMRC’s downsizing addition. ↩︎
Assuming other nil rate bands are exhausted. ↩︎
The current residence nil rate band has a downsizing allowance, but I’m doubtful that could apply to the Conservative proposal. The numbers at stake would simply be too large, and the potential for avoidance too great. ↩︎
Assuming the house is bequeathed to children or grandchildren, and ignoring for the moment any capital gains tax and transaction costs. The Conservatives have separately pledged to abolish stamp duty on main homes. ↩︎
Although most people with large portfolios hold them in a way that enables material realisations without capital gains (for example, having some assets sitting at a gain and some at a loss). The extent to which any of this, and the use of leverage in particular, is viable depends upon whether there are anti-avoidance rules, and how they would work. Existing IHT rules already restrict deductions for borrowing used to acquire relieved assets or excluded property. But very quickly, what looks like a simple, politically attractive relief spirals into complexity. This has already happened with the residence nil rate band, but here the size of the benefit and therefore the incentives to play games are much greater. ↩︎
On Japan: Takatoshi Ito, “Public Policy and Housing in Japan”, in Noguchi and Poterba (eds), Housing Markets in the US and Japan, 1994: inheritance tax valuation rules “help explain why the elderly in Japan retain housing and other real estate until their death. The share of real estate in taxable bequests in Japan is about 60 percent, while the comparable ratio in the United States is about 25 percent.” On the 2015 reform: Mikawa, Yasuda and Yukutake, “Does inheritance taxation reform promote to build inexpensive rental housing?”, Journal of the Japanese and International Economies, 2023, which finds the reform “potentially served as a good incentive for people to build inexpensive low-rise apartments for tax savings”; Reuters reported in December 2016 that apartment construction loans had set a record for seven consecutive quarters since the tax rise. Seko, Sumita and Yoshida, “Bequest Motives, Inheritance Tax, and Housing Choice” (2019), find that “the motive to bequeath housing makes moving less likely but capacity-increasing renovations more likely”. On AIM: Peel Hunt’s estimate of £6bn in AIM inheritance tax funds was reported by City AM in 2024; the Office of Tax Simplification noted in 2019 that “investment houses actively market the Inheritance Tax savings for qualifying shares purchased through AIM”. Woodland and farmland have also been extensively used for IHT planning, despite their illiquid nature and generally poor yields (CenTax found that 32% of farm estates benefiting from APR and/or BPR had relief claims covering less than 20% of their estate, suggesting passive investment in farmland for IHT purposes). ↩︎
We would see a smaller shift than in Spain, because houses are obviously much less liquid than shares. Although we might see artificial schemes facilitating shifting investments into easily-added fixtures in a house – someone suggested (not entirely seriously) gold toilets. ↩︎
The original version of this report said:
“Oxford Economics appear to have concluded there are much larger positive effects, but we can’t see what they did. They cite research by the Wealth Tax Commission which used average IHT rates, not marginal rates, but does not publish their coefficient, asset allocation or the size of their adjustment. If Oxford Economics simply applied elasticities to a change in average tax rate, then we think they made a mistake.”
It wasn’t disclosed in their report, but Oxford Economics’ response says they only applied a £200m positive behavioural adjustment. ↩︎
HMRC’s UK monthly property transactions statistics show 573,000 residential transactions in the first half of 2025, and the analytics firm TwentyEA forecast about 1.18m for the year as a whole. ↩︎
Important to note: this estimates a change in the portfolios of the affected pensioner households, not a reduction in financial investment across the economy. Those effects will be complex. When someone buys an existing home, the seller receives the proceeds and may reinvest them, repay debt, spend them or buy another property. The likely wider effects are therefore upward pressure on house prices, changes in who owns and occupies homes, and some additional spending on construction and improvements. Past UK experience suggests that, given constrained housing supply, a substantial part of the response could take the form of higher prices rather than more housing. We have not attempted to model these market-wide adjustments or their net effect on investment. ↩︎
CenTax found that 32% of farm estates claiming agricultural or business relief have claims covering less than 20% of the estate, suggesting passive investors (pages 41 to 42). By value they’re a much smaller share. Using CenTax’s figures, we estimate they account for 4% to 14% of the relief farm estates claim: the low end assumes their claims average the same as all estates where relief is under 20% of the estate, and the high end the same as estates claiming only agricultural relief. Applying 4% to 14% to Defra’s £336.6bn value for UK agricultural land gives £14bn to £47bn, or up to £78bn at 23%. Defra’s figure includes land owned by institutions, charities and the Crown Estate, which of course isn’t relevant to IHT discussions, and is pushing the figure up. On the other hand, estate data shows who dies holding land rather than who holds it now, so they miss the largest living landowners, which pushes the figure down. And CenTax’s 20% is an arbitrary cut-off, and will miss some passive investors who are heavily invested in farmland. ↩︎
Forestry Statistics 2025, Table 1.1, puts privately owned woodland at 2.43m hectares: 879,000 of conifers and 1.55m of broadleaves. We value the conifers at £13,100 to £19,200 per hectare, figures we derive from the 2025 averages from Savills and the UK Forest Market Report, and the broadleaves at £10,200 to £16,200 per hectare, using the Forest Market Report’s regional prices for mixed woodland. The “private” figure includes charities, local authorities and institutional investors, none of whom pay inheritance tax, and some of the broadleaf woodland sits on farms. ↩︎
At the same 2025 prices, all UK woodland, public and private, would sell for about £38bn to £58bn. The ONS woodland natural capital accounts value the UK’s timber and woodfuel at £14.8bn (2021, in 2022 prices), the present value of what that timber will earn. Not all of the gap is tax: buyers also pay for amenity, sporting rights, carbon credits and the land itself. The ONS’s better-known £382bn figure is a different measure. It values woodland’s wider benefits, such as carbon capture and health, and isn’t a market value (e.g. it values carbon at roughly ten times the price woodland carbon credits sell for). NB Some farm woodland may sit in both Defra’s agricultural land value and the woodland figure – Defra doesn’t say whether its figure includes farm woodland. ↩︎
Peel Hunt’s estimate, reported by City AM. Peel Hunt expected more than £600m a year to leave AIM after the cut. The largest single AIM service, Octopus’s, held £824m in June 2026 (Wealth Club). ↩︎
Octopus says it looks after more than £3.9bn across its business relief products (Octopus), of which £824m is its AIM service. TIME Investments reports over £1.5bn of business relief investments and Downing £1.15bn in inheritance tax products. These are the providers’ own figures, and some may include AIM portfolios. ↩︎
The calculation is from our wealth and assets model and can be run from our GitHub. ↩︎
Before behavioural responses, cutting the rate cuts the tax in exact proportion, because every estate’s taxable amount is unchanged: a 55.5% cut in revenue needs a rate of 40% × (1 − 0.555) = 17.8%. We’ve ignored the reduced 36% rate for estates leaving 10% to charity, which would presumably be cut pro rata. ↩︎
OECD, Inheritance Taxation in OECD Countries, 2021, p.38. On heirs, p.57: “Empirical evidence shows that inheritance receipts depress heirs’ labour supply and that inheritance taxes could raise their incentives to work.” The classic study is Holtz-Eakin, Joulfaian and Rosen (1993), who found that people receiving a large inheritance were more likely to leave the labour force. A German lifecycle model cited by the OECD finds that every euro of inheritance tax brings in a further nine cents of income tax, because heirs work more. ↩︎
We explain the evidence for each of the others in our report on Reform UK’s overtime proposal. Costs are mostly from HMRC’s ready reckoner. The GDP figures are our approximate long-run estimates, using the OBR’s scoring of the 2024 employer NI rise as the yardstick for rate changes, and published studies for the structural reforms. For the family home exemption we use a cost of £7bn, the low end of our static range for 2029-30, and a GDP range of zero to £0.3bn: the top allows for a small saving response by donors, and the bottom is floored at zero rather than going negative, which is generous given the evidence on heirs. The bar for each option is the upper end of our GDP range divided by the cost, so these are generous to every proposal, including this one. Please bear in mind that these are approximate estimates, not forecasts. ↩︎
HMRC’s own estate-based wealth estimates adjust mortality rates for housing wealth as well as age, sex and marital status: see its comparison of estate data and the Wealth and Assets Survey, page 2. ↩︎
See the ONS release and quality discussion and the Office for Statistics Regulation’s assessment. The concerns include sample imbalances and reduced precision, particularly for regional estimates. ↩︎
Under the April 2027 rules, the cost falls from 63.6% to 58.5% of baseline tax. Applying those shares to £13.7bn gives £8.71bn and £8.02bn. On the separate historical-rules calculation, the cost share falls from 65.6% to 59.0%, equivalent to £8.99bn and £8.09bn on the same receipts scale. ↩︎
1.49 million households would face an inheritance tax penalty for selling their home if we use Round 7, compared with 1.48 million if we use Round 8. For downsizing to a home worth half as much, the figures are 838,000 and 839,000 respectively. Curiously, these extremely close results are caused by offsetting differences. Round 7 gives about 202,000 potentially-downsizing London households, against 174,000 in Round 8. But the average downsizing penalty for affected households is about £145,000 in Round 7, against £125,000 in Round 8. ↩︎
The comparison uses 2023/24 prices and rules, and the model’s Great Britain, aged-65-plus scope. Round 7 produces £10.10bn of tax against a comparable HMRC figure of £6.22bn; Round 8 produces £9.01bn. The number of taxable estates is overpredicted by 53% using Round 7 and 60% using Round 8. ↩︎
ONS cohort fertility data, as used in our model, gives about 85% of pensioner homeowner households a living child, and the proposal also counts grandchildren. Restricting our model to the homeowner estates that would actually pay tax gives 75%, because childless estates are more likely to be taxable (they have no residence nil rate band). HMRC table 12.2a shows that 31,000 of the 53,700 estates with a chargeable value in 2023-24 used the residence nil rate band – 58%. That’s a floor, because estates over £2.35m lose the band to the taper, and some estates don’t claim the RNRB. We prudently assume 80%. The 48% to 53% range below shows the sensitivity. ↩︎
HMRC table 12.2a, 2023-24: 22,300 of the 53,700 estates with a net chargeable value used a transferred nil rate band. ↩︎
From our model: among households that would face a penalty, the median penalty is about £95,000 for moving to a home worth half as much and about £134,000 for selling up. See the housing market section below. ↩︎
The £4bn to £7bn multiplies 30,000 to 50,000 downsizing moves by £129,000. That’s from Savills’ August 2022 estimate of the average equity an older household could release by downsizing, which they say is derived from the English Housing Survey and Land Registry data, but Savills haven’t published the method. The households facing a penalty in our model have above-average homes (70% worth £500,000 or more at April 2027 prices). So £129k is likely to understate the equity released – this is therefore a conservative estimate. ↩︎
We checked this against our model: if every pensioner homeowner household with descendants moved to a home worth half as much, 20% of the equity released would be taxed under the proposal, and 27% of it would belong to households facing some downsizing penalty (the remainder being covered by the allowances they have left). The survey under-records the very wealthy even after our top-end correction, and wealthier owners may downsize more or less often than average – we don’t know. There’s therefore uncertainty in both directions, and we use 20% to 25%. The first version of this report assumed a quarter to a third. That was a transcription error that persisted through the final draft – it’s something we should have caught – our apologies. Correcting it reduced the “fewer people downsizing” line from £0.25bn to £0.65bn to £0.20bn to £0.50bn, and our headline range from £7.7bn to £10.9bn to £7.6bn to £10.8bn. The first version was also too definitive in using a 2% figure for household moves – we now use a 1.5% to 2% range. This reduced the low-end dynamic estimate by £50m but left the overall range unchanged. ↩︎
Oxford Economics assume a 3% a year real drawdown of financial assets (see their appendix). A downsizer in their late sixties or seventies can expect to live another 10 to 20 years, over which that leaves 55% to 75% of the released cash. We use 50% to 70%. ↩︎
Forder and Fernández (2011), using records of 11,565 residents who died in Bupa care homes between 2008 and 2010, found a mean stay of 801 days (about two years and two months) and a median of 462 days (about 15 months). Two years is close to the mean; the typical stay is shorter, so our range may be generous. ↩︎
The English Housing Survey 2020/21 found that 33% of owner-occupier households aged 65 or over who had moved in the previous three years reported wanting a smaller home, and 4% reported wanting a cheaper one. Respondents could give several reasons, so these percentages cannot simply be added. The Rightsizing report commissioned by Greater Manchester used national British Household Panel Survey and Understanding Society data: 47.2% of moves by people aged 50 or over were to homes with fewer rooms (that figure includes renters). Neither study directly measures the proportion of moves by homeowners aged 65 or over that release equity. A move for family reasons can release equity, while a move to fewer rooms need not. Our range is therefore a modelling assumption, with uncertainty in both directions. ↩︎
Geography explains a small part: the report says Northern Ireland accounts for less than 1% of liabilities. ↩︎


Leave a Reply