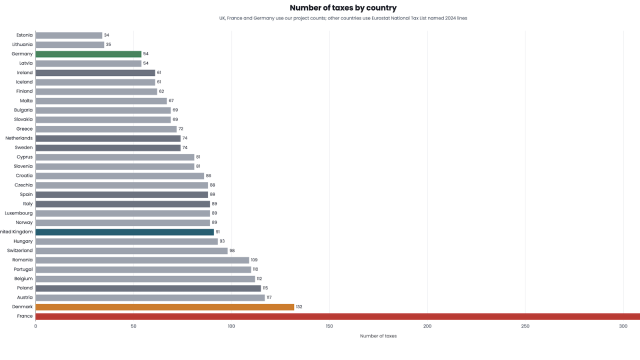
Bar chart comparing the 2022 tax wedge as a proportion of gross wages across OECD countries: Belgium has the highest tax wedge at approximately 53%, while Chile has the lowest at around 7%. The United Kingdom, highlighted in a red box, sits below the OECD average at roughly 31.5%.

2022 tax wedge - proportion of gross wages paid in tax
TAX POLICY ASSOCIATES
Y-axis: 0% to 60% (in 10% increments)

Values (approximate readings from chart):
Belgium: ~53%
Germany: ~48%
France: ~47%
Austria: ~47%
Italy: ~46%
Finland: ~43%
Slovenia: ~43%
Sweden: ~42%
Portugal: ~42%
Slovak Republic: ~41.5%
Hungary: ~41%
Latvia: ~40.5%
Luxembourg: ~40%
Czech Republic: ~39.5%
Spain: ~39.5%
Estonia: ~39%
Lithuania: ~38%
Turkey: ~37%
Greece: ~37%
Norway: ~35.5%
Denmark: ~35.5%
Netherlands: ~35.5%
Ireland: ~34.5%
OECD AVERAGE: ~34.5%
Poland: ~33.5%
Japan: ~32.5%
Iceland: ~32.5%
Canada: ~32%
United Kingdom (highlighted in red): ~31.5%
United States: ~30.5%
Costa Rica: ~29%
Australia: ~27%
Korea: ~24%
Israel: ~23.5%
Switzerland: ~23%
Mexico: ~20%
New Zealand: ~20%
Chile: ~7%

How much does the UK tax the average worker, compared to the rest of the world?

20 September 2023

6 Comments

I posted some charts yesterday on how the UK tax system compares to other countries when we look at tax as a % of GDP. One response was to say: “well, I don’t care about tax as a % of GDP… I care about the tax I pay”. Which is fair enough.

How can we fairly compare the tax actual people pay?

Tax wedge

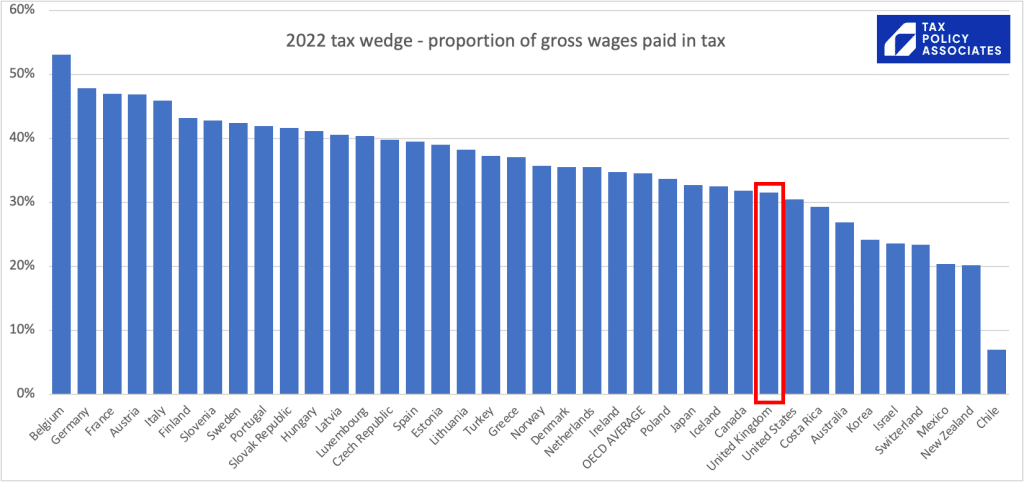
The “tax wedge” is the tax paid by the average single worker divided by the gross wages. It’s the best way I know to make a fair (or somewhat fair) comparison of the burden on tax on wages across the world.

Looking at the OECD tax wedge data, we see this:
Bar chart comparing the 2022 tax wedge as a proportion of gross wages across OECD countries: Belgium has the highest tax wedge at approximately 53%, while Chile has the lowest at around 7%. The United Kingdom, highlighted in a red box, sits below the OECD average at roughly 31.5%.

2022 tax wedge - proportion of gross wages paid in tax
TAX POLICY ASSOCIATES
Y-axis: 0% to 60% (in 10% increments)

Values (approximate readings from chart):
Belgium: ~53%
Germany: ~48%
France: ~47%
Austria: ~47%
Italy: ~46%
Finland: ~43%
Slovenia: ~43%
Sweden: ~42%
Portugal: ~42%
Slovak Republic: ~41.5%
Hungary: ~41%
Latvia: ~40.5%
Luxembourg: ~40%
Czech Republic: ~39.5%
Spain: ~39.5%
Estonia: ~39%
Lithuania: ~38%
Turkey: ~37%
Greece: ~37%
Norway: ~35.5%
Denmark: ~35.5%
Netherlands: ~35.5%
Ireland: ~34.5%
OECD AVERAGE: ~34.5%
Poland: ~33.5%
Japan: ~32.5%
Iceland: ~32.5%
Canada: ~32%
United Kingdom (highlighted in red): ~31.5%
United States: ~30.5%
Costa Rica: ~29%
Australia: ~27%
Korea: ~24%
Israel: ~23.5%
Switzerland: ~23%
Mexico: ~20%
New Zealand: ~20%
Chile: ~7%

I think many people will be surprised, even disbelieving, at where the UK places here.

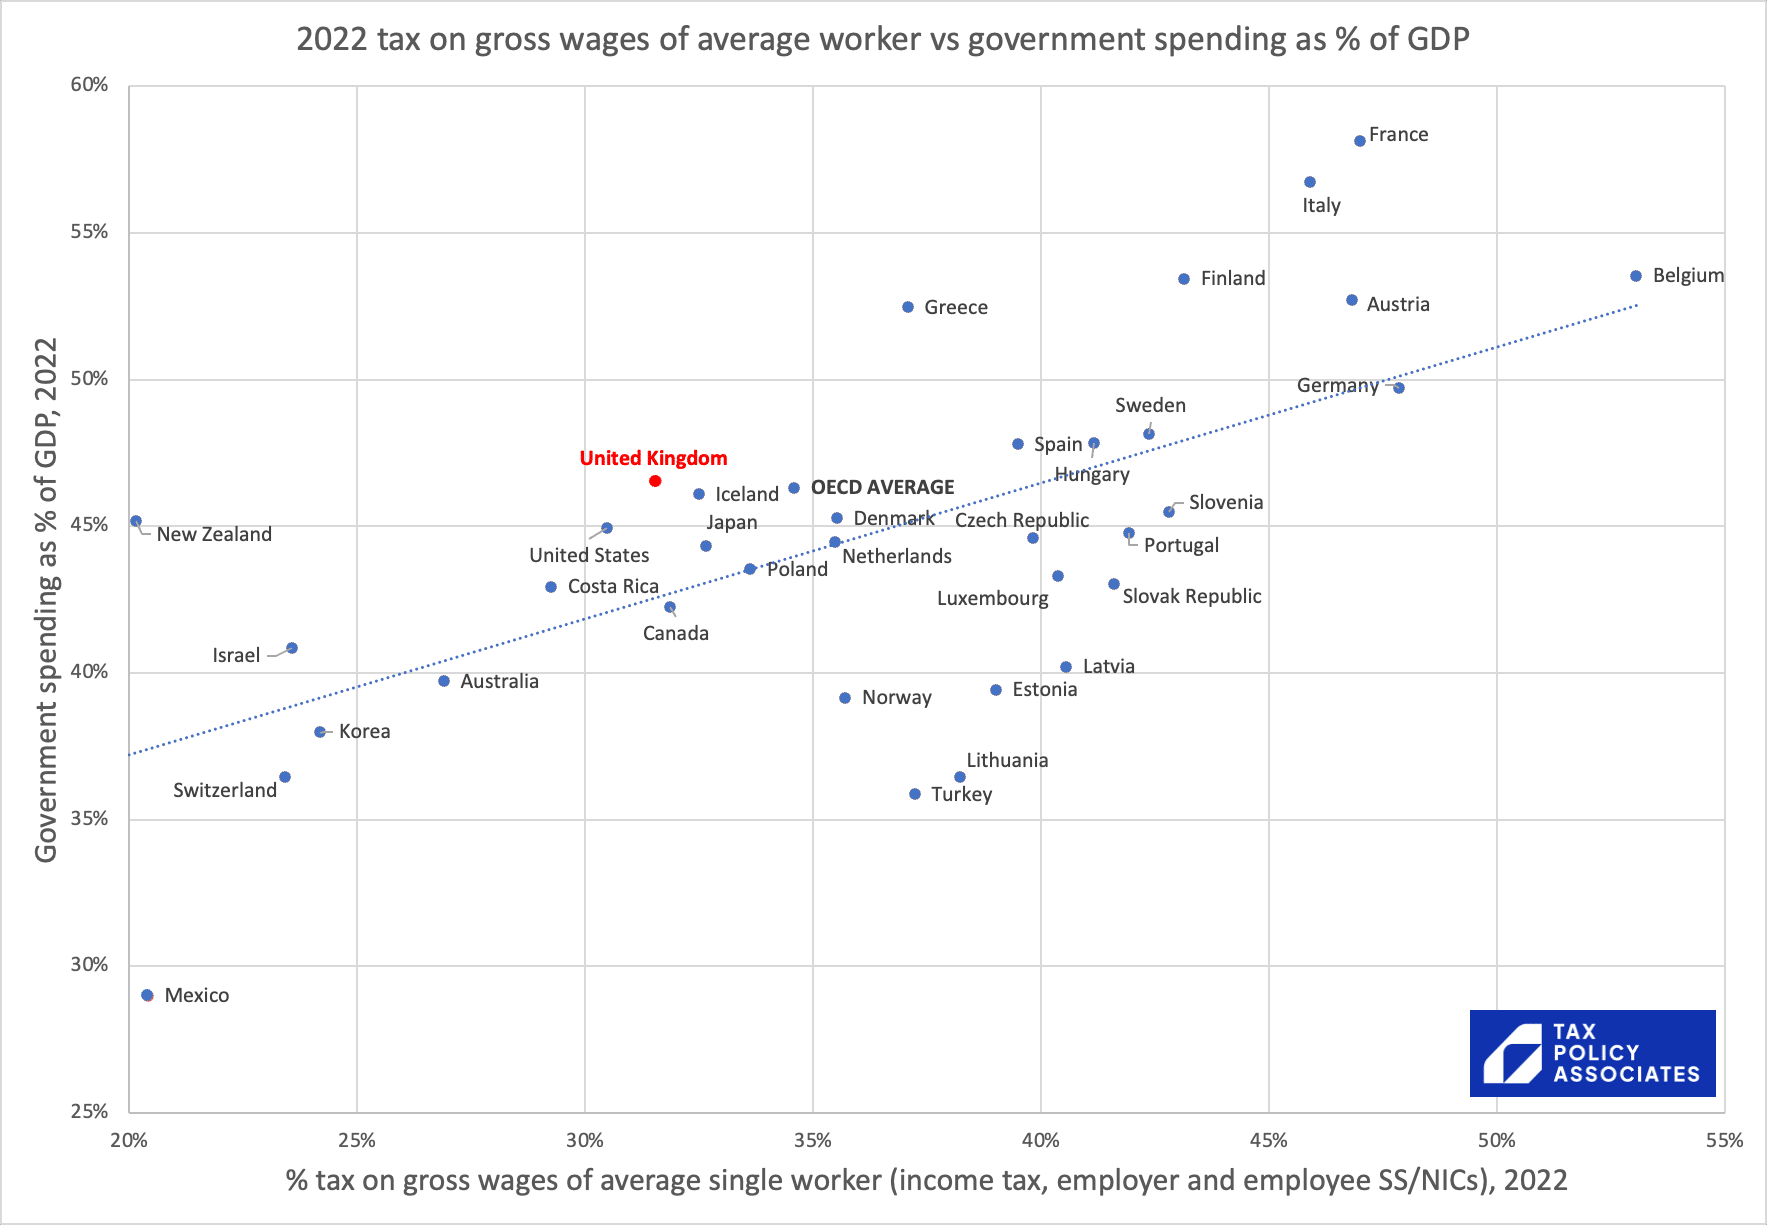
Clearly there are some very different social models, with Belgium (for example) having a much more expansive welfare state than Chile. So it’s useful to add in that wider context (again from OECD data):
Scatter plot comparing tax on gross wages of an average worker against government spending as a percentage of GDP in 2022 across OECD countries: There is a positive correlation between government spending as a percentage of GDP and the tax rate on an average worker's gross wage. The United Kingdom sits above the trendline with government spending of around 46.5% of GDP but an average worker tax burden of roughly 31.5%, which is below the OECD average tax rate of 34.6%.

2022 tax on gross wages of average worker vs government spending as % of GDP

Y-axis: Government spending as % of GDP, 2022 (25% to 60%, 5% increments)
X-axis: % tax on gross wages of average single worker (income tax, employer and employee SS/NICs), 2022 (20% to 55%, 5% increments)

Data points (approximate values based on plot coordinates):
Mexico: 20.5%, 29.1%
New Zealand: 20.2%, 45.2%
Switzerland: 23.4%, 36.5%
Israel: 23.6%, 40.8%
Korea: 24.2%, 38.0%
Australia: 26.9%, 39.8%
Costa Rica: 29.2%, 42.9%
United States: 30.5%, 44.9%
United Kingdom (highlighted in red): 31.5%, 46.5%
Canada: 31.9%, 42.2%
Iceland: 32.5%, 46.1%
Japan: 32.7%, 44.3%
Poland: 33.6%, 43.5%
OECD AVERAGE: 34.6%, 46.3%
Denmark: 35.5%, 45.3%
Netherlands: 35.5%, 44.4%
Norway: 35.8%, 39.2%
Greece: 37.1%, 52.5%
Turkey: 37.2%, 35.9%
Lithuania: 38.2%, 36.5%
Estonia: 39.0%, 39.5%
Spain: 39.5%, 47.8%
Czech Republic: 39.8%, 44.5%
Luxembourg: 40.4%, 43.3%
Latvia: 40.6%, 40.2%
Hungary: 41.2%, 47.8%
Slovak Republic: 41.6%, 43.0%
Portugal: 41.9%, 44.7%
Sweden: 42.4%, 48.2%
Slovenia: 42.8%, 45.5%
Finland: 43.1%, 53.4%
Italy: 45.9%, 56.7%
Austria: 46.8%, 52.7%
France: 47.0%, 58.1%
Germany: 47.8%, 49.7%
Belgium: 53.0%, 53.5%

A blue dotted trendline rises from approximately (20%, 37%) to (53%, 52.5%).

Logo: TAX POLICY ASSOCIATES

So in general terms, if you’re an average worker, you get what you pay for.

Or, if we want to annoy lots of people, we can point out that there’s no country where the average worker pays less tax than the UK on their wages, but which has higher government spending.

What about VAT?

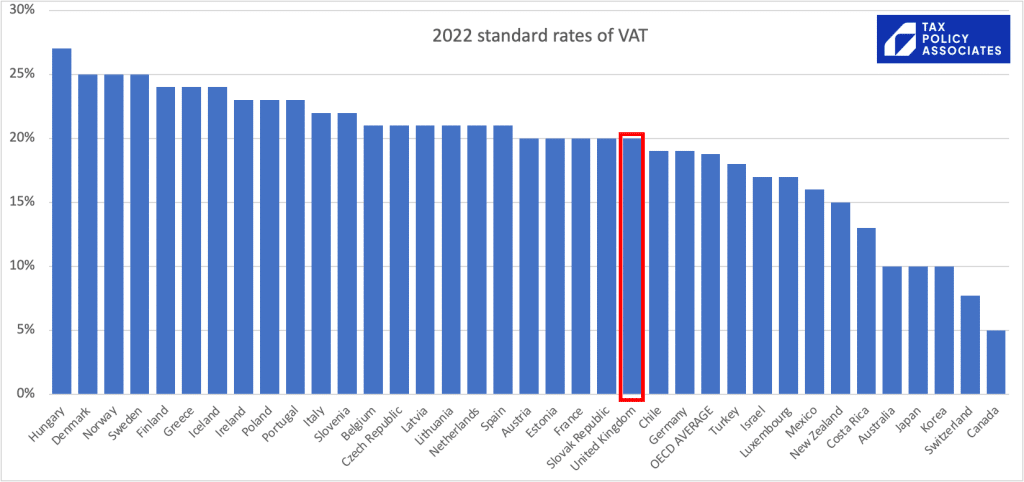
If we just look at the standard rate of VAT in each country:
Bar chart comparing 2022 standard rates of VAT across OECD countries: The UK's standard rate of VAT of 20% is slightly above the OECD average of around 19%, sitting roughly in the middle of OECD nations, which range from 27% in Hungary to 5% in Canada.

2022 standard rates of VAT

Logo: TAX POLICY ASSOCIATES

Y-axis: 0% to 30% in 5% increments.

Values by country (from highest to lowest):
Hungary: 27%
Denmark: 25%
Norway: 25%
Sweden: 25%
Finland: 24%
Greece: 24%
Iceland: 24%
Ireland: 23%
Poland: 23%
Portugal: 23%
Italy: 22%
Slovenia: 22%
Belgium: 21%
Czech Republic: 21%
Latvia: 21%
Lithuania: 21%
Netherlands: 21%
Spain: 21%
Austria: 20%
Estonia: 20%
France: 20%
Slovak Republic: 20%
United Kingdom: 20% [highlighted with a red outline]
Chile: 19%
Germany: 19%
OECD AVERAGE: ~19%
Turkey: 18%
Israel: 17%
Luxembourg: 17%
Mexico: 16%
New Zealand: 15%
Costa Rica: 13%
Australia: 10%
Japan: 10%
Korea: 10%
Switzerland: ~8%
Canada: 5%

On the face of it the UK again looks very average.

But we can’t just compare the standard rate. Some countries apply the standard rate to almost everything; others have widespread exemptions and special rates.

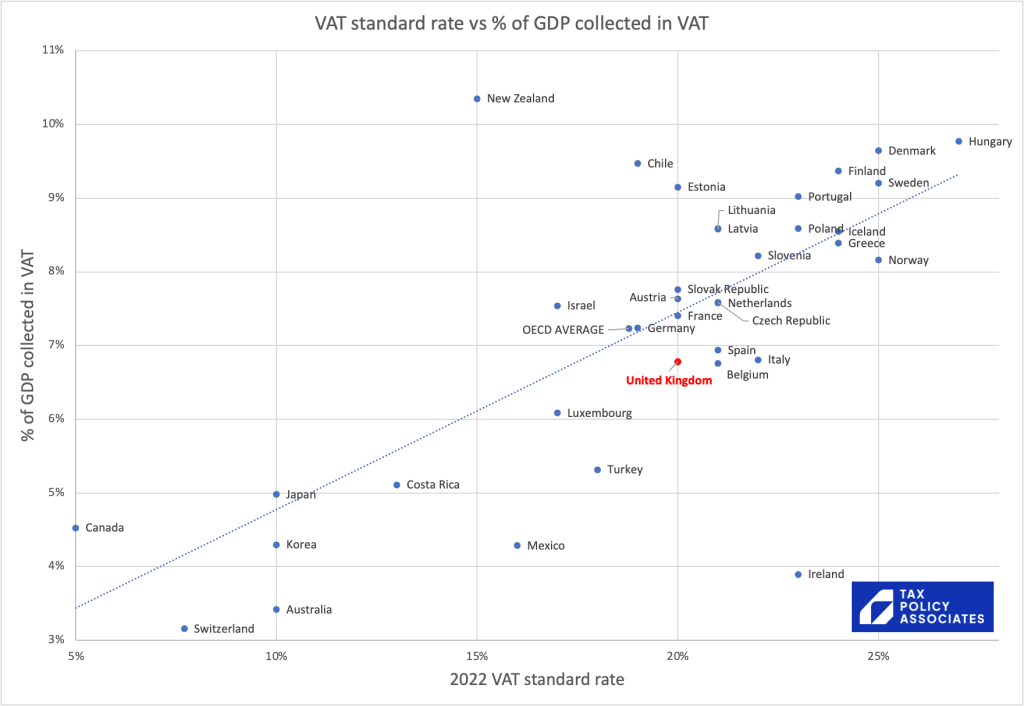
We can get a sense of this if we plot the rate of VAT against the amount of tax VAT collects, as a % of GDP:

Scatter plot of VAT standard rate versus percentage of GDP collected in VAT across OECD countries in 2022: There is a positive correlation between higher standard rates of VAT and higher VAT revenues as a proportion of GDP, though with notable outliers. The UK, with a 20% standard rate, collects approximately 6.8% of GDP in VAT, sitting slightly below the OECD average and trendline. New Zealand raises the most relative to its standard rate (over 10% of GDP from a 15% rate), while Ireland raises the least relative to its rate (under 4% of GDP from a 23% rate).

VAT standard rate vs % of GDP collected in VAT

Horizontal axis: 2022 VAT standard rate (5% to 25%)
Vertical axis: % of GDP collected in VAT (3% to 11%)

Approximate plotted values:
Canada: 5%, 4.5%
Switzerland: 7.7%, 3.2%
Japan: 10%, 5.0%
Korea: 10%, 4.3%
Australia: 10%, 3.4%
Costa Rica: 13%, 5.1%
New Zealand: 15%, 10.4%
Mexico: 16%, 4.3%
Luxembourg: 17%, 6.1%
Israel: 17%, 7.5%
Turkey: 18%, 5.3%
OECD AVERAGE: 18.8%, 7.2%
Chile: 19%, 9.5%
Germany: 19%, 7.2%
Austria: 20%, 7.6%
Slovak Republic: 20%, 7.7%
France: 20%, 7.4%
Estonia: 20%, 9.1%
United Kingdom: 20%, 6.8%
Latvia: 21%, 8.6%
Lithuania: 21%, 8.8%
Netherlands: 21%, 7.6%
Czech Republic: 21%, 7.4%
Spain: 21%, 6.9%
Belgium: 21%, 6.7%
Italy: 22%, 6.8%
Slovenia: 22%, 8.2%
Ireland: 23%, 3.9%
Portugal: 23%, 9.0%
Poland: 23%, 8.6%
Finland: 24%, 9.4%
Greece: 24%, 8.4%
Iceland: 24%, 8.5%
Norway: 25%, 8.2%
Denmark: 25%, 9.6%
Sweden: 25%, 9.2%
Hungary: 27%, 9.8%

A blue dotted trendline rises from approximately 3.4% GDP at a 5% rate to 9.3% GDP at a 27% rate.
Logo: TAX POLICY ASSOCIATES

The chart suggests the UK collects a bit less VAT (as a % of GDP) than you might expect from its rate.

The bottom line is that there is no evidence that the average Brit is over-taxed by international standards.

The spreadsheets with the data and charts are available here.


Footnotes

  1. In other words, this takes into account the income tax and national insurance/social security paid by the worker him or herself, and also the national insurance/social security paid by the employer (because there is good evidence that in the long run this is economically paid by the employee in the form of reduced wages). ↩︎

  2. There’s no USA on the chart, because the US has no VAT. Many states have sales taxes, but they’re nothing like VAT – the rate is much less (averaging around 5%) and the goods/services covered are much more limited. ↩︎

  3. Bear in mind the usual caveats about comparing different systems in different countries, and (as usual) ignore Ireland, because its reported GDP is distorted by multinational [HQ locations]/[tax avoidance] (delete per your preference). ↩︎

  4. Actually it’s worse than that, because VAT compliance in the UK is pretty good, and so masks what is a very limited VAT base (i.e. wide exemptions/lower rates) by international standards. Rita de la Feria, perhaps the world’s leading VAT academic, has written convincingly on this. ↩︎
6 responses to “How much does the UK tax the average worker, compared to the rest of the world?”

  1. michael avatar

    Does the tax wedge include all taxes including employers NI? How about compulsory employer and employee pension contributions?

  2. Simon avatar

    I find this interesting. I believe that in the early 80’s, basic rate tax was a lot higher. Possibly, if the basic rate was higher now and the personal allowance was slightly higher, we (the country) would be better off and potentially be retired at 65 still.

  3. Chris avatar

    I think the tax wedge includes employER taxes on wages too. So the UK data would include secondary class 1 NIC contributions.

  4. Richard Sage avatar

    Note 1 is absolutely correct about the definition of tax wedge (I think it may be a letter from me in the 1990s that prompted The Economist to start including employer social security and make the denominator the overall cost)
    Given that it is irrelevant what it is called, who pays it, and when they pay it, I suggest that “the tax paid by the average single worker divided by the gross wages” is better stated as “the taxation suffered by the average single worker as a proportion of their gross wage cost”.

  5. Duncan Cameron avatar

    Pay is highly skewed with many people on low incomes and a few on very high incomes, so the mean, median and mode are likely to be very different from one another. Perhaps you should say which average you are using and why.

Leave a Reply

Your email address will not be published. Required fields are marked *