
I posted some charts yesterday on how the UK tax system compares to other countries when we look at tax as a % of GDP. One response was to say: “well, I don’t care about tax as a % of GDP… I care about the tax I pay”. Which is fair enough.
How can we fairly compare the tax actual people pay?
Tax wedge
The “tax wedge” is the tax paid by the average single worker divided by the gross wages.1 It’s the best way I know to make a fair (or somewhat fair) comparison of the burden on tax on wages across the world.
Looking at the OECD tax wedge data, we see this:
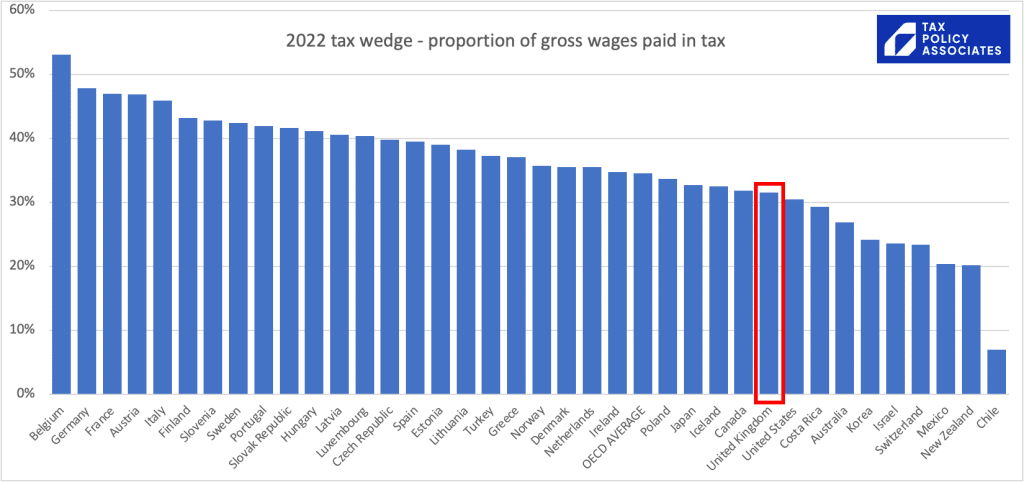
I think many people will be surprised, even disbelieving, at where the UK places here.
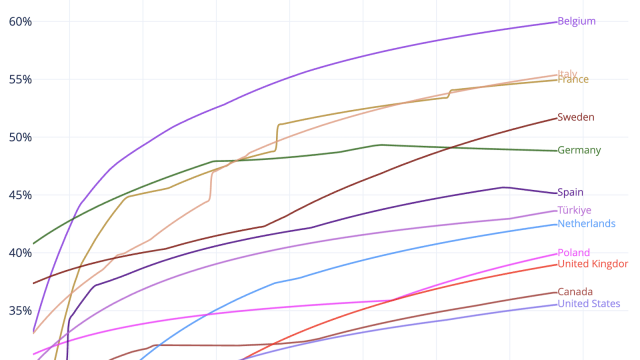
Clearly there are some very different social models, with Belgium (for example) having a much more expansive welfare state than Chile. So it’s useful to add in that wider context (again from OECD data):
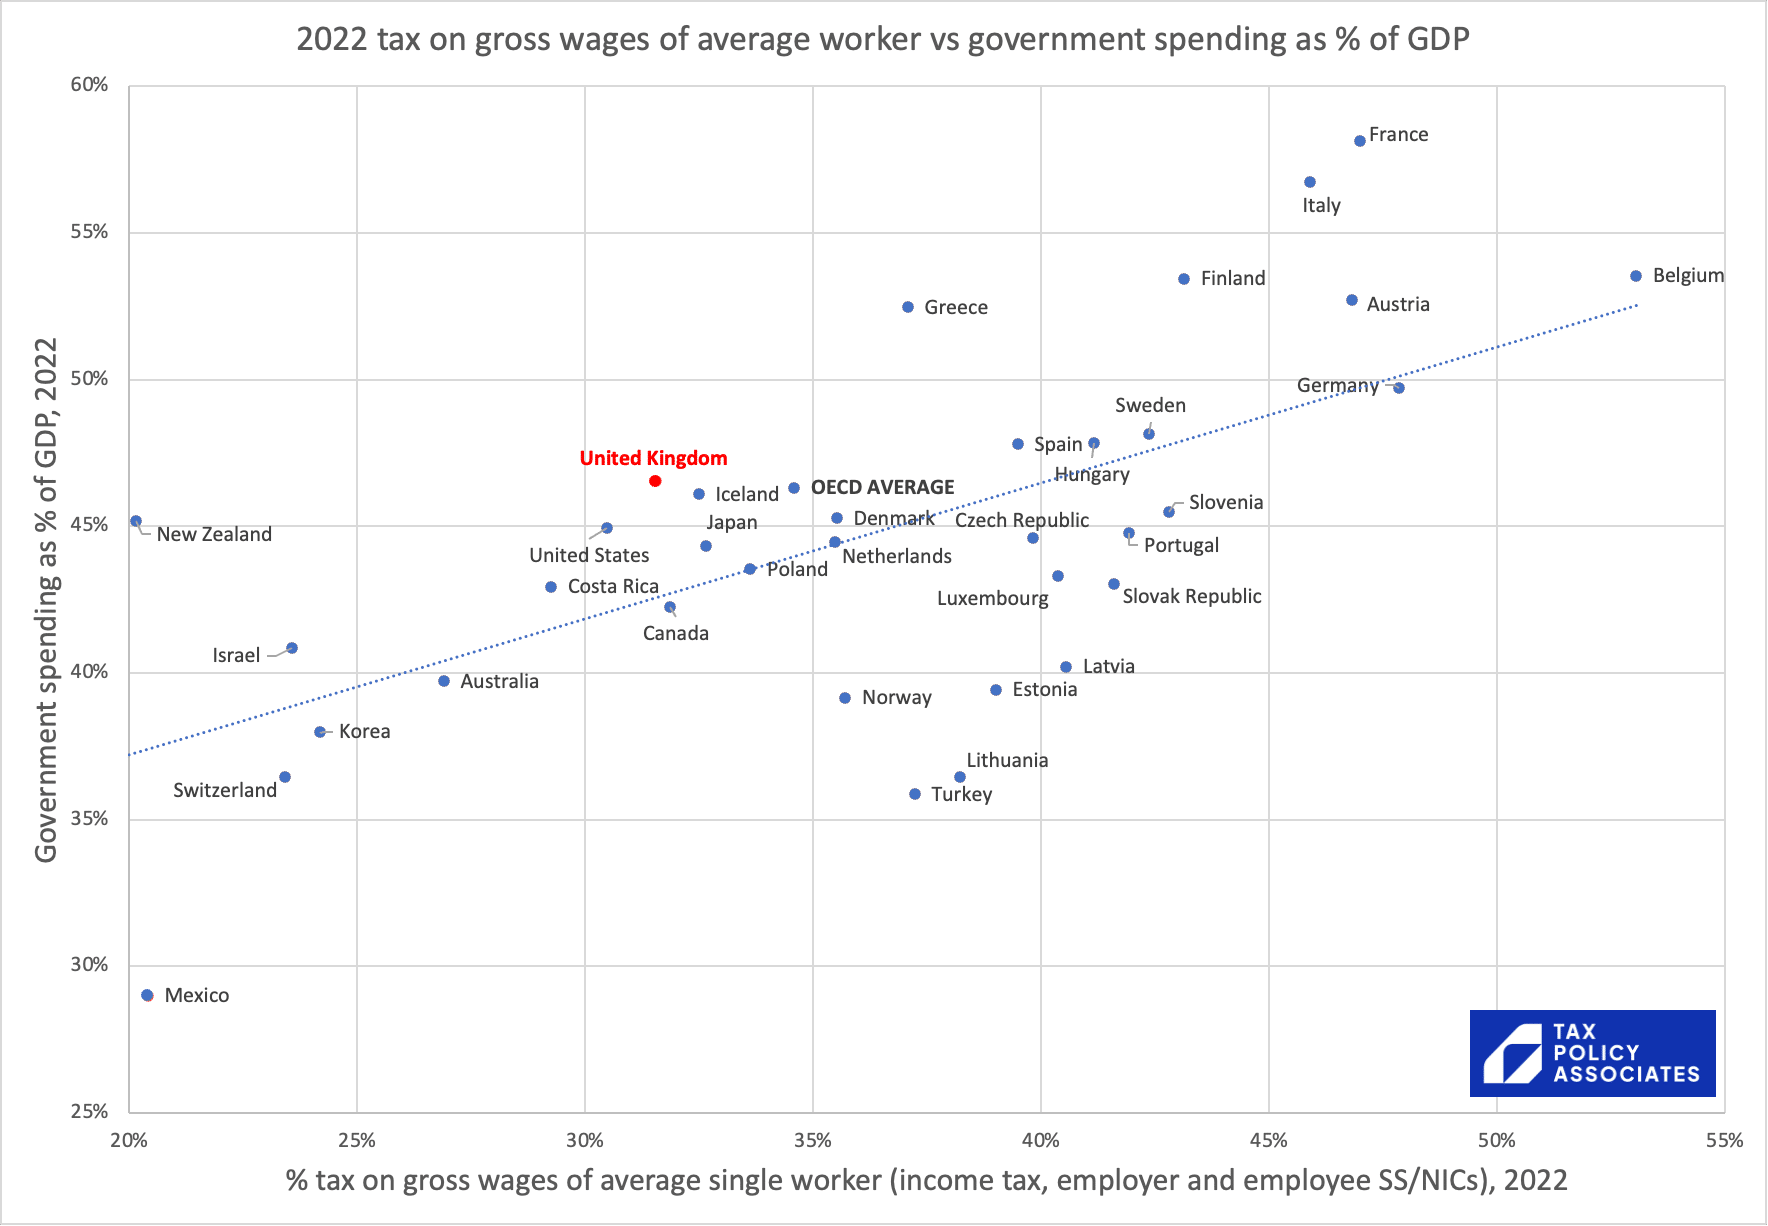
So in general terms, if you’re an average worker, you get what you pay for.
Or, if we want to annoy lots of people, we can point out that there’s no country where the average worker pays less tax than the UK on their wages, but which has higher government spending.
What about VAT?
If we just look at the standard rate of VAT in each country:
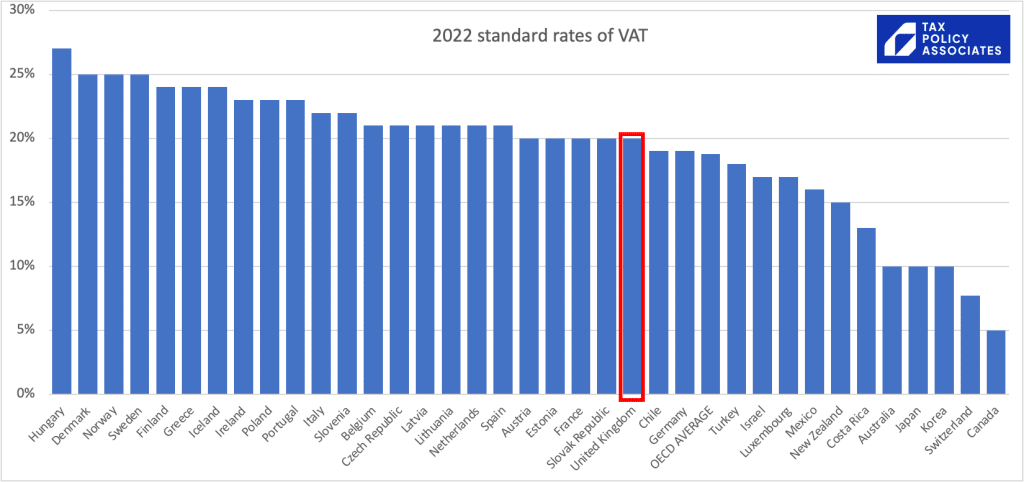
On the face of it the UK again looks very average.2
But we can’t just compare the standard rate. Some countries apply the standard rate to almost everything; others have widespread exemptions and special rates.
We can get a sense of this if we plot the rate of VAT against the amount of tax VAT collects, as a % of GDP:3
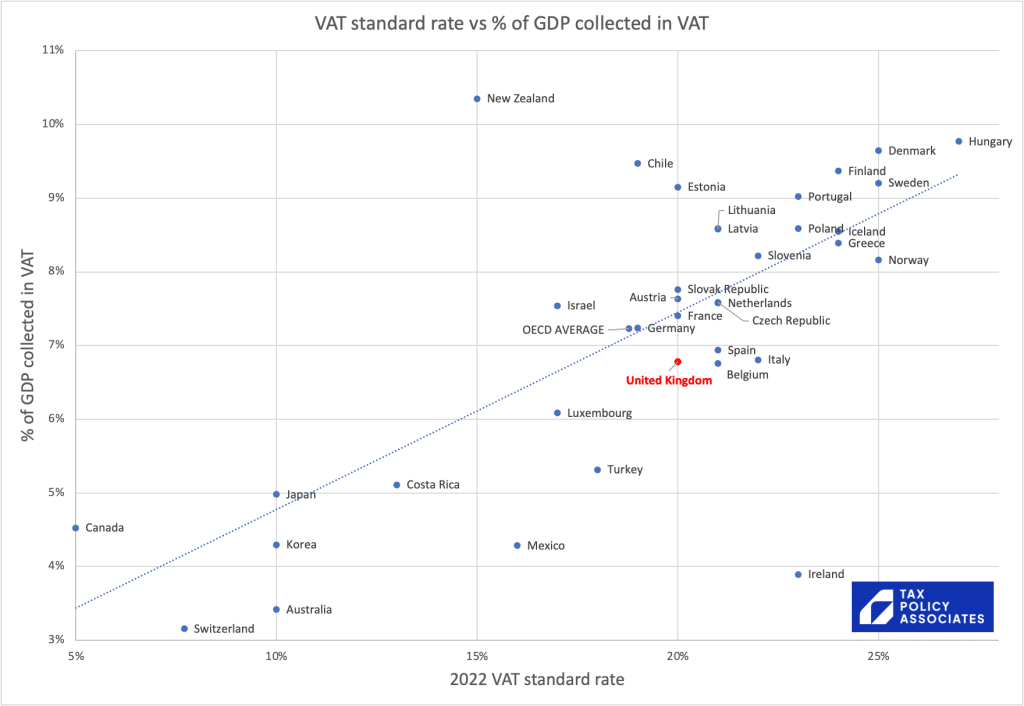
The chart suggests the UK collects a bit less VAT (as a % of GDP) than you might expect from its rate.4
The bottom line is that there is no evidence that the average Brit is over-taxed by international standards.
The spreadsheets with the data and charts are available here.
Footnotes
In other words, this takes into account the income tax and national insurance/social security paid by the worker him or herself, and also the national insurance/social security paid by the employer (because there is good evidence that in the long run this is economically paid by the employee in the form of reduced wages). ↩︎
There’s no USA on the chart, because the US has no VAT. Many states have sales taxes, but they’re nothing like VAT – the rate is much less (averaging around 5%) and the goods/services covered are much more limited. ↩︎
Bear in mind the usual caveats about comparing different systems in different countries, and (as usual) ignore Ireland, because its reported GDP is distorted by multinational [HQ locations]/[tax avoidance] (delete per your preference). ↩︎
Actually it’s worse than that, because VAT compliance in the UK is pretty good, and so masks what is a very limited VAT base (i.e. wide exemptions/lower rates) by international standards. Rita de la Feria, perhaps the world’s leading VAT academic, has written convincingly on this. ↩︎

The Scottish Budget – four thoughts on a tiny tax cut
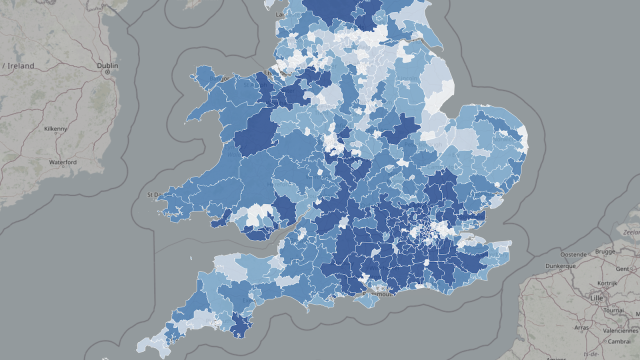
The mansion tax map: where the money comes from
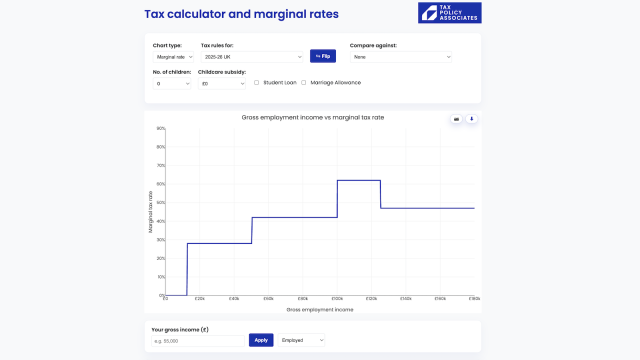
The Budget 2025 tax calculator
Are UK workers over-taxed? The answer in four infographics
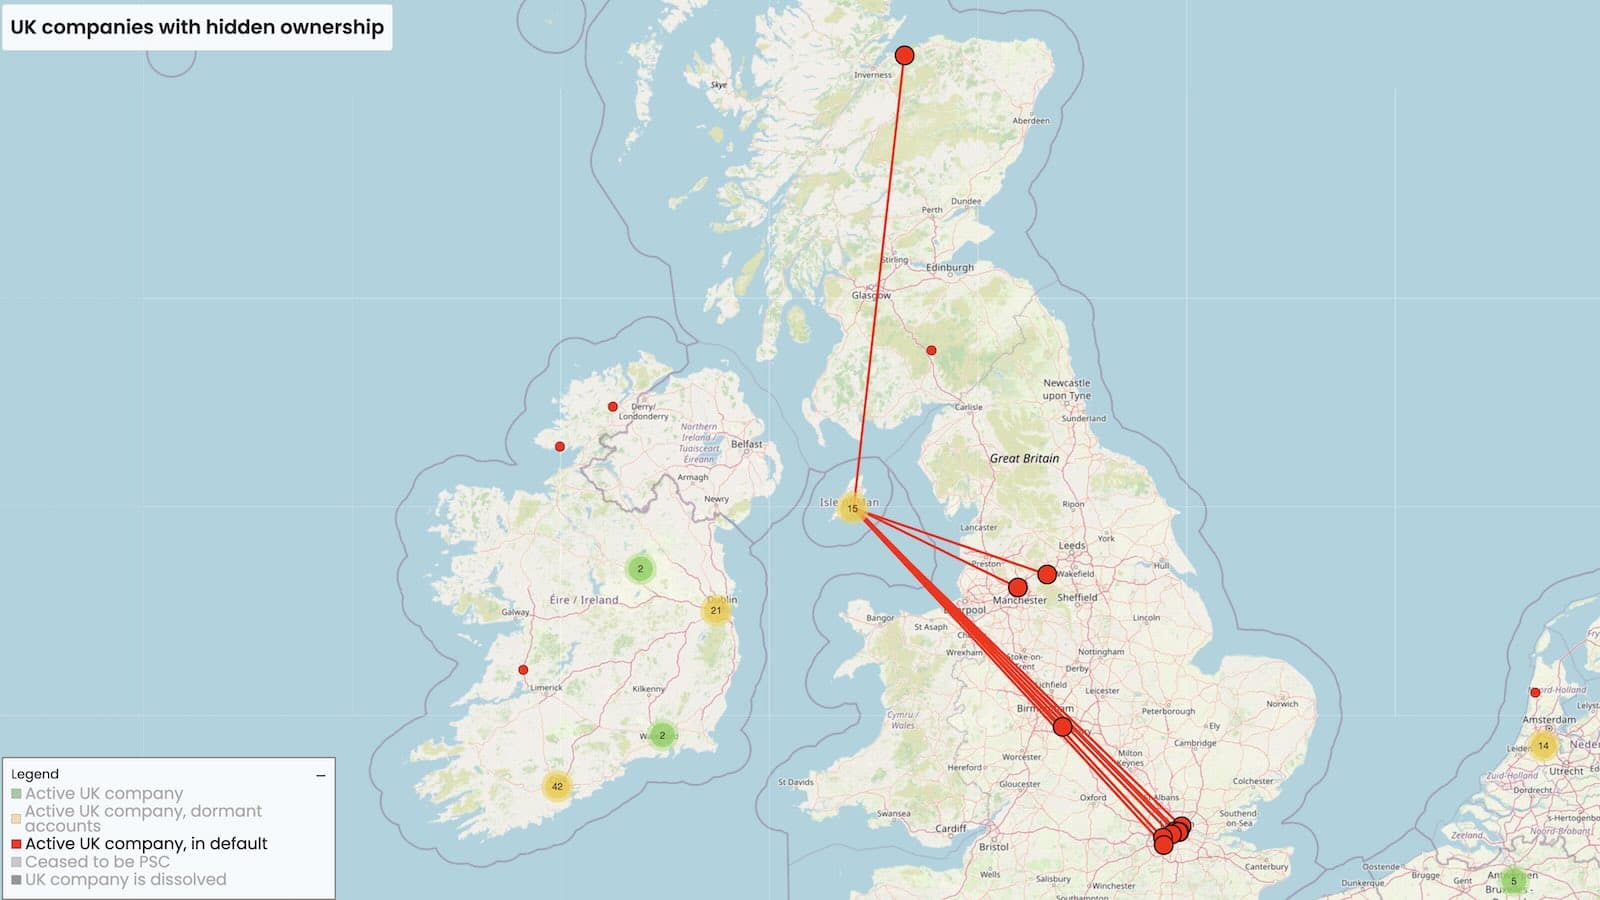
50,000 UK companies are unlawfully hiding their true owners
Leave a Reply to Chris Cancel reply