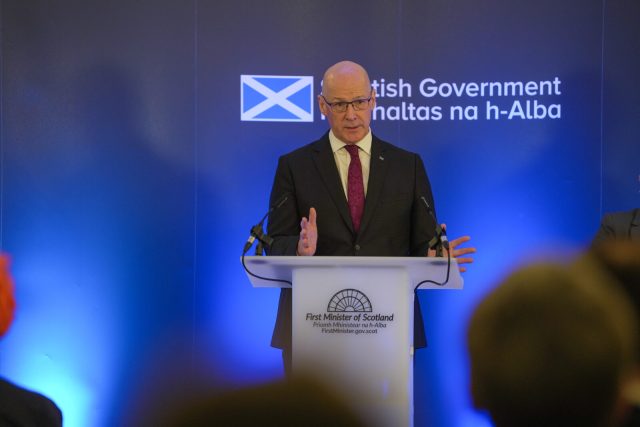

A Member of Parliament speaking at the dispatch box in the House of Commons: A man wearing glasses, a dark suit and tie speaks at the dispatch box, resting his hands upon it. The ceremonial parliamentary mace is positioned on the table in the foreground, with crowded green benches of listening Members of Parliament behind him.

The mini-Budget – is it true that the UK taxed high income more than other countries?

24 September 2022

6 Comments

In his Budget speech, the Chancellor said that the UK had a higher rate of tax on high incomes than Norway. Is that true? How does the UK compare to others; and how was that changed by the Budget?

How does the UK tax on high incomes compare with other countries? It’s a simple question – but not straightforward to answer.

One way is to look at the highest marginal rate of tax on high incomes. That looks something like this:

Bar chart comparing the highest marginal rate of income tax and employee national insurance/social security across the OECD, highlighting the UK's previous and proposed new rates: The UK's previous top marginal tax rate of 47% ranked in the middle of OECD countries at 19th highest. Under the proposed new rate of approximately 42%, the UK dropped to 25th highest, just below Switzerland and above Türkiye. Slovenia, Belgium, and Finland had the highest rates at around 60% or higher, while Estonia had the lowest at under 10%.

Highest marginal rate of income tax and employee national insurance/social security, across the OECD

Y-axis: 0% to 70% (increments of 10%)

Data (in descending order, values estimated from scale):
Slovenia: ~61%
Belgium: ~60%
Finland: ~59.5%
Portugal: ~58%
Japan: ~56%
France: ~55.5%
Denmark: ~55.5%
Austria: ~55%
Greece: ~53.5%
Canada: ~53.5%
Italy: ~53%
Ireland: ~52%
Korea: ~52%
Netherlands: ~51.5%
Israel: ~50%
Germany: ~47.5%
Luxembourg: ~47%
Australia: ~47%
UK - previous: ~47% (highlighted red)
Norway: ~46.5%
United States: ~46%
Spain: ~45.5%
Iceland: ~44.5%
Switzerland: ~41.5%
UK - new: ~42% (highlighted green)
Türkiye: ~41%
Chile: ~40%
Poland: ~39.5%
New Zealand: ~39%
Lithuania: ~39%
Slovak Republic: ~35%
Mexico: ~35%
Hungary: ~33.5%
Costa Rica: ~33.5%
Sweden: ~32%
Latvia: ~31.5%
Czech Republic: ~27.5%
Colombia: ~22%
Estonia: ~6%

Logo: TAX POLICY ASSOCIATES

But the rates alone are misleading. The biggest missing element is: when do the rates apply? The 37% top rate of Federal income tax in the US kicks in at $523,600. The top UK rate – now 40% – applies from £50k. So saying the UK rate is just a bit higher than the US rate misses the most important question: how much tax do people actually pay? What is the effective tax rate on any given income?

We can answer this given data for rates (taken from the wonderful OECD tax database), updated for the Budget changes, and calculate the overall effective rate of tax. on an employee – or the “tax wedge” for different multiples of average income in each country. See my previous post introducing this approach for more detail and a complete list of caveats and limitations. The updated code is here.

Here’s the chart comparing UK tax (before and after the mini budget) with the rest of the OECD, looking at incomes going up to 20 x average income. You can click on it for an interactive version that lets you select/deselect different countries:
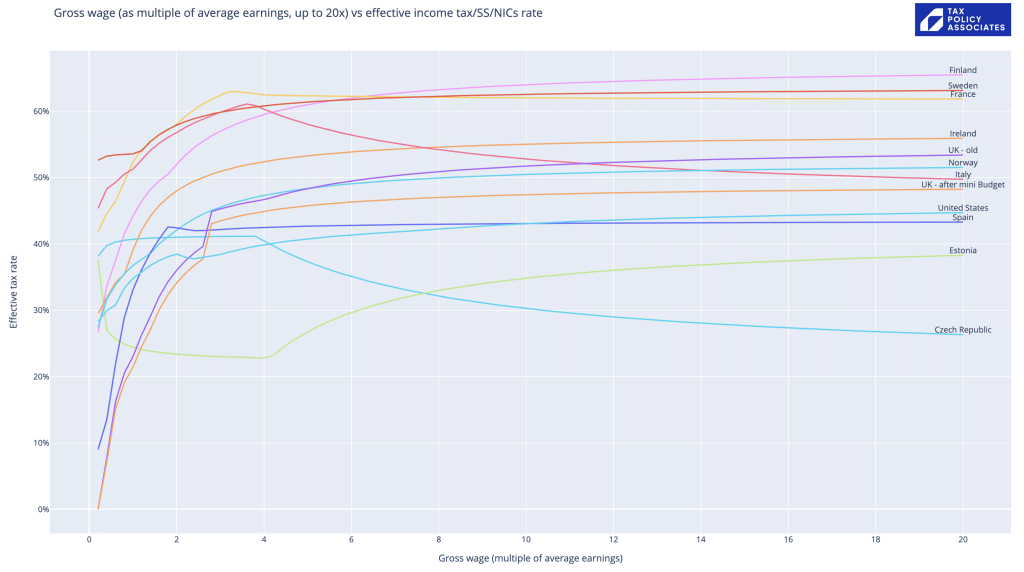
Line graph showing effective income tax and social security rates by multiple of average earnings across several OECD countries, including the UK before and after the mini-Budget: At high income levels up to 20 times average earnings, the UK's effective tax rate falls from around 53% under the old system to around 48% after the mini-Budget. This places the UK well below Finland (around 65%), Sweden (around 63%), France (around 62%), and Ireland (around 56%), and roughly level with or slightly below Norway (51%) and Italy (50%), but above the US (44.5%), Spain (43%), Estonia (38%), and the Czech Republic (26.5%).

Gross wage (as multiple of average earnings, up to 20x) vs effective income tax/SS/NICs rate
TAX POLICY ASSOCIATES

Y-axis: Effective tax rate (labelled 0%, 10%, 20%, 30%, 40%, 50%, 60%)
X-axis: Gross wage (multiple of average earnings) (labelled 0, 2, 4, 6, 8, 10, 12, 14, 16, 18, 20)

Series and approximate values at 20x average earnings:
Finland: ~65%
Sweden: ~63%
France: ~62%
Ireland: ~56%
UK - old: ~53%
Norway: ~51%
Italy: ~50%
UK - after mini Budget: ~48%
United States: ~44.5%
Spain: ~43%
Estonia: ~38%
Czech Republic: ~26.5%

It turns out the Chancellor was correct – the UK did have a higher rate of effective tax on someone earning 20x the average income (£500k), but (from April 2023) no longer will.

All in all, the UK has a rather average level of tax on high earners, compared with the rest of the OECD. By contrast, the UK taxes average income significantly less than the average. That’s something almost nobody believes – but it is nevertheless true. If you don’t believe my chart, here’s the OECD comparison for the average income:
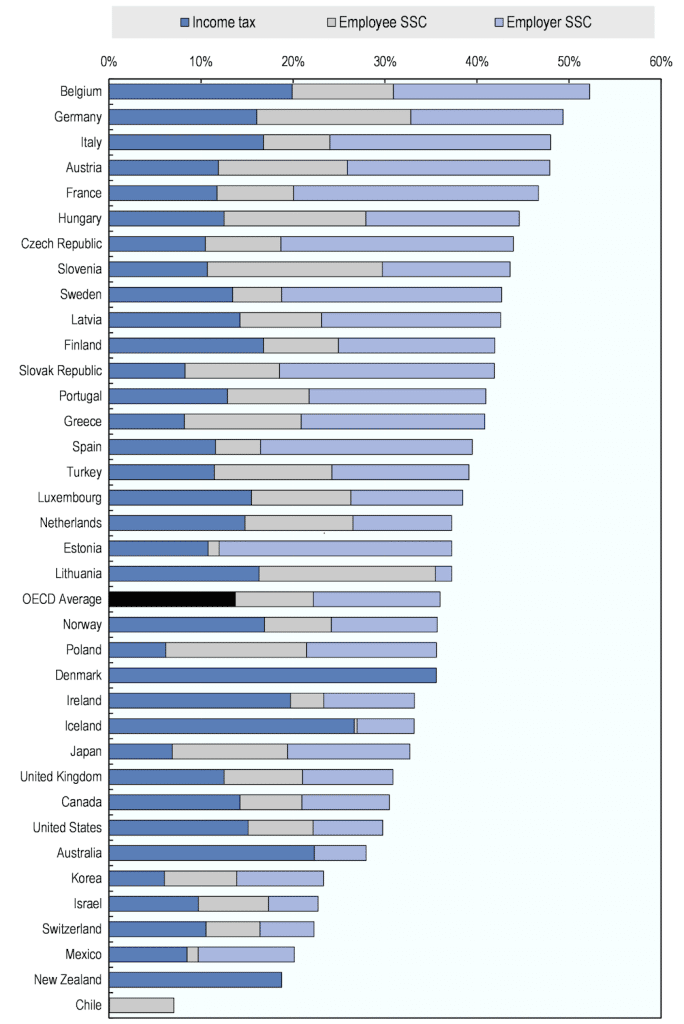
Horizontal stacked bar chart comparing labour taxes as a percentage of labour costs across OECD countries, broken down into income tax, employee SSC, and employer SSC: Belgium has the highest total tax wedge at around 52%, followed by Germany (49%) and Italy (48%), while Chile (around 7%) and New Zealand (around 19%) have the lowest. The United Kingdom ranks in the lower half with a total tax wedge of approximately 31%, well below the OECD average of around 35%.

Legend: Income tax (dark blue), Employee SSC (light grey), Employer SSC (light blue/lavender).
Horizontal axis: 0%, 10%, 20%, 30%, 40%, 50%, 60%.

Countries from highest to lowest total:
Belgium: Income tax ~20%, Employee SSC ~11% (to ~31%), Employer SSC ~21% (total ~52%)
Germany: Income tax ~16%, Employee SSC ~17% (to ~33%), Employer SSC ~16% (total ~49%)
Italy: Income tax ~17%, Employee SSC ~7% (to ~24%), Employer SSC ~24% (total ~48%)
Austria: Income tax ~12%, Employee SSC ~14% (to ~26%), Employer SSC ~22% (total ~48%)
France: Income tax ~12%, Employee SSC ~8% (to ~20%), Employer SSC ~27% (total ~47%)
Hungary: Income tax ~12.5%, Employee SSC ~15.5% (to ~28%), Employer SSC ~16.5% (total ~44.5%)
Czech Republic: Income tax ~10.5%, Employee SSC ~8% (to ~18.5%), Employer SSC ~25.5% (total ~44%)
Slovenia: Income tax ~10.5%, Employee SSC ~19% (to ~29.5%), Employer SSC ~14% (total ~43.5%)
Sweden: Income tax ~13.5%, Employee SSC ~5% (to ~18.5%), Employer SSC ~24% (total ~42.5%)
Latvia: Income tax ~14%, Employee SSC ~9% (to ~23%), Employer SSC ~19.5% (total ~42.5%)
Finland: Income tax ~17%, Employee SSC ~8% (to ~25%), Employer SSC ~17% (total ~42%)
Slovak Republic: Income tax ~8%, Employee SSC ~10.5% (to ~18.5%), Employer SSC ~23.5% (total ~42%)
Portugal: Income tax ~13%, Employee SSC ~9% (to ~22%), Employer SSC ~19% (total ~41%)
Greece: Income tax ~8%, Employee SSC ~13% (to ~21%), Employer SSC ~20% (total ~41%)
Spain: Income tax ~11.5%, Employee SSC ~5% (to ~16.5%), Employer SSC ~23% (total ~39.5%)
Turkey: Income tax ~11.5%, Employee SSC ~13% (to ~24.5%), Employer SSC ~14.5% (total ~39%)
Luxembourg: Income tax ~15.5%, Employee SSC ~11% (to ~26.5%), Employer SSC ~12% (total ~38.5%)
Netherlands: Income tax ~15%, Employee SSC ~11.5% (to ~26.5%), Employer SSC ~10.5% (total ~37%)
Estonia: Income tax ~11%, Employee SSC ~1% (to ~12%), Employer SSC ~25% (total ~37%)
Lithuania: Income tax ~16.5%, Employee SSC ~19% (to ~35.5%), Employer SSC ~1.5% (total ~37%)
OECD Average: Income tax ~14%, Employee SSC ~8% (to ~22%), Employer SSC ~14% (total ~36%)
Norway: Income tax ~17%, Employee SSC ~7.5% (to ~24.5%), Employer SSC ~11% (total ~35.5%)
Poland: Income tax ~6%, Employee SSC ~15.5% (to ~21.5%), Employer SSC ~14% (total ~35.5%)
Denmark: Income tax ~35.5%, Employee SSC 0%, Employer SSC 0% (total ~35.5%)
Ireland: Income tax ~20%, Employee SSC ~3% (to ~23%), Employer SSC ~10% (total ~33%)
Iceland: Income tax ~29.5%, Employee SSC ~0.5% (to ~30%), Employer SSC ~3% (total ~33%)
Japan: Income tax ~7%, Employee SSC ~12.5% (to ~19.5%), Employer SSC ~13% (total ~32.5%)
United Kingdom: Income tax ~12.5%, Employee SSC ~8.5% (to ~21%), Employer SSC ~10% (total ~31%)
Canada: Income tax ~14%, Employee SSC ~7% (to ~21%), Employer SSC ~10% (total ~31%)
United States: Income tax ~15%, Employee SSC ~7% (to ~22%), Employer SSC ~8% (total ~30%)
Australia: Income tax ~22.5%, Employee SSC 0%, Employer SSC ~5.5% (total ~28%)
Korea: Income tax ~6%, Employee SSC ~8% (to ~14%), Employer SSC ~10% (total ~24%)
Israel: Income tax ~9.5%, Employee SSC ~8% (to ~17.5%), Employer SSC ~6% (total ~23.5%)
Switzerland: Income tax ~10.5%, Employee SSC ~6% (to ~16.5%), Employer SSC ~7% (total ~23.5%)
Mexico: Income tax ~8.5%, Employee SSC ~1% (to ~9.5%), Employer SSC ~11% (total ~20.5%)
New Zealand: Income tax ~19%, Employee SSC 0%, Employer SSC 0% (total ~19%)
Chile: Income tax 0%, Employee SSC ~7%, Employer SSC 0% (total ~7%)

It shouldn’t be a surprise that the countries with more extensive welfare states than the UK have higher rates of tax on the average worker. By contrast, some of them tax higher earners more; some don’t. The thing is, whilst the level of tax on the rich is of huge political significance, it is not very significant to the public finances. The 45p rate which the Tories just abolished raised £2bn. Income tax as a whole raises £228bn. NHS spending is £136bn.

If we want a Scandinavian level of public services, then most people have to pay similar levels of tax to most people in Scandinavia. Sorry about that.


Footnotes

  1. The calculation realistically has to include employer national insurance and social security. Yes, it’s paid by the employer, and isn’t visible on our wage slip, but evidence suggests it is mostly borne by workers (i.e. because the employer has an amount they’re willing/able to pay as wages, and employer NICs come out of that). ↩︎

  2. i.e. because realistically you don’t compare taxes on £100k in the UK with £100k in Costa Rica; you should compare taxes on three times the average income in the UK with three times the average income in Costa Rica ↩︎
6 responses to “The mini-Budget – is it true that the UK taxed high income more than other countries?”

  1. Andrew Park avatar

    Very interesting.

    However, it does rather ignore the UK 60% effective rate on earnings between £100k and £125k as the personal allowance is withdrawn. That might seem trivial for people earning hundreds of £000s but it’s a real kick in the teeth to low high earners – including many doctors and head teachers – who scrape into or straddle it.

    1. Dan avatar

      Yes – that, plus the withdrawal of child benefit, plus the pension allowance taper, all create ridiculous and IMO damaging marginal rates. The personal allowance withdrawal is shown in my chart – it’s the visible kink in the effective rates. The other effects aren’t.

  2. Alex Quinn avatar

    Isn’t Norway a bit of a red herring though, given their sovereign wealth fund means they can have very high public spending without massive taxes? If you really want to compare the UK to a high welfare social democracy then Sweden or Finland would be more useful, which of course tax far more as per your graphs above.

    1. Dan avatar

      I’m not sure that’s right – my understanding is that the sovereign wealth fund covers future pension liabilities and not current expenditure. So unclear it affects the level of taxation *today* in Norway (although presumably it would affect the level of tax in the future). But I would certainly defer to anyone with specific knowledge.

      1. Alex avatar

        Fair enough, either way it’s a cherry picked example and the real surprise is how low the Norwegian tax burden is than how high the UK one is

  3. Rickard Israelsson avatar
    Rickard Israelsson

    Some great insights from you Dan. Of course being Scandinavian I’m used to high marginal tax and also enjoy the benefits of it personally and of course people in society at large, e.g. 14 months of paid parental leave per child.

    Anyhow, a small factual input: the highest margin tax in Sweden is 32% + 20% + 5% = 57% which kicks in around 60 thousand GBP per year.

    In terms of the tax wedge it’s also much higher for the employer cf the UK ~10%, so a Swedish employer pays 31,42% social benefits contribution from the first Swedish “krona” and with no upper boundary.

    Keep up the good work!

Leave a Reply

Your email address will not be published. Required fields are marked *