It’s the UK’s biggest and least discussed tax problem. There’s between £30bn and £48bn missing from each year’s small business tax bills. It’s been getting worse – and nobody knows why.
There’s no other issue where so much money is at stake but so little time is spent discussing it. It’s almost never mentioned by politicians, and HMRC devotes very limited resources to it. HMRC’s random audit programme checks only 330 small companies each year.
HMRC made spectacular progress on the large business corporation tax gap in the 2000s. If they made the same progress on the small business corporation tax gap, it would raise around £15bn. That revenue could be used to reduce the main rate of corporation tax down to 21%, benefiting all businesses. Or it could cover, for example, a major expansion in defence spending. And corporation tax is only part of the small business tax gap.
We shouldn’t just focus on numbers – there’s a fairness problem too. I receive emails every week from honest businesspeople furious that they’re undercut by competitors who don’t pay their tax. It’s an unfair playing field, tilted against the people doing the right thing.
This should be a cause tailor-made for a politician looking to show they stand for both fairness and business. It’s pro-enterprise and pro-fairness at the same time – and would be applauded by all the small businesses currently being ripped off by their less scrupulous competitors.
The first step is easy, uncontroversial and cheap. Push HMRC to properly resource and expand its random audit programme. Until we know what’s going on, we can’t fix it. And tens of billions of pounds will continue to vanish every year.
What is the tax gap?
HMRC’s provisional estimate for the 2024/25 tax gap is £59.2 billion, or 6.4% of all the tax theoretically due.1
Over the long term the tax gap has fallen significantly in percentage terms.2 Since 2017, however, progress has stalled or slightly reversed:
Who’s responsible for the tax gap?
It’s a common belief that most of the tax gap is caused by big business and the very wealthy avoiding tax. This is doubly wrong: only a small proportion of the tax gap relates to tax avoidance, and only a small proportion of that relates to either big business or the very wealthy.
What behaviour?
Most of the tax gap is people making bad mistakes – “failure to take reasonable care” at £20.8 billion – followed by error and evasion. Tax avoidance is the smallest category of all, at under £1 billion:
The avoidance tax gap has been shrinking for years, with income tax, NICs and CGT avoidance having fallen from £1.5bn in 2005/06 to around £0.2bn.
What tax?
The tax gap across most taxes has fallen over the long term – the fall in the VAT tax gap has been particularly dramatic. But corporation tax has gone the other way:
Which taxpayers?
The most significant contribution to the tax gap, by far, is from small businesses:
The wealthy make up only around 6%, and large businesses 12%.3
Two important definitions: “Small” here means turnover under £10m and fewer than twenty employees.4. “Criminals” here means criminal attacks on the tax system, for example organised criminal groups fraudulently claiming VAT refunds to which they are not entitled.
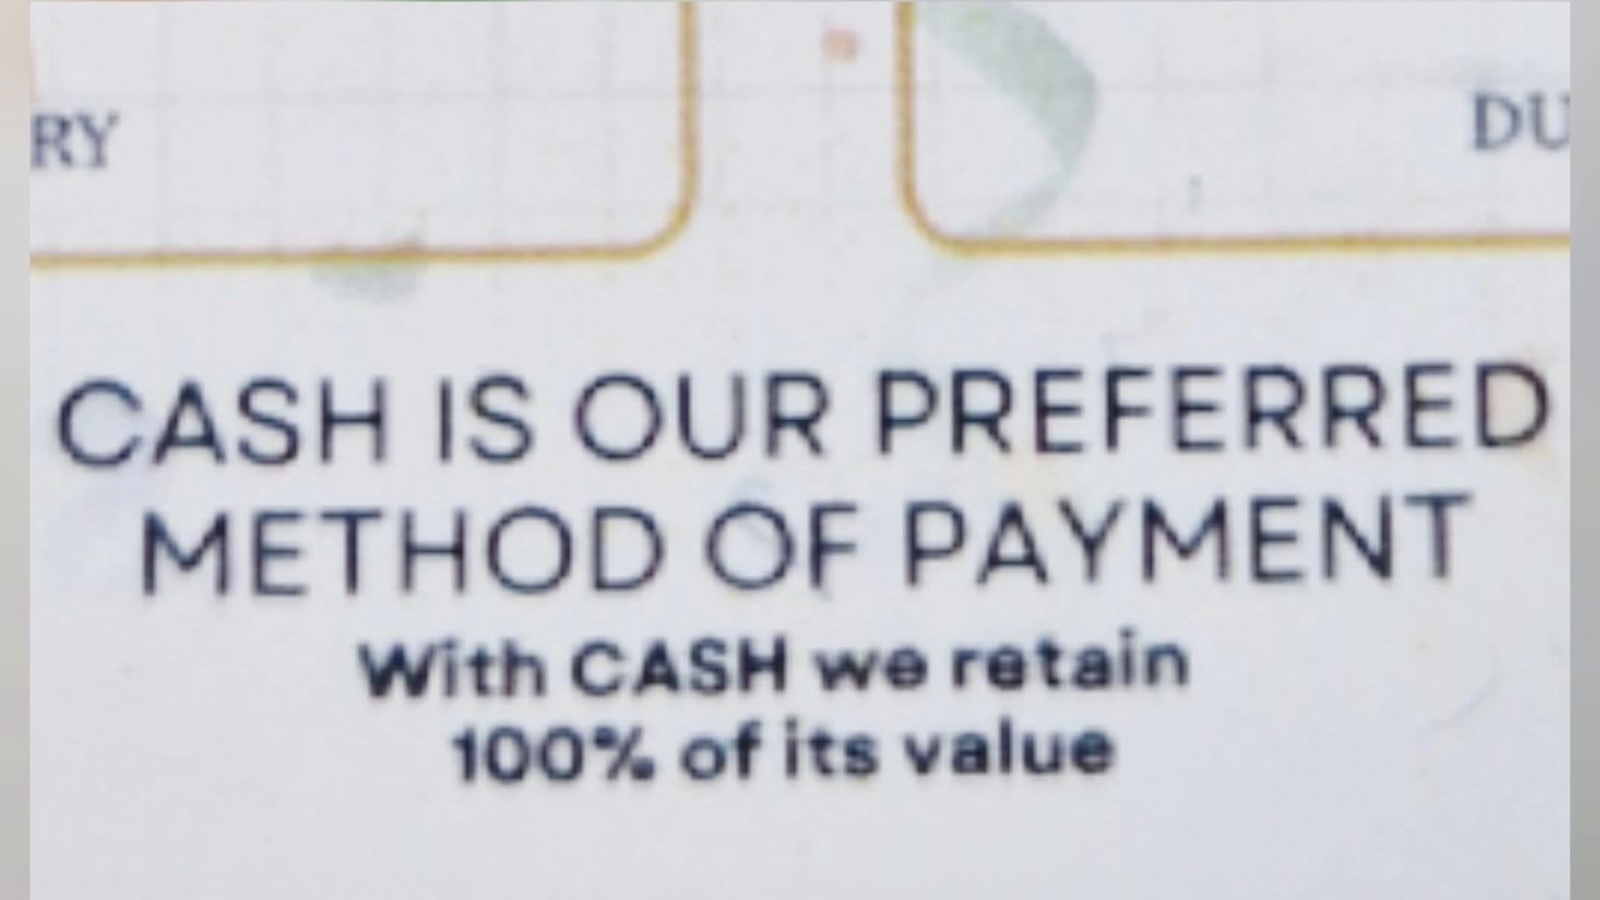
The importance of small business in the statistics is not new – small businesses have always been the most likely to pay the wrong tax, with the “man in a van” receiving payment in undeclared cash being a cliché for good reason. What’s new is that the small business share of the tax gap has risen relentlessly, from under a third in 2005/06 to nearly two-thirds today:
The small business problem
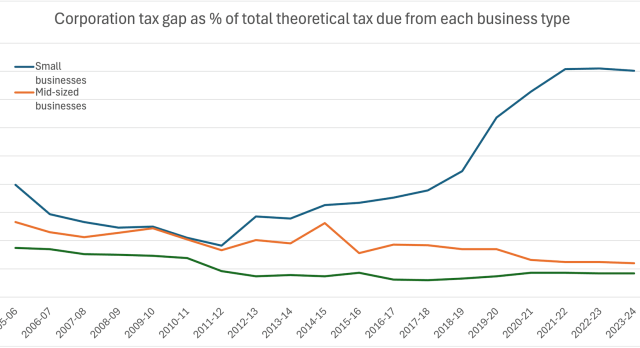
The main driver of the escalating red line in the chart above is the small business corporation tax gap.
This chart shows that gap as a percentage of tax due. 45% of the corporation tax due from small businesses goes uncollected, against around 6% for mid-sized businesses and 4% for large ones:
Before we go into the data further, it is important to note its limitations:
- There are about two million small companies required to file a corporation tax return, but HMRC undertakes only 330 random audits per year. That is an astonishingly small figure, and it means that there is a very large statistical margin of error on numbers derived from those audits. I’ll show that in the charts below as a coloured band surrounding the lines.5
- The red line in the chart below gives an illusion of certainty but is smoothed by reference to previous years’ results – so it would be wrong to assume the smoothness of the line equates to stability of behaviour.6
- It takes time for HMRC to establish the results of its random audits, so there is no data yet from the audits for 2023/24 and 2024/25. HMRC projects its figures forward by “keeping the percentage gross tax gap constant” and rescaling by actual liabilities (methodological annex; “Measuring tax gaps 2026 edition”, Corporation Tax chapter). The apparent stability of the last two years is therefore not a real effect. When HMRC has later replaced such projections with real sample data, the revisions have generally been upward — the 2018/19 to 2022/23 figures were all revised up as random-enquiry data came in, “identifying greater non-compliance than previously forecast”.
Andy Summers and Arun Advani of CenTax have written more about these issues.
There’s another problem: random audits won’t pick up businesses that are completely off HMRC’s radar, for example, individuals who have never submitted a tax return or companies that claim to be dormant when they aren’t. HMRC attempts to estimate the tax loss in these cases as part of its “shadow economy” work. This is, however, subject to very significant uncertainty.
All of this means that it’s simplistic to say the small business corporation tax gap is 44%. It’s actually somewhere between 28% and 72% (and more, if we take the shadow economy into account). That’s an extraordinarily large range – it’s surprising that billions of pounds of revenue are resting on so limited an audit programme.
Corporation tax is the biggest part of the small business problem, but not all of it. Across all taxes, small businesses fail to pay a central estimate of around £37 billion a year — and, carrying through the same uncertainty, the true figure is somewhere between £30 billion and £48 billion.7
The divergence between the small business tax gap and the others is a fairly recent development, starting in about 2015:
If we put this in cash terms, then the gap between the small business tax gap and other tax gaps becomes even more stark:
Ordinarily we’d expect that if (as the data shows) the amount of non-compliance increased threefold, HMRC’s compliance yield would also increase. But it hasn’t – it’s flatlined:
What is the cause?
I and many others have asked HMRC what is going on, and there haven’t been many satisfactory answers. One explanation, which is detailed in the report, is that there was a change in the way they collected data in 2019-20. The tax gap report says there is:
“emerging evidence that the small businesses Corporation Tax gap may be understated for years before 2019 to 2020, and therefore may not be directly comparable to later years…
[the changes over time] may reflect both improved measurement and changes in underlying behaviour, which cannot be robustly separated using current data”
It is, however, clear from the chart that the increase in 2019/20 continued in the next two years, with a particularly sharp increase in 2021/22. So the methodological change can be only part of the explanation for what’s happening. And the apparent stability in 2023/24 and 2024/25 is because (as mentioned above) there is no audit data for subsequent years, and so HMRC simply assume present trends continue.
There’s little else to go on in the data. We can see that the proportion of small companies filing corporation tax returns with under-declared liability rose from 20% in 2018/19 to 55% in 2022/23 — and the proportion of small businesses whose returns show significant errors (over £1,000) has gone up sharply:
There is a similar trend for unincorporated businesses (sole traders paying income tax under self assessment):8
If this were simply a post-Covid effect we would expect to see it for individuals too. We don’t: the proportion of individuals (non-business taxpayers) under-declaring by more than £1,000 has been broadly flat.
But these tell only part of the story because they’re looking at cases where businesses filed tax returns with under-declared income. The other part is cases where businesses simply don’t file tax returns at all.
I have no data on this, but I do have anecdotes. I often receive reports from accountants telling me that they see widespread failure to pay tax by small businesses.
Here’s a recent example (shared with the author’s kind permission):
I work at a company that offers a service for filing corporation tax returns for micro companies and we’re seeing something that may deserve some attention.
Since the HMRC corporation tax filing service closed at the end of March, we’ve had a small number of companies approaching us to migrate to our service. To ensure the migration works correctly we ask for their latest tax computation to ensure balances migrate correctly.
A significant number of the companies turn out to have been filing dormant or no corporation tax returns for years – sometimes many years when upon further questioning it turns out they were actually trading, so they have no tax computations to produce. They filed dormant and HMRC either stopped chasing them or sent tax estimates, and it just… carried on.
These aren’t sophisticated tax avoiders. Most of them seem genuinely confused or burying their head in the sand if they indicate they have received tax estimations from HMRC. But the practical effect is the same: trading income going unreported, sometimes for a long time.
The CATO [HMRC online filing] closure is flushing this out because for the first time these companies are having to engage a software provider or accountant who asks the right questions. But the compliance gap was there long before March 2026, the closure has just made it visible.
There are other theories, all reasonably plausible, but none backed by hard evidence:
- A decline in HMRC customer service to small companies.
- The decision by many mid-tier accounting firms to chase more profitable work, which often means stopping working for small businesses.
- A “tax strike” by small businesses who feel overtaxed – and some evidence suggests it’s part of the “cost of living crisis”.
- An upsurge in “avoidance” which is realistically evasion, technically allocated to small companies but not “small businesses” in any real sense. The National Audit Office has identified “significant weaknesses” in tackling evasion.
- The rise in “phoenixism” – small businesses going into administration and the founders then restarting under a new name, leaving HMRC out of pocket. This has been reported to cost £800m of tax each year, but insolvency specialists we spoke to think the problem is much bigger than that.
What Andy Burnham should do
Right now, nobody can close the small business tax gap – because we don’t understand what it is.
If I was Andy Burnham, I’d devote resources to this mystery commensurate with the billions of pounds at stake. A special working group headed by an experienced (near-retirement or recently retired) HMRC officer, and reporting directly to a minister. Revisit past random audits. Prioritise the follow-up on recent audits where we don’t yet have outcomes and figures. And for future years, target thousands of audits, not 330.
It’s boring, technical, unsexy work that will have nothing to show for it for months – and perhaps no solid answers for years.
But before politicians ask taxpayers for more, they should find out why so much tax already owed is missing.
Image courtesy of Rita de la Feria.
Many thanks to K and C for their help with the statistics in this article, and to Andy Summers and Arun Advani for highlighting the limited audit figures, and for their tax gap work in general.
The small business tax crisis: 40% of tax due isn’t paid

HMRC’s failure to close the small business tax gap costs £15bn/year
Is there a tax avoidance magic money tree?

John Healey should cut National Insurance, not raise the personal allowance
What would a land value tax actually do?
What if Andy Burnham lowered the mansion tax threshold to £1.5m?
Footnotes
It is occasionally claimed that the real tax gap is much higher, and HMRC misses it because of some combination of incompetence and conspiracy. We don’t take these claims very seriously. There are a large number of uncertainties, but HMRC’s tax gap work is generally regarded as world-leading (but see below for one area where it falls behind). The claims in the mid-2000s of a hidden tax gap of more than £120bn were never credible because (given tax avoidance/evasion by employees is in practice rarely possible) they implied that the self-employed were evading tax on an extremely high percentage of their income. ↩︎
Cash numbers are misleading given inflation and GDP growth ↩︎
There are certainly potential areas where there can be undercounts on both these figures, and in particular:
- “Unknown unknowns” could mean the figure for the wealthy is being undercounted, but the number of seriously wealthy people is sufficiently small that our experience is that HMRC has a reasonable good handle on their behaviour – the small numbers mean this is one of the easiest areas for HMRC to track.
- Evasion using offshore structures, offshore accounts and/or undisclosed offshore real estate and unregistered assets is hard to estimate, but the evidence this is a large factor is unpersuasive (given the limited additional revenue that followed the introduction of automatic cross-border reporting).
- The figures don’t include large business avoidance using offshore structures that are compliant with the rules (because if compliant it is not classed as “avoidance”). However successive anti-avoidance rules, both international and domestic, mean the scope for large business to use loopholes is much smaller than it was in the 2000s and early 2010s.
It’s therefore my view that the impact of these items is relatively limited. ↩︎
this is HMRC’s own administrative definition and doesn’t relate to the usual Companies Act “small business” concept. ↩︎
For the corporation tax gaps, the bands are HMRC’s own published upper and lower estimates, derived from its random enquiry programme and adjusted for undetected non-compliance (“Measuring tax gaps 2026 edition”, Tables 5.2, 5.4 and 5.5, and methodological annex paragraph B26). For the chart showing the proportion of companies under-declaring, HMRC publishes no interval, so the band is my own approximate 95% binomial interval based on HMRC’s published sample size of around 330 random corporation tax audits a year (methodological annex, Table H.3); it ignores HMRC’s stratification, which would narrow it slightly. The bands reflect sampling error only — they do not capture other sources of error such as the modelling assumptions, the projection of the most recent years, or the comparability break discussed below. Some charts carry no band at all, either because no interval is published (VAT and the other taxes, which use different methods) or because HMRC says the uncertainty “cannot be quantified” (the breakdown by behaviour). ↩︎
HMRC does not publish a fresh, independent estimate for each year. Because the annual random sample is small and the amount of under-declared tax varies enormously from case to case, it smooths the small business Corporation Tax series using a rolling multi-year average. For the closely related Self Assessment small-partnership series it describes the technique as a “three-year moving average with a double weighting given to the current year”, which makes the estimates “less susceptible to sampling variability and more indicative of longer-term trends” (methodological annex, paragraphs H25–H26 and H15). Because each plotted point is an average of several years’ audits, neighbouring points share most of their data and cannot move independently — so the line looks far smoother, and more certain, than the underlying handful of audits can justify. The shaded band is the better guide to how uncertain the level really is. ↩︎
This is the small business share of the total tax gap, across all taxes. HMRC’s central estimate is that small businesses account for 62% of the £59.2 billion 2024/25 gap — about £36.7 billion (online tables, Table 1.3). The range reflects the uncertainty in its largest and least certain component: HMRC’s published 95% confidence interval for the small business corporation tax gap runs from £10.9 billion to £28.3 billion, around a central estimate of £17.3 billion (online tables, Table 5.2). Applying that interval, and holding the other small business taxes (VAT, PAYE, Self Assessment and the rest — together about £19 billion) at their central values, gives a total of roughly £30 billion to £48 billion. This is approximate and, if anything, understates the width, because those other components carry their own (smaller) uncertainty; the corporation tax gap dominates it. ↩︎
The same statistical health warnings apply here as to the corporation tax figures. The Self Assessment business tax gap is estimated from a small random enquiry programme, smoothed with a multi-year rolling average, and the most recent years are not sampled at all but projected forward by holding the percentage gap constant (methodological annex, Chapter H). If anything the Self Assessment sample runs even further behind — in the previous edition the latest year actually sampled was 2021/22 — so the level, and the last few years’ apparent trend, should be treated with as much caution as the corporation tax numbers above. ↩︎
Leave a Reply