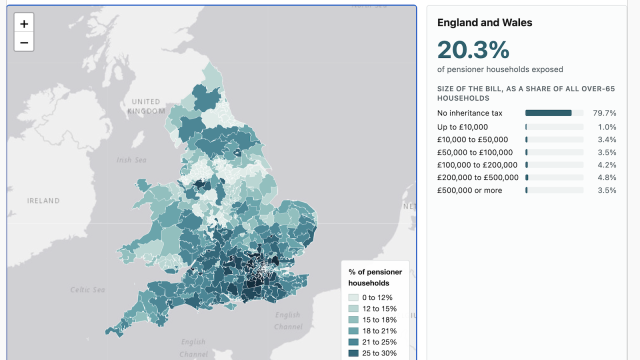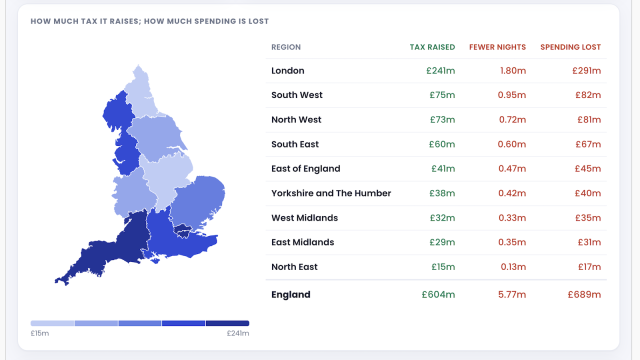
Digital rendering of planet Earth viewed from space: Planet Earth is depicted against the dark backdrop of space, with bright sunlight highlighting its curved right edge in a glowing blue arc. Swirling white clouds and textured landmasses are visible across the ocean, while the left side fades into deep shadow dotted with a few faint stars.

Updated: do Brits pay more or less tax on our wages than people in other countries?

17 December 2022

8 Comments

How do UK/Scottish taxes on wages compare with other countries’? It’s a simple question – but not straightforward to answer.

Looking just at rates is misleading. This chart, for example, suggests that the top rate of UK tax is comparable with the US. That’s not really right. In the US, the top rate of Federal income tax (and, often, state income tax) kicks in at $523,600. The top UK rate – now 45% – applies from £125,140. So for most reasonably high-earning people, tax rates in the US are significantly less.

Bar chart of the highest marginal rate of income tax and employee NI/SS on wages across OECD countries, with UK rates updated to 2023/24: The highest marginal rate ranges from over 60% in Slovenia and Belgium down to around 5% in Estonia. Scotland (around 49%) and the UK excluding Scotland (47%) sit in the middle of the distribution, lower than countries such as France, Japan and Ireland, but higher than the US, Switzerland and Sweden.

Highest marginal rate of income tax and employee NI/SS on wages, across the OECD
(UK rates updated to 2023/24)
[Tax Policy Associates logo]

Y-axis: 0%, 10%, 20%, 30%, 40%, 50%, 60%, 70%

Countries and approximate values:
Slovenia: ~61%
Belgium: ~60%
Finland: ~59%
Portugal: ~58%
Japan: ~56%
France: ~55%
Denmark: ~55%
Austria: ~55%
Greece: ~54%
Canada: ~53%
Italy: ~53%
Ireland: ~52%
Korea: ~52%
Netherlands: ~51%
Israel: ~50%
Scotland: ~49% (highlighted in bright red)
Germany: ~47%
Luxembourg: ~47%
Australia: ~47%
UK - ex Scotland: ~47% (highlighted in dark red)
Norway: ~46%
United States: ~46%
Spain: ~45%
Iceland: ~44%
Switzerland: ~42%
Türkiye: ~41%
Chile: ~40%
Poland: ~40%
New Zealand: ~39%
Lithuania: ~39%
Slovak Republic: ~35%
Mexico: ~35%
Hungary: ~33%
Costa Rica: ~33%
Sweden: ~32%
Latvia: ~31%
Czech Republic: ~27%
Colombia: ~22%
Estonia: ~5%

A better question is, what’s the effective tax rate – the “tax wedge” on any given amount of income?

My answer is this chart – and you can click on it for an interactive version that lets you add/remove countries:
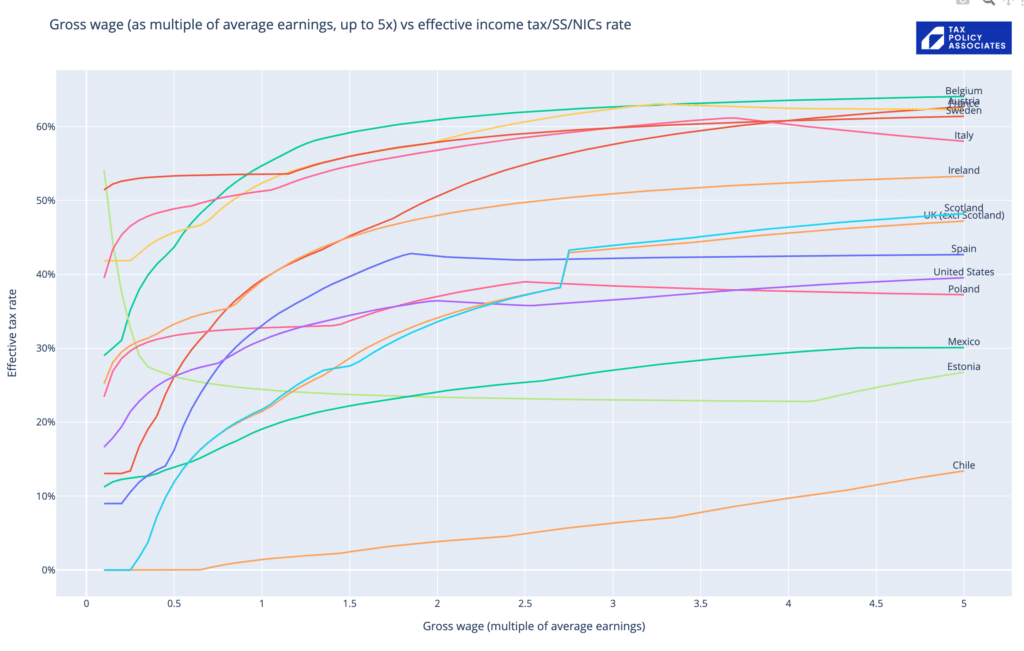
Line chart comparing effective income tax, social security and national insurance rates against gross wage as a multiple of average earnings up to 5x across selected OECD countries: At average earnings (1x), the UK (excl Scotland) and Scotland have an effective tax rate of approximately 22%, which is significantly lower than most European nations shown. At higher earnings (5x average wage), UK and Scottish rates rise to approximately 48%, remaining well below countries such as Belgium, Austria, France, Sweden, and Italy (58% to 64%), but above the United States, Spain, Poland, Estonia, Mexico, and Chile.

Gross wage (as multiple of average earnings, up to 5x) vs effective income tax/SS/NICs rate

TAX POLICY ASSOCIATES

Y-axis: Effective tax rate (0% to 60%)
X-axis: Gross wage (multiple of average earnings) (0 to 5, at 0.5 intervals)

Countries and approximate effective tax rates at 5x average earnings:
- Belgium: ~64%
- Austria: ~63%
- France: ~62.5%
- Sweden: ~62%
- Italy: ~58%
- Ireland: ~53.5%
- Scotland: ~48.5%
- UK (excl Scotland): ~48%
- Spain: ~47%
- United States: ~42.5%
- Poland: ~39.5%
- Unlabelled pink line: ~37%
- Mexico: ~30%
- Estonia: ~26.5%
- Chile: ~13%

Some immediate conclusions:

  • The UK/Scotland has a much lower effective tax rate on average wages, and lower than average wages, than almost every other developed country.
  • This then starts catching up quite quickly once we approach twice the average wage. And once we’re on high incomes, UK effective rates look a bit more average. Less than the expansive Continental welfare states. More than smaller countries, the US, and other countries with much less generous welfare states.
  • So a good case can be made that the UK is undertaxed by international standards. That’s not something many people in the UK believe, but it doesn’t stop it being true…

Quick notes on where the data in the chart comes from:

  • The chart is generated by some simple code, that takes worldwide data for tax rates and threshold (from the wonderful OECD tax database), applies it to different income levels.
  • The effective tax rates include employer national insurance/social security. We don’t see employer wage taxes in our wage slips, but evidence suggests it is mostly borne by workers.
  • The x axis isn’t an absolute dollar amount, as realistically we can’t compare taxes on £100k in the UK with £100k in Costa Rica. Instead, the x axis is a multiple of average wages – so we are comparing tax on (e.g.) the UK average wage with tax on the Costa Rican/French/etc average wage.
  • The chart doesn’t take account of tax reliefs/deductions – these are generally quite limited in Europe, but very generous in the US… so again the chart overstates the actual tax Americans pay.
  • The data is now updated for the 2023/24 UK and Scottish rates, but other countries are not updated (I have no good source for the data). Given the wider economic circumstances, it’s plausible that taxes will be going up worldwide, and so this chart may make the UK/Scotland rates look relatively higher than they actually are.
  • See my previous post for more detail on the methodology and a complete list of caveats and limitations.

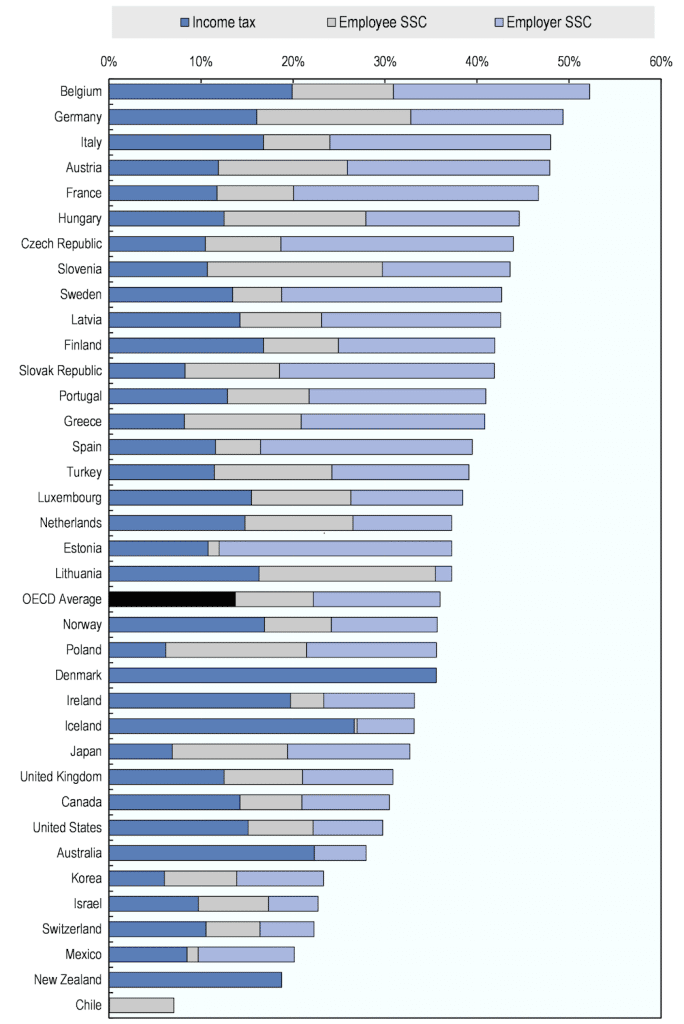
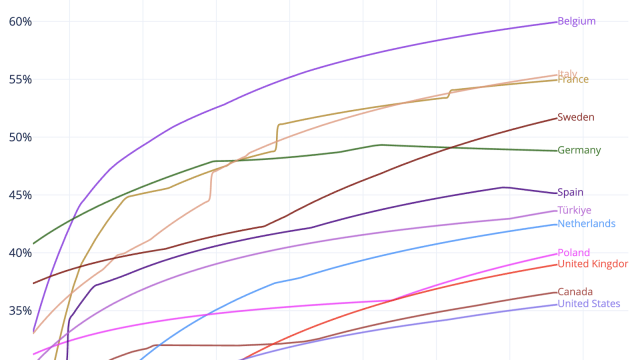
And if you don’t want to believe my chart, here’s the OECD’s own chart showing the effective rate of tax on average incomes:

Horizontal stacked bar chart comparing labour taxes as a percentage of labour costs across OECD countries, broken down into income tax, employee SSC, and employer SSC: Belgium has the highest total tax wedge at around 52%, followed by Germany (49%) and Italy (48%), while Chile (around 7%) and New Zealand (around 19%) have the lowest. The United Kingdom ranks in the lower half with a total tax wedge of approximately 31%, well below the OECD average of around 35%.

Legend: Income tax (dark blue), Employee SSC (light grey), Employer SSC (light blue/lavender).
Horizontal axis: 0%, 10%, 20%, 30%, 40%, 50%, 60%.

Countries from highest to lowest total:
Belgium: Income tax ~20%, Employee SSC ~11% (to ~31%), Employer SSC ~21% (total ~52%)
Germany: Income tax ~16%, Employee SSC ~17% (to ~33%), Employer SSC ~16% (total ~49%)
Italy: Income tax ~17%, Employee SSC ~7% (to ~24%), Employer SSC ~24% (total ~48%)
Austria: Income tax ~12%, Employee SSC ~14% (to ~26%), Employer SSC ~22% (total ~48%)
France: Income tax ~12%, Employee SSC ~8% (to ~20%), Employer SSC ~27% (total ~47%)
Hungary: Income tax ~12.5%, Employee SSC ~15.5% (to ~28%), Employer SSC ~16.5% (total ~44.5%)
Czech Republic: Income tax ~10.5%, Employee SSC ~8% (to ~18.5%), Employer SSC ~25.5% (total ~44%)
Slovenia: Income tax ~10.5%, Employee SSC ~19% (to ~29.5%), Employer SSC ~14% (total ~43.5%)
Sweden: Income tax ~13.5%, Employee SSC ~5% (to ~18.5%), Employer SSC ~24% (total ~42.5%)
Latvia: Income tax ~14%, Employee SSC ~9% (to ~23%), Employer SSC ~19.5% (total ~42.5%)
Finland: Income tax ~17%, Employee SSC ~8% (to ~25%), Employer SSC ~17% (total ~42%)
Slovak Republic: Income tax ~8%, Employee SSC ~10.5% (to ~18.5%), Employer SSC ~23.5% (total ~42%)
Portugal: Income tax ~13%, Employee SSC ~9% (to ~22%), Employer SSC ~19% (total ~41%)
Greece: Income tax ~8%, Employee SSC ~13% (to ~21%), Employer SSC ~20% (total ~41%)
Spain: Income tax ~11.5%, Employee SSC ~5% (to ~16.5%), Employer SSC ~23% (total ~39.5%)
Turkey: Income tax ~11.5%, Employee SSC ~13% (to ~24.5%), Employer SSC ~14.5% (total ~39%)
Luxembourg: Income tax ~15.5%, Employee SSC ~11% (to ~26.5%), Employer SSC ~12% (total ~38.5%)
Netherlands: Income tax ~15%, Employee SSC ~11.5% (to ~26.5%), Employer SSC ~10.5% (total ~37%)
Estonia: Income tax ~11%, Employee SSC ~1% (to ~12%), Employer SSC ~25% (total ~37%)
Lithuania: Income tax ~16.5%, Employee SSC ~19% (to ~35.5%), Employer SSC ~1.5% (total ~37%)
OECD Average: Income tax ~14%, Employee SSC ~8% (to ~22%), Employer SSC ~14% (total ~36%)
Norway: Income tax ~17%, Employee SSC ~7.5% (to ~24.5%), Employer SSC ~11% (total ~35.5%)
Poland: Income tax ~6%, Employee SSC ~15.5% (to ~21.5%), Employer SSC ~14% (total ~35.5%)
Denmark: Income tax ~35.5%, Employee SSC 0%, Employer SSC 0% (total ~35.5%)
Ireland: Income tax ~20%, Employee SSC ~3% (to ~23%), Employer SSC ~10% (total ~33%)
Iceland: Income tax ~29.5%, Employee SSC ~0.5% (to ~30%), Employer SSC ~3% (total ~33%)
Japan: Income tax ~7%, Employee SSC ~12.5% (to ~19.5%), Employer SSC ~13% (total ~32.5%)
United Kingdom: Income tax ~12.5%, Employee SSC ~8.5% (to ~21%), Employer SSC ~10% (total ~31%)
Canada: Income tax ~14%, Employee SSC ~7% (to ~21%), Employer SSC ~10% (total ~31%)
United States: Income tax ~15%, Employee SSC ~7% (to ~22%), Employer SSC ~8% (total ~30%)
Australia: Income tax ~22.5%, Employee SSC 0%, Employer SSC ~5.5% (total ~28%)
Korea: Income tax ~6%, Employee SSC ~8% (to ~14%), Employer SSC ~10% (total ~24%)
Israel: Income tax ~9.5%, Employee SSC ~8% (to ~17.5%), Employer SSC ~6% (total ~23.5%)
Switzerland: Income tax ~10.5%, Employee SSC ~6% (to ~16.5%), Employer SSC ~7% (total ~23.5%)
Mexico: Income tax ~8.5%, Employee SSC ~1% (to ~9.5%), Employer SSC ~11% (total ~20.5%)
New Zealand: Income tax ~19%, Employee SSC 0%, Employer SSC 0% (total ~19%)
Chile: Income tax 0%, Employee SSC ~7%, Employer SSC 0% (total ~7%)

I continue to think that, if we want a Scandinavian level of public services, then most people have to pay similar levels of tax to most people in Scandinavia. Sorry about that.


Photo by Javier Miranda on Unsplash

Footnotes

  1. This combines income tax and employee national insurance/social security, and for countries (like the US) where there are state taxes as well as national taxes, it adds in the average state tax. ↩︎

  2. But not the apprenticeship levy because it’s kinda sorta hypothecated… you could definitely make a case it should be included ↩︎

  3. i.e. because the employer has an amount they’re willing/able to pay as wages, and employer NICs come out of that). ↩︎

  4. But the UK and Scottish figures just use the UK average wage, because my feeling is that this is the comparison people are interested in ↩︎
  5. original version here ↩︎

8 responses to “Updated: do Brits pay more or less tax on our wages than people in other countries?”

  1. Howard Vaan avatar

    I live and work in Switzerland. A couple of caveats apply to comparing income tax between here and the UK:

    1) There is no single rate of income tax in Switzerland – it all depends where you live – both Canton and community. This often affects where high earners choose to live.

    2) Health insurance is mandatory here and can easily cost many thousands of Francs a year. In the UK, this would be part of general taxation.

    Another way to look at this would be to compare discretionary income across countries on a PPP basis.

    1. Dan avatar

      The data shows average cantonal rate. But unfortunately once you bring in things like pensions and health cover, the differences between countries make comparisons very hard. No easy solution!

  2. Jason avatar

    Thanks Dan! Really interesting analysis. I think one of the commentators mentioned this on your last post, however I’d note that for at least France, the figure probably needs to be taken as a rough guide. Across the channel income tax is paid as a household. Very roughly you add all the household revenue together and divide by the number of adults in the family. Children under 18 I believe count for an additional 0.5 people for these purposes. This can make quite a significant difference depending on your personal circumstances. I’d also note that whilst the employer’s social security contribution is clearly very very high, as an employee, depending on your exact employment status and the size of company you work for, you’ll also typically get quite significant additional aid, bonuses, assistance etc from your company and the « worker’s committee ». All this adds up to make it effectively impossible (for me at least) to tell what your tax position will be….

    1. Dan avatar

      Thanks – I should have been clear that this is comparing outcomes for a single worker precisely to eliminate these sorts of issues (Which I believe are fairly common on the Continent). would be very interesting if you have a source setting out the rules so I could do a proper comparison.

  3. ian metcalfe avatar

    Not really ‘taxes’ but SLC deducts and auto-enrolment should may be included in this comparison – many of the comparators provide university free and funded from tax, and have higher SS to pay for more generous state pensions.

  4. Richard Sage avatar

    “Deductions in Europe being limited” might justify a bit more detail.
    From what I remember, I thought there were quite a lot of deductions for E.g. children.
    It may well be fair to say that they cease to be material for income levels above ?twice average?

  5. Richard Sage avatar

    Why is Estonia that shape?
    I thought they had a flat tax?

  6. Richard Sage avatar

    So glad to see that including “Employer’s Social Security” is now common and rebasing to the total cost, rather than the nominal salary – I remember having to point out years ago that the French effective rate was not low.
    Apprenticeship Levy is compulsory, so yes I think you should include it.
    And I see the sense of doing as a ratio of average earnings rather than absolute USD.
    Actually, is it median or mean? earnings or income? Earnings definitely seems more appropriate due to savings income have all sorts of varied treatments in many countries.

Leave a Reply

Your email address will not be published. Required fields are marked *