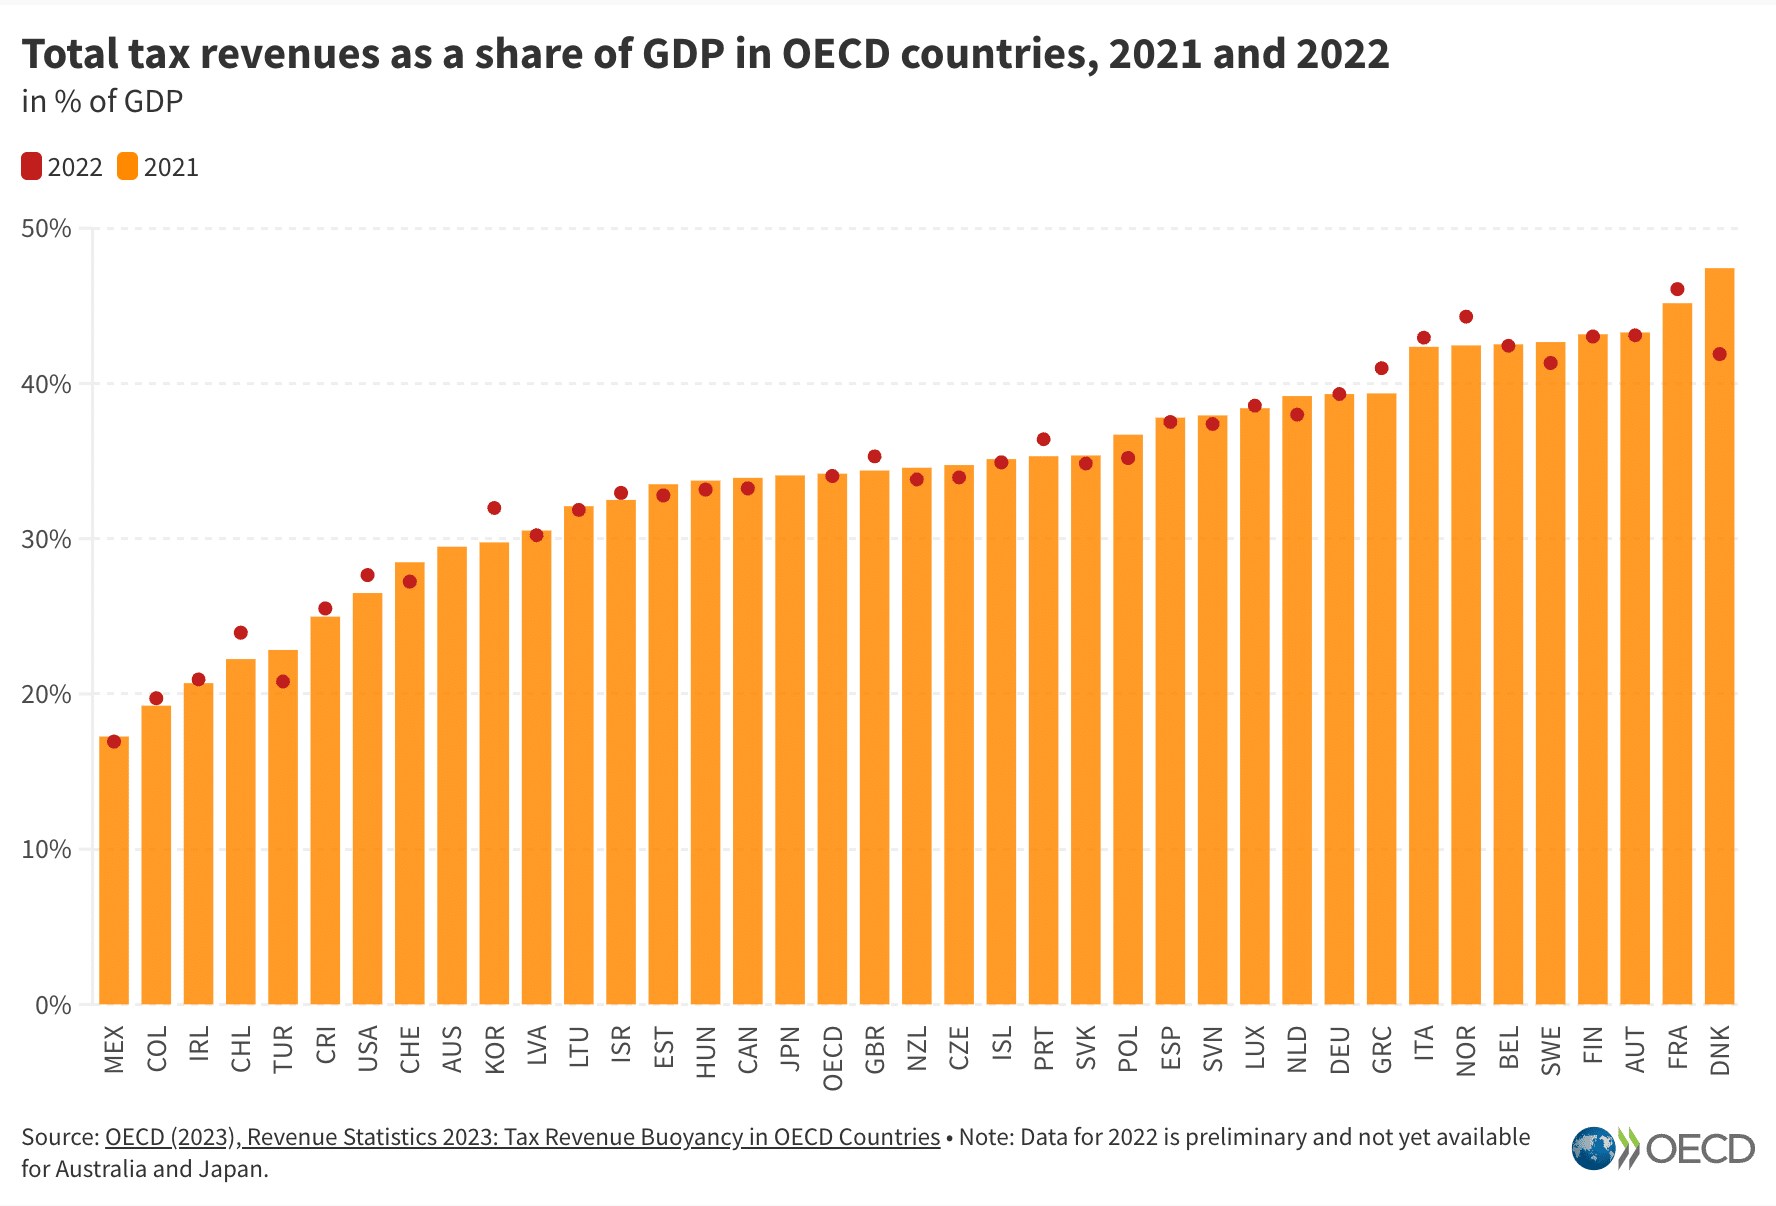
Bar chart of total tax revenues as a share of GDP across OECD countries in 2021 and 2022: In 2021 and 2022, the UK sat almost exactly at the OECD average, with tax revenue of approximately 34.5% of GDP in 2021 and around 35.3% in 2022. Overall, tax revenues ranged from under 20% in Mexico and Colombia to over 45% in France and Denmark.

Total tax revenues as a share of GDP in OECD countries, 2021 and 2022
in % of GDP
Legend: 2022 (red circle), 2021 (orange bar)
Y-axis: 0% to 50% in increments of 10%
Countries (from lowest to highest 2021 value):
MEX: 2021 ~17.1%, 2022 ~16.9%
COL: 2021 ~19.2%, 2022 ~19.7%
IRL: 2021 ~20.7%, 2022 ~20.9%
CHL: 2021 ~22.2%, 2022 ~23.9%
TUR: 2021 ~22.8%, 2022 ~20.8%
CRI: 2021 ~24.9%, 2022 ~25.5%
USA: 2021 ~26.5%, 2022 ~27.7%
CHE: 2021 ~28.5%, 2022 ~27.2%
AUS: 2021 ~29.4%, 2022 not available
KOR: 2021 ~29.8%, 2022 ~32.0%
LVA: 2021 ~30.8%, 2022 ~30.2%
LTU: 2021 ~32.1%, 2022 ~31.8%
ISR: 2021 ~32.5%, 2022 ~33.0%
EST: 2021 ~33.4%, 2022 ~33.0%
HUN: 2021 ~33.8%, 2022 ~33.2%
CAN: 2021 ~33.9%, 2022 ~33.2%
JPN: 2021 ~34.1%, 2022 not available
OECD: 2021 ~34.2%, 2022 ~34.0%
GBR: 2021 ~34.5%, 2022 ~35.3%
NZL: 2021 ~34.6%, 2022 ~33.8%
CZE: 2021 ~34.7%, 2022 ~34.0%
ISL: 2021 ~35.0%, 2022 ~35.0%
PRT: 2021 ~35.3%, 2022 ~36.4%
SVK: 2021 ~35.3%, 2022 ~34.8%
POL: 2021 ~36.7%, 2022 ~35.2%
ESP: 2021 ~37.9%, 2022 ~37.7%
SVN: 2021 ~38.0%, 2022 ~37.6%
LUX: 2021 ~38.5%, 2022 ~38.6%
NLD: 2021 ~39.2%, 2022 ~38.0%
DEU: 2021 ~39.3%, 2022 ~39.3%
GRC: 2021 ~39.4%, 2022 ~41.0%
ITA: 2021 ~42.3%, 2022 ~42.9%
NOR: 2021 ~42.5%, 2022 ~44.3%
BEL: 2021 ~42.6%, 2022 ~42.4%
SWE: 2021 ~42.6%, 2022 ~41.3%
FIN: 2021 ~43.0%, 2022 ~43.1%
AUT: 2021 ~43.4%, 2022 ~43.1%
FRA: 2021 ~45.1%, 2022 ~46.1%
DNK: 2021 ~47.4%, 2022 ~41.9%
Source: OECD (2023), Revenue Statistics 2023: Tax Revenue Buoyancy in OECD Countries • Note: Data for 2022 is preliminary and not yet available for Australia and Japan.

Has tax in the UK increased more than in other countries?

6 December 2023

2 Comments

There’s a new OECD report with tax data going up to 2022.

The chart above shows that, whilst many countries saw a decline in tax revenues from 2021 to 2022, the UK saw a tax increase. However, the overall level of tax revenues in the UK, as a percentage of GDP, is very close to the OECD average.

That wasn’t always the case – in 1965 UK tax was relatively high by international standards:
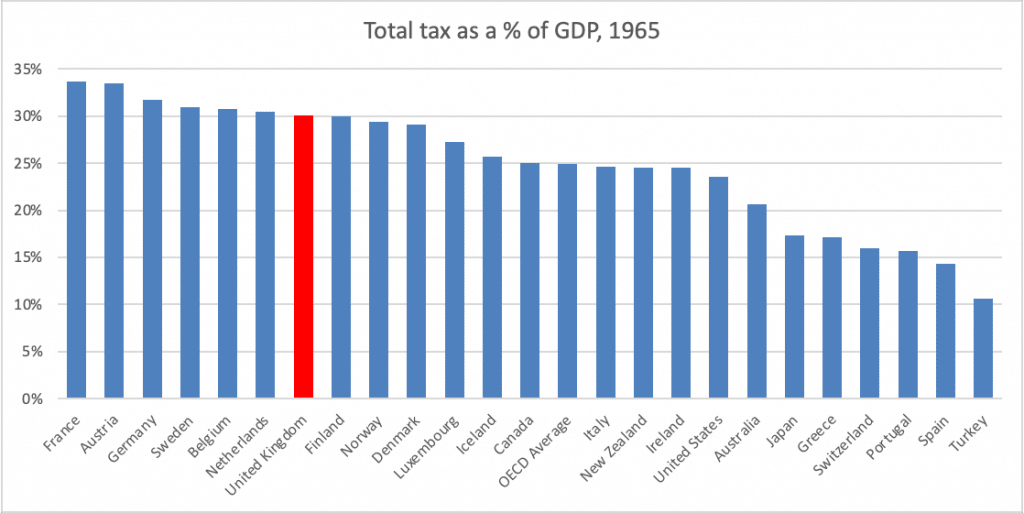
Bar chart of total tax as a percentage of GDP in 1965 across OECD countries: In 1965, the UK had the seventh highest tax burden among OECD countries at approximately 30% of GDP, well above the OECD average of about 25%. France and Austria were the highest at around 33-34%, whilst Turkey was the lowest at approximately 11%.

Title: Total tax as a % of GDP, 1965
Vertical axis: 0% to 35% in intervals of 5%
Horizontal axis: Countries

France: ~33.6%
Austria: ~33.4%
Germany: ~31.7%
Sweden: ~31.0%
Belgium: ~30.7%
Netherlands: ~30.5%
United Kingdom: ~30.1% (highlighted in red)
Finland: ~30.0%
Norway: ~29.4%
Denmark: ~29.1%
Luxembourg: ~27.3%
Iceland: ~25.7%
Canada: ~25.0%
OECD Average: ~24.9%
Italy: ~24.7%
New Zealand: ~24.6%
Ireland: ~24.6%
United States: ~23.5%
Australia: ~20.6%
Japan: ~17.3%
Greece: ~17.1%
Switzerland: ~16.0%
Portugal: ~15.7%
Spain: ~14.3%
Turkey: ~10.7%

Since then, UK tax increased a bit, but other countries increased their tax by a lot:
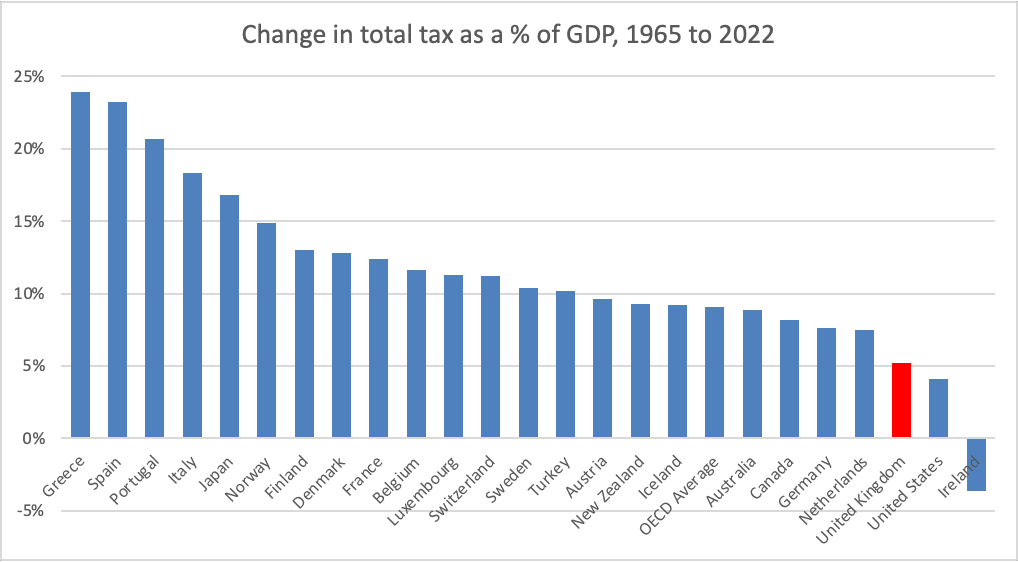
Bar chart of the change in total tax as a percentage of GDP from 1965 to 2022 across OECD countries: The UK experienced one of the lowest increases in tax as a share of GDP between 1965 and 2022 at approximately 5.3 percentage points, well below the OECD average of roughly 9.0 percentage points. Greece and Spain saw the largest increases at around 23 to 24 percentage points, while Ireland was the only country shown with a decrease, falling by roughly 3.5 percentage points.

Change in total tax as a % of GDP, 1965 to 2022

Y-axis: Change in total tax as a % of GDP (-5% to 25%, in 5% increments)
X-axis: Country

Greece: ~24.0%
Spain: ~23.3%
Portugal: ~20.7%
Italy: ~18.3%
Japan: ~16.8%
Norway: ~14.9%
Finland: ~13.0%
Denmark: ~12.8%
France: ~12.4%
Belgium: ~11.6%
Luxembourg: ~11.3%
Switzerland: ~11.2%
Sweden: ~10.4%
Turkey: ~10.2%
Austria: ~9.6%
New Zealand: ~9.3%
Iceland: ~9.2%
OECD Average: ~9.0%
Australia: ~8.8%
Canada: ~8.1%
Germany: ~7.6%
Netherlands: ~7.5%
United Kingdom: ~5.3% (bar coloured red)
United States: ~4.1%
Ireland: ~-3.5%

By 1990 it was much closer to the average (but higher than Spain:
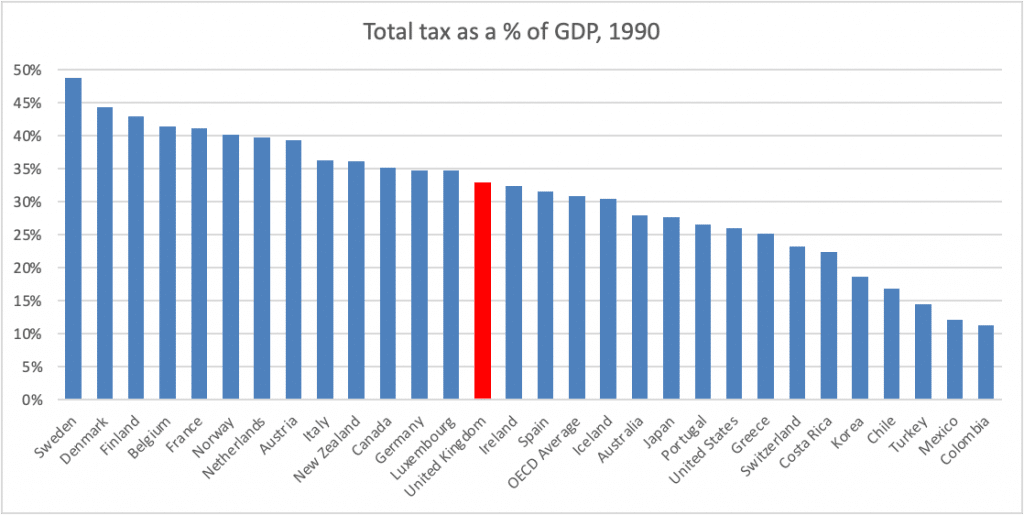
Bar chart comparing total tax as a percentage of GDP across OECD countries in 1990: In 1990, the United Kingdom's tax-to-GDP ratio was approximately 33%, placing it near the middle of the group and slightly above the OECD average of about 31%. Sweden had the highest ratio at nearly 49%, while Colombia had the lowest at approximately 11%.

Total tax as a % of GDP, 1990

Y-axis: 0% to 50% (5% increments)

Countries and approximate values:
Sweden: ~49%
Denmark: ~44%
Finland: ~43%
Belgium: ~41%
France: ~41%
Norway: ~40%
Netherlands: ~40%
Austria: ~39%
Italy: ~36%
New Zealand: ~36%
Canada: ~35%
Germany: ~35%
Luxembourg: ~35%
United Kingdom: ~33% (highlighted in red)
Ireland: ~32%
Spain: ~32%
OECD Average: ~31%
Iceland: ~30%
Australia: ~28%
Japan: ~28%
Portugal: ~27%
United States: ~26%
Greece: ~25%
Switzerland: ~23%
Costa Rica: ~22%
Korea: ~19%
Chile: ~17%
Turkey: ~14%
Mexico: ~12%
Colombia: ~11%

And since 2000 we’ve been basically average:
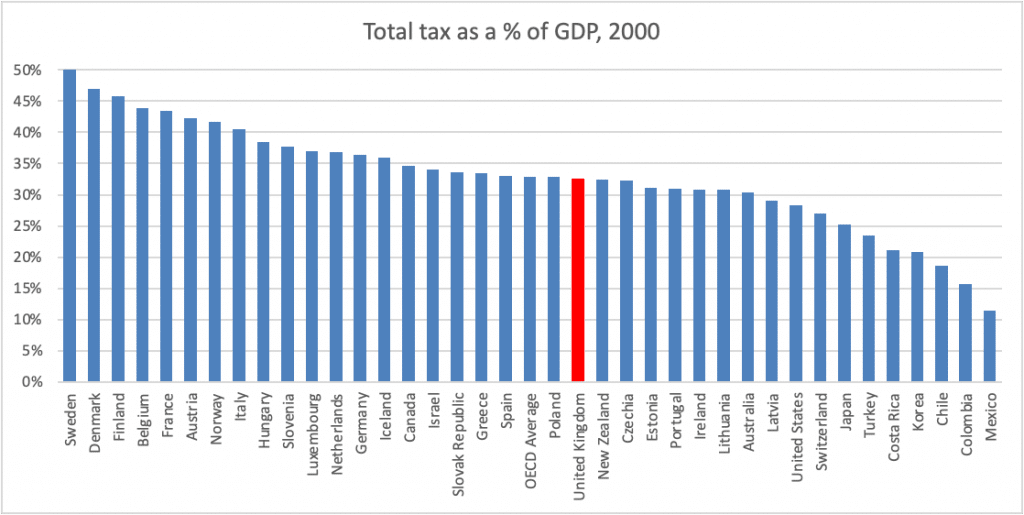
Bar chart comparing total tax as a percentage of GDP across OECD countries in 2000: In 2000, Sweden had the highest tax burden at roughly 50% of GDP, while Mexico had the lowest at around 11%. The United Kingdom sat close to the middle at approximately 33%, just below the OECD average.

Title: Total tax as a % of GDP, 2000
Vertical axis: 0% to 50% in 5% increments
Horizontal axis (countries from highest to lowest, with estimated percentages based on grid lines):
Sweden: ~50%
Denmark: ~47%
Finland: ~46%
Belgium: ~44%
France: ~43%
Austria: ~42%
Norway: ~42%
Italy: ~40%
Hungary: ~38%
Slovenia: ~38%
Luxembourg: ~37%
Netherlands: ~37%
Germany: ~36%
Iceland: ~36%
Canada: ~35%
Israel: ~34%
Slovak Republic: ~34%
Greece: ~33%
Spain: ~33%
OECD Average: ~33%
Poland: ~33%
United Kingdom: ~33% (highlighted in red)
New Zealand: ~32%
Czechia: ~32%
Estonia: ~31%
Portugal: ~31%
Ireland: ~31%
Lithuania: ~31%
Australia: ~30%
Latvia: ~29%
United States: ~28%
Switzerland: ~27%
Japan: ~25%
Turkey: ~23%
Costa Rica: ~21%
Korea: ~21%
Chile: ~19%
Colombia: ~16%
Mexico: ~11%

How has the overall level of tax, as a % of GDP, changed from 2000 to 2022?
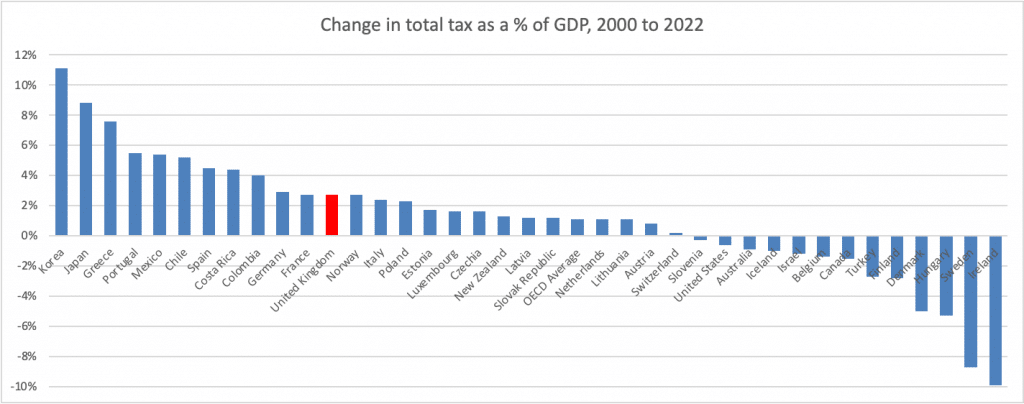
Bar chart comparing the change in total tax as a percentage of GDP between 2000 and 2022 across OECD countries, highlighting the United Kingdom: Between 2000 and 2022, the UK's total tax as a share of GDP increased by approximately 2.7 percentage points, ranking twelfth highest among OECD countries and well above the OECD average increase of around 1.1 percentage points. Korea saw the largest increase at over 11 percentage points, while Ireland saw the largest drop at almost 10 percentage points.

Title: Change in total tax as a % of GDP, 2000 to 2022
Vertical axis: -10% to 12% in steps of 2%
Horizontal axis (countries, with values estimated from chart):
Korea: ~11.1%
Japan: ~8.8%
Greece: ~7.6%
Portugal: ~5.5%
Mexico: ~5.4%
Chile: ~5.2%
Spain: ~4.5%
Costa Rica: ~4.4%
Colombia: ~4.0%
Germany: ~2.9%
France: ~2.7%
United Kingdom: ~2.7% (highlighted in red)
Norway: ~2.7%
Italy: ~2.4%
Poland: ~2.3%
Estonia: ~1.7%
Luxembourg: ~1.6%
Czechia: ~1.6%
New Zealand: ~1.3%
Latvia: ~1.2%
Slovak Republic: ~1.2%
OECD Average: ~1.1%
Netherlands: ~1.1%
Lithuania: ~1.1%
Austria: ~0.8%
Switzerland: ~0.2%
Slovenia: ~-0.3%
United States: ~-0.6%
Australia: ~-0.9%
Iceland: ~-1.1%
Israel: ~-1.1%
Belgium: ~-1.3%
Canada: ~-1.5%
Turkey: ~-2.7%
Finland: ~-3.1%
Denmark: ~-5.0%
Hungary: ~-5.3%
Sweden: ~-8.8%
Ireland: ~-9.9%

It’s gone up, but not markedly so. (Quick note: I would ignore the Irish figures, because the GDP is artificially inflated by multinational profit-shifting, and the Norwegian figures, as the tax is dominated by oil/gas revenues)

A similar picture if we look at developments since 2010:
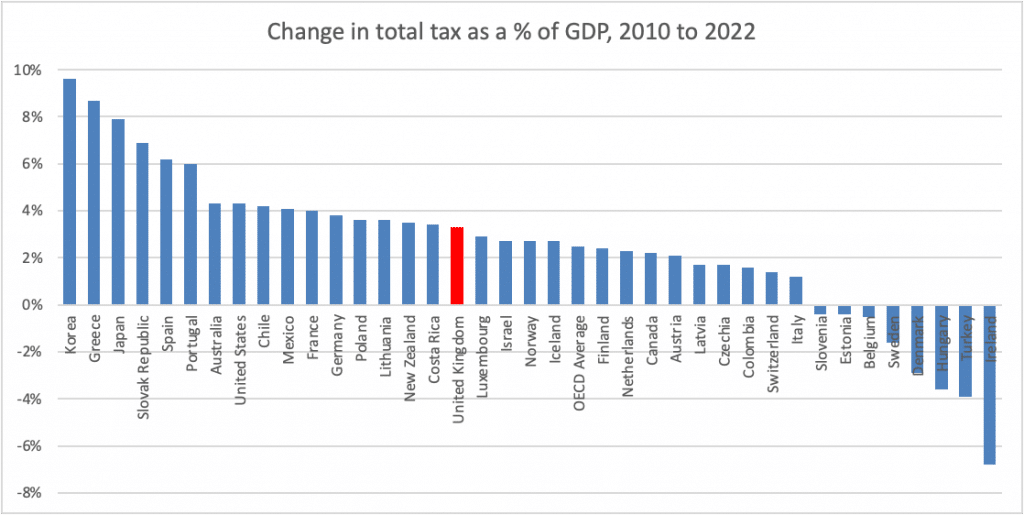
Bar chart showing the change in total tax as a percentage of GDP from 2010 to 2022 across OECD countries: Korea, Greece, and Japan saw the largest increases in total tax as a percentage of GDP between 2010 and 2022, rising by around 8% to 10%, while Ireland saw the largest drop at almost -7%. The United Kingdom's tax-to-GDP ratio increased by approximately 3.3%, placing it 17th highest, slightly above the OECD average of 2.5%.

Change in total tax as a % of GDP, 2010 to 2022
Vertical axis: -8% to 10% in intervals of 2%
Horizontal axis: Countries

Estimated values:
Korea: 9.6%
Greece: 8.7%
Japan: 7.9%
Slovak Republic: 6.9%
Spain: 6.2%
Portugal: 6.0%
Australia: 4.3%
United States: 4.3%
Chile: 4.2%
Mexico: 4.1%
France: 4.0%
Germany: 3.8%
Poland: 3.6%
Lithuania: 3.6%
New Zealand: 3.5%
Costa Rica: 3.4%
United Kingdom: 3.3% (highlighted in red)
Luxembourg: 2.9%
Israel: 2.7%
Norway: 2.7%
Iceland: 2.7%
OECD Average: 2.5%
Finland: 2.4%
Netherlands: 2.3%
Canada: 2.2%
Austria: 2.1%
Latvia: 1.7%
Czechia: 1.7%
Colombia: 1.6%
Switzerland: 1.4%
Italy: 1.2%
Slovenia: -0.4%
Estonia: -0.5%
Belgium: -0.6%
Sweden: -1.1%
Denmark: -3.1%
Hungary: -3.6%
Turkey: -3.9%
Ireland: -6.8%

So it’s not true to say that UK tax has increased significantly, compared to the rest of the world, since 2010.

But, more recently, it does seem that the UK has seen one of the largest tax increases in the world:
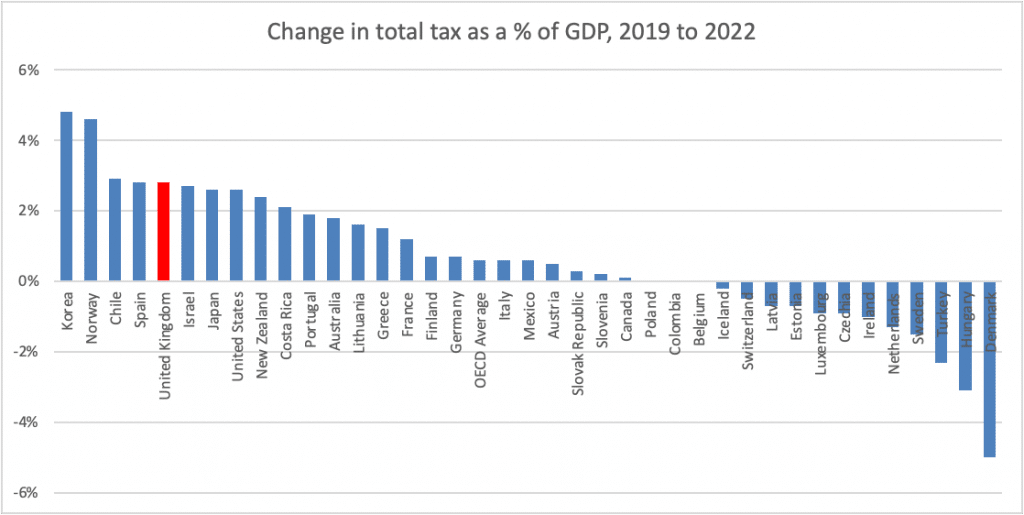
Bar chart of the change in total tax as a percentage of GDP between 2019 and 2022 across OECD countries: The UK saw the fifth largest increase in tax as a share of GDP between 2019 and 2022, rising by approximately 2.8%, well above the OECD average increase of roughly 0.6%. Korea and Norway experienced the largest increases at nearly 5%, while Denmark had the largest drop at roughly -5%.

Title: Change in total tax as a % of GDP, 2019 to 2022

Y-axis: Change in percentage points (-6% to 6%, with gridlines every 2%)
X-axis: Countries

Approximate values read from the chart:
Korea: 4.8%
Norway: 4.6%
Chile: 2.9%
Spain: 2.8%
United Kingdom: 2.8% (highlighted in red)
Israel: 2.7%
Japan: 2.6%
United States: 2.6%
New Zealand: 2.4%
Costa Rica: 2.1%
Portugal: 1.9%
Australia: 1.8%
Lithuania: 1.6%
Greece: 1.5%
France: 1.2%
Finland: 0.7%
Germany: 0.7%
OECD Average: 0.6%
Italy: 0.6%
Mexico: 0.6%
Austria: 0.5%
Slovak Republic: 0.3%
Slovenia: 0.2%
Canada: 0.1%
Poland: 0.0%
Colombia: 0.0%
Belgium: 0.0%
Iceland: -0.2%
Switzerland: -0.5%
Latvia: -0.7%
Estonia: -0.7%
Luxembourg: -0.9%
Czechia: -1.0%
Ireland: -1.2%
Netherlands: -1.4%
Sweden: -1.5%
Turkey: -2.3%
Hungary: -3.1%
Denmark: -5.0%

Important to remember the first chart at the top – these big increases are only taking us to very slightly above the OECD average. But if we wanted to tell a story about this, it might be that post-financial crisis many countries increased their tax levels significantly. Austerity UK did not…
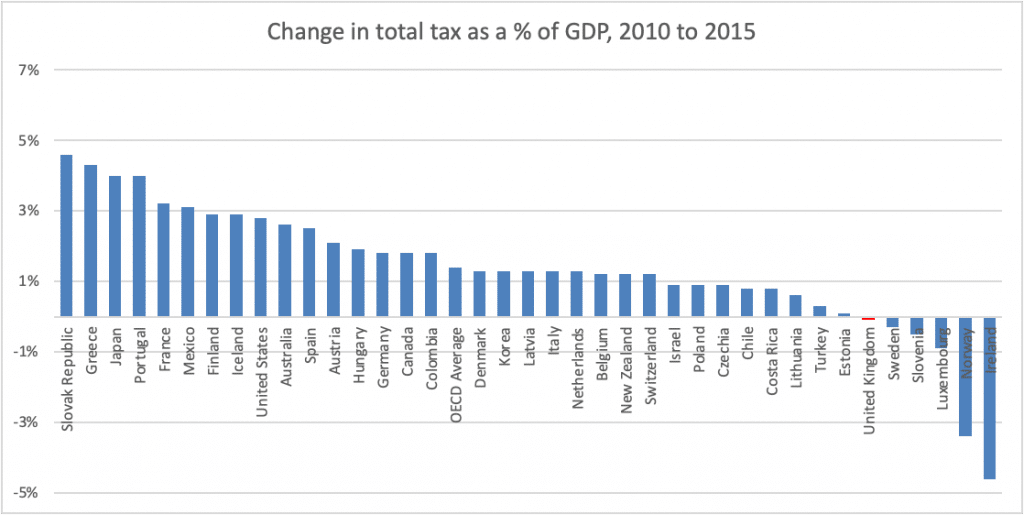
Bar chart comparing the change in total tax as a percentage of GDP from 2010 to 2015 across OECD countries: The Slovak Republic had the largest increase in total tax revenue relative to GDP at roughly 4.6 percentage points, while Ireland saw the largest decrease at around -4.6 percentage points. The UK, highlighted in red, saw a slight fall of approximately -0.1 percentage points, well below the OECD average increase of about 1.4 percentage points.

Change in total tax as a % of GDP, 2010 to 2015

Y-axis: -5%, -3%, -1%, 1%, 3%, 5%, 7%

Data points (approximate values):
Slovak Republic: 4.6%
Greece: 4.3%
Japan: 4.0%
Portugal: 4.0%
France: 3.2%
Mexico: 3.1%
Finland: 2.9%
Iceland: 2.9%
United States: 2.8%
Australia: 2.6%
Spain: 2.5%
Austria: 2.1%
Hungary: 1.9%
Germany: 1.8%
Canada: 1.8%
Colombia: 1.8%
OECD Average: 1.4%
Denmark: 1.3%
Korea: 1.3%
Latvia: 1.3%
Italy: 1.3%
Netherlands: 1.3%
Belgium: 1.2%
New Zealand: 1.2%
Switzerland: 1.2%
Israel: 0.9%
Poland: 0.9%
Czechia: 0.9%
Chile: 0.8%
Costa Rica: 0.8%
Lithuania: 0.6%
Turkey: 0.3%
Estonia: 0.1%
United Kingdom: -0.1% (red bar)
Sweden: -0.4%
Slovenia: -0.6%
Luxembourg: -1.0%
Norway: -3.5%
Ireland: -4.6%

… and we’re now playing catch-up.

Important to remember this is 2022 data – the large recent UK tax rises (particularly fiscal drag) have yet to kick in (together with their equivalents in other countries).

2 responses to “Has tax in the UK increased more than in other countries?”

  1. David Myth avatar

    Thanks for the article!

  2. David Myth avatar

    Thanks for the article! The rapid rise in taxes in the UK is very concerning.

Leave a Reply

Your email address will not be published. Required fields are marked *