Henley & Partners’ 2025 Wealth Migration Report says 16,500 UK millionaires will leave this year. That’s a very small percentage, which is surprising when the OBR expected 25% of the wealthiest non-doms to leave the UK.1 And many private wealth industry figures have told us that many of the figures in the Henley & Partners reports don’t make sense. Wealth specialists in business and academia have told us they doubt that it’s possible to do what Henley & Partners claim.
Our team has therefore conducted a full statistical and forensic review – which shows that the Henley & Partners reports can’t be trusted:
- Definitions change, numbers don’t. The report dropped all property wealth between 2023 and 2025, yet its millionaire counts barely moved. That is impossible if the published methodology were real. And when the FT asked about this, New World Wealth (who write the report) admitted that property was never actually included in the analysis, although before 2025 their reports all said that it was.
- Too many even numbers. Wealth reports from Knight Frank, Forbes and UBS have as many odd numbers as even numbers – which is what you’d expect. But the Henley & Partners wealth and migration figures have too many even numbers – the chance of that occurring naturally is 2%. It’s classic evidence of numbers typed, not measured.
- Digit patterns look “made‑up”. Trailing digits cluster on 0s and 5s, with almost no 1s. Statistically, the chance of that occurring naturally is about 1 in 240,000. More evidence that the numbers are manually created or adjusted.
- Millionaire/centimillionaire ratios are “frozen.” In 2023‑25, 14 of 38 cities show a less than 1 % change in the ratio of millionaires to centimillionaires (people with $100m of net wealth). Five of the world’s largest and most dynamic cities showed a change of less than 0.1 %. Our model gives only a 0.03% likelihood of such stability arising from chance. The likely explanation: a single growth/shrink factor is applied to both brackets: another sign the figures are engineered, not observed.
- A one‑man firm says it tracks 150,000 fortunes – right down to investments, cash and crypto – and nets off their debt. That simply can’t be done. Not even by tax authorities.
- Official data flatly contradicts the Henley & Partners figures. UK millionaires ($1m+) are overstated by almost 100 %, while UK centimillionaires ($100m+) are understated by around 70 %.
- No statistical controls. As was first reported by Tim Harford in 2024, the report uses no statistical controls of any kind. Even if it did what it claimed, it’s just a survey, no more scientific than a Twitter poll.
Until an independent audit is carried out, the Wealth Migration Report should be treated as marketing material, not evidence.
Our full analysis is below.
18 August 2025: updated to reflect new New World Wealth responses to Spear’s Magazine.
The Henley & Partners reports
The Henley & Partners wealth and migration reports are impressively detailed and presented, and have been widely cited by politicians and newspapers across the political spectrum.
The reports are produced by New World Wealth – a South African firm which appears to have only one employee.
Henley & Partners are a firm which sells migration services. They have no statistical expertise. They told us that New World Wealth doesn’t share the details of its methodology with them. We accept that, if there was fabrication, Henley & Partners are unaware of it.
The methodology changed dramatically. The data didn’t.
The Henley & Partners reports count numbers of millionaires ($1m+), centimillionaires ($100m+) and billionaires ($1bn+) by their “net wealth”. This was originally defined to include real estate. The Henley & Partners 2023 report said “wealth” means “property, cash and equities less any liabilities”. It added “the bulk of the average high-net-worth individual’s wealth is tied up in residential property and equities.”2
The 2024 USA report says they are measuring “wealth” defined as “listed company holdings, cash holdings, and debt-free residential property holdings” (our emphasis). That’s a small but important difference – because now they don’t just net off property debt, they ignore mortgaged property altogether.34
There was then a further change in 2025. The 2025 report said “wealth” only includes “listed company holdings, cash, bonds, gold, and crypto5 holdings”.6 The 2025 USA report says explicitly that “real estate assets are excluded”.
We should therefore see a change in the Henley & Partners figures between 2023 and 2024, and then another between 2024 and 2025.
Over the period 2023 to 2025, the fall in the number of millionaires should be dramatic. In large cities like London and New York, where one-third of a dollar millionaire’s net wealth is tied up in the home,7 eliminating property wealth should cause the number of millionaires to fall by around 20%.8
We don’t see any effects like this.
The data doesn’t change
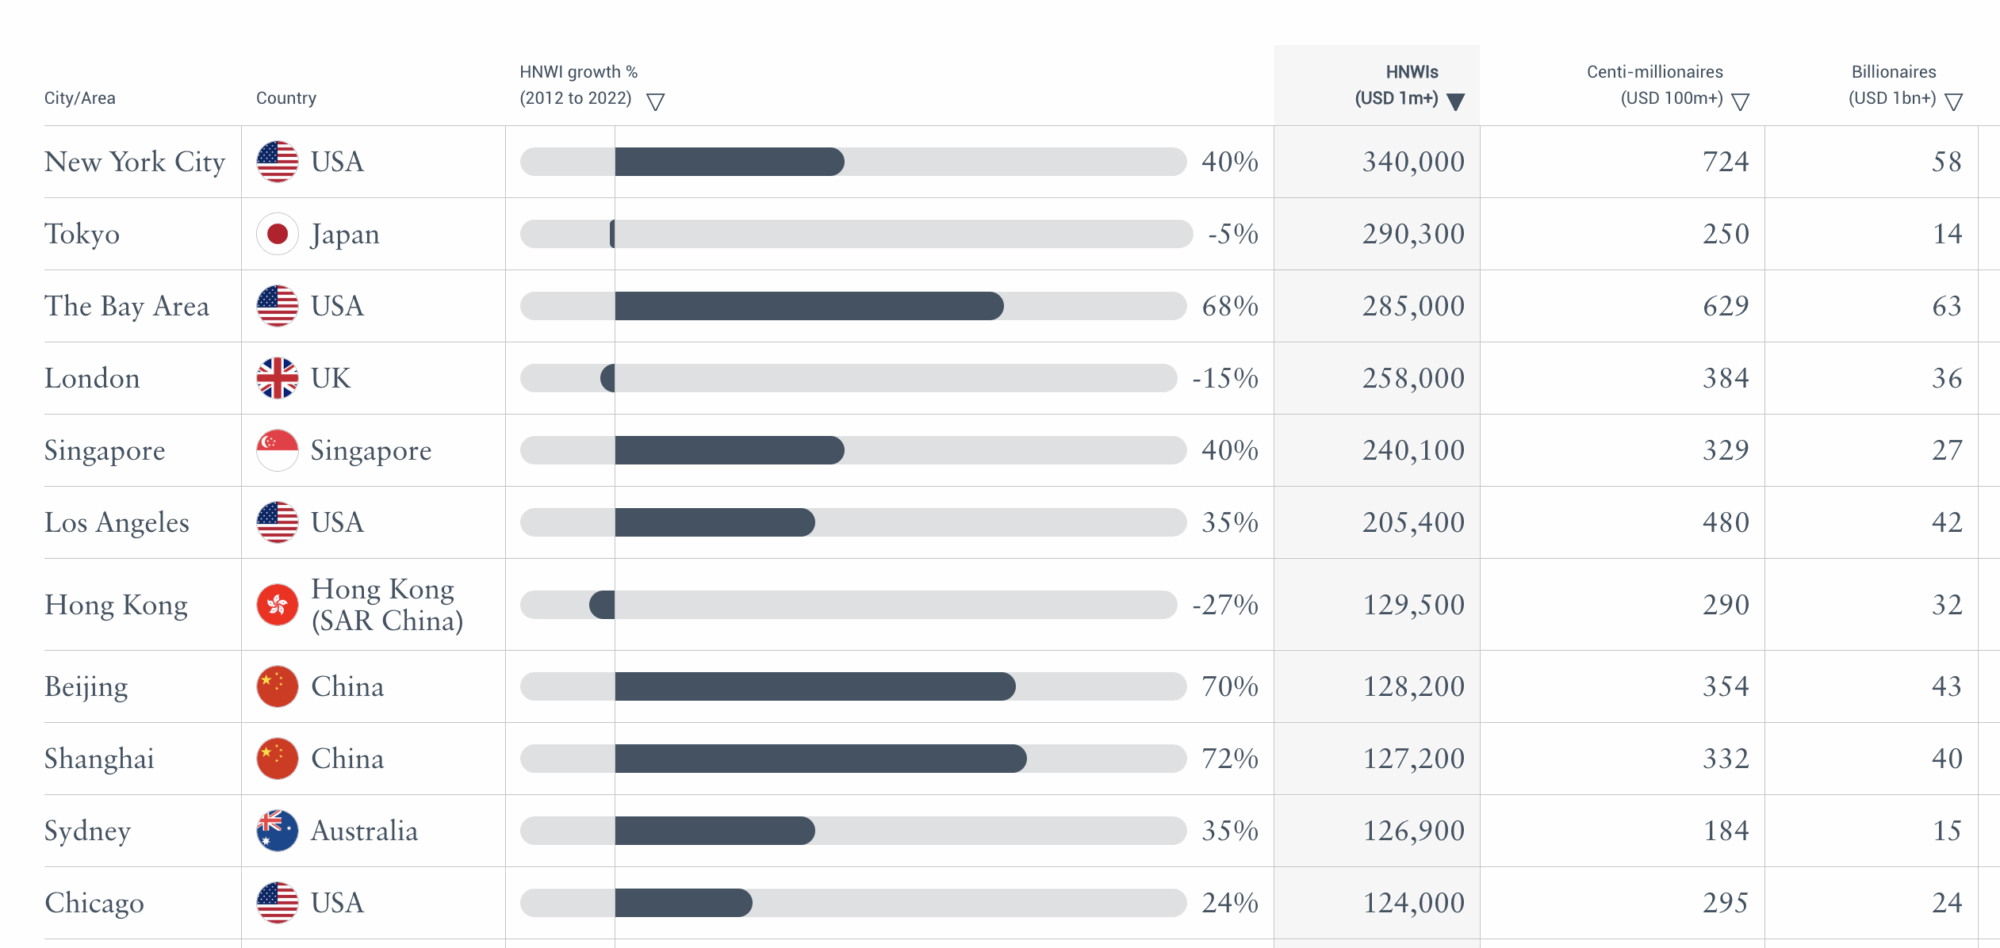
This is the Henley & Partners 2023 list of the world’s wealthiest cities. At this point the definition of wealth in the reports clearly included property – and these are cities where property is a big component of wealth:
The 2024 figures should show all mortgaged property dropping out of the data. A large amount of wealth should have disappeared, with the number of dollar millionaires dropping significantly (and a smaller effect on centimillionaires).
There should have been a particularly large effect in (for example) New York, the Bay Area and London, where large numbers of people are millionaires based solely upon their net property wealth.

Then, when the final change in 2025 excluded all real estate, we should have seen a further change, and overall a drop of around 20% in millionaire numbers in cities with high house prices. We don’t see anything like that:
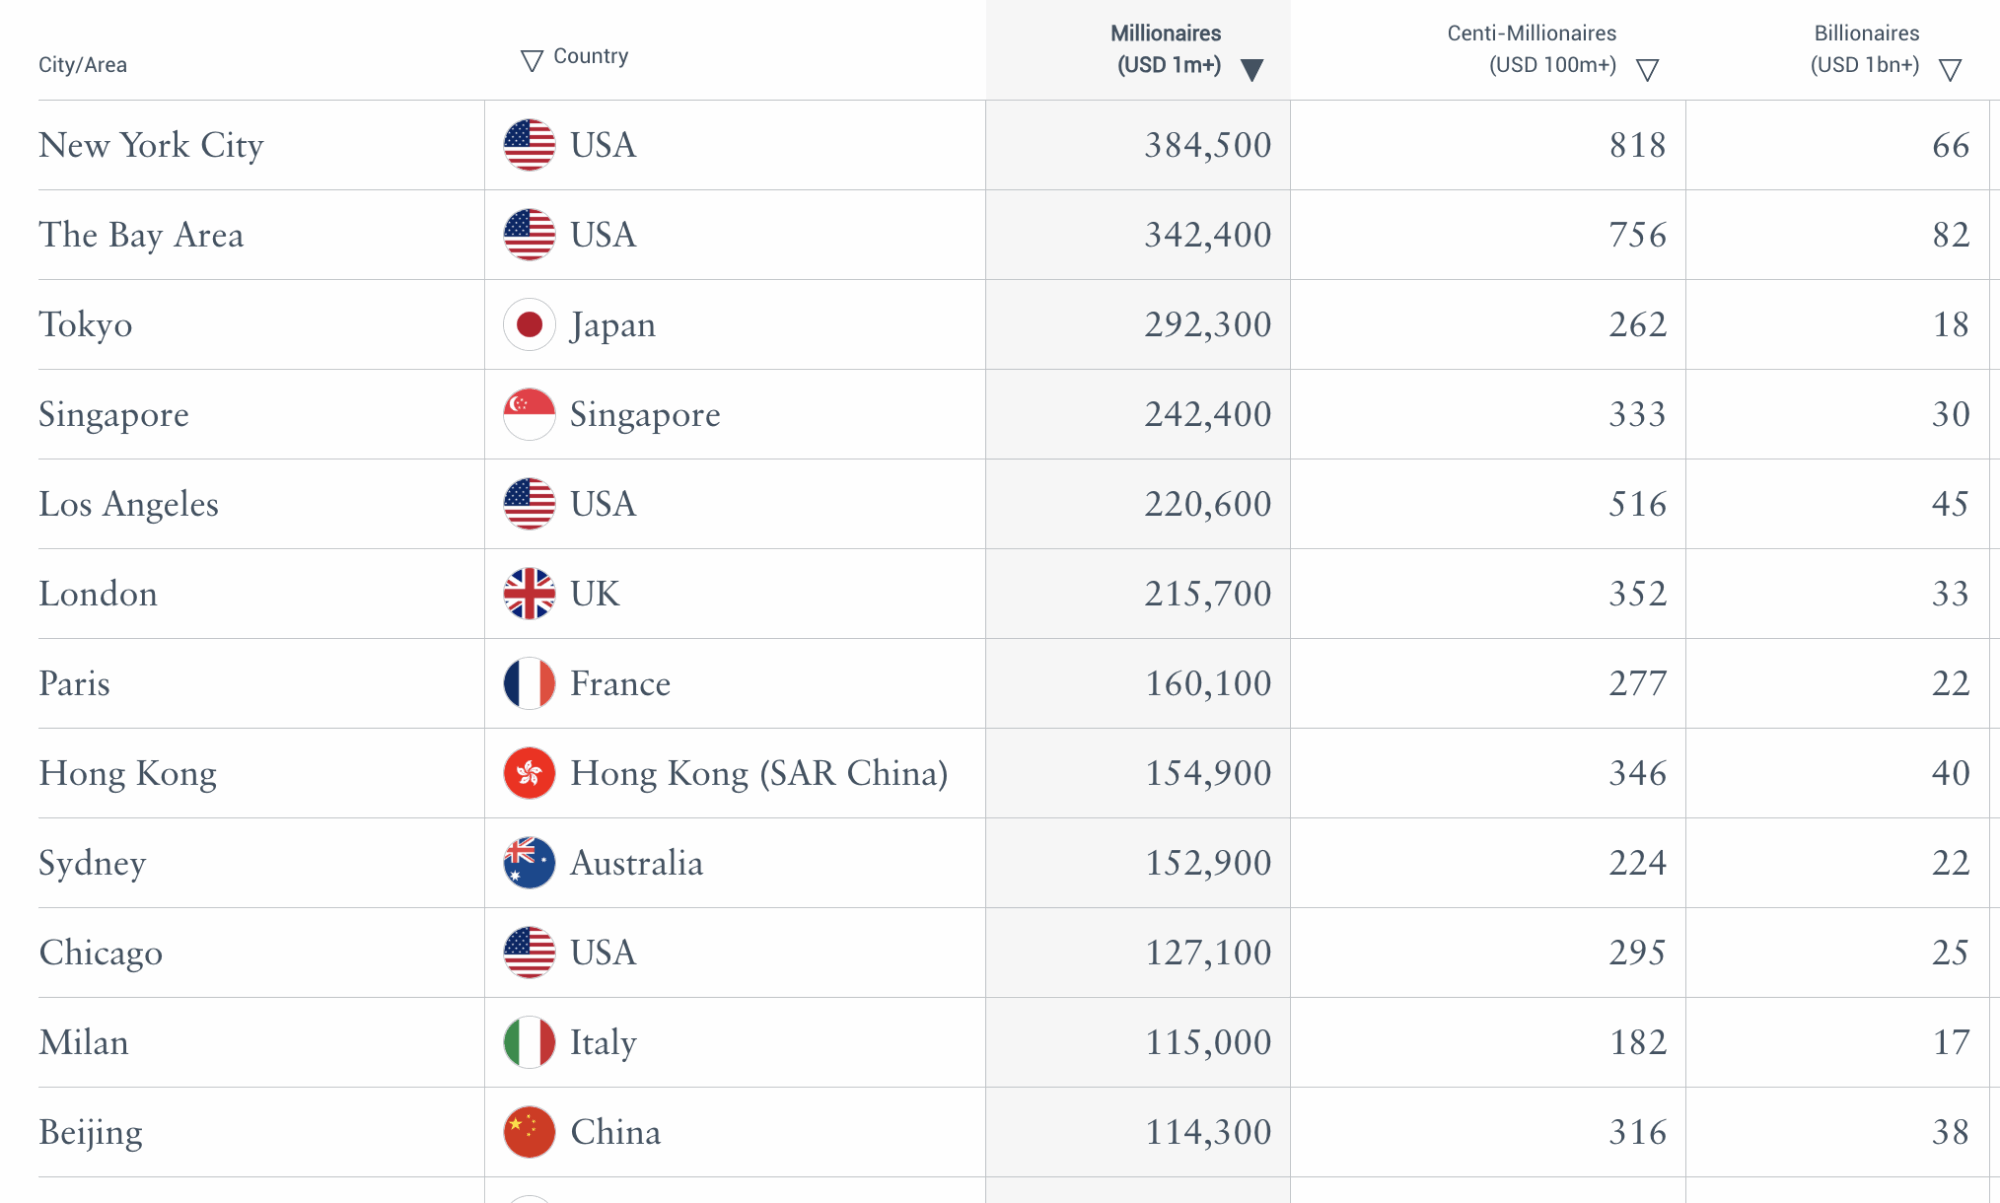
And everything is presented as if the figures are comparable year-to-year.
It’s as if nothing happened.
What this means
New World Wealth ignored our questions – but when the Financial Times asked, the founder conceded that the model has never counted property wealth at all, even though the published “methodology” said it did.
New World Wealth then told the FT that the wording of the methodology was changed because there had been “a lot of question marks about why our numbers were so much lower than these Credit Suisse numbers . . . we probably had to refine the methodology to explain that”. This is revealing: when the data was criticised, their response wasn’t to revisit the data, but to change the stated methodology.
This could be deliberate deceit; it could also be a small firm out of its depth and acting out of panic. We don’t know – but it means we don’t believe any of the methodology can be trusted.9
There are suspicious patterns in the data
The Henley & Partners data is supposed to be the output of a model/calculation. We used standard forensic accounting techniques to detect whether this was the case.
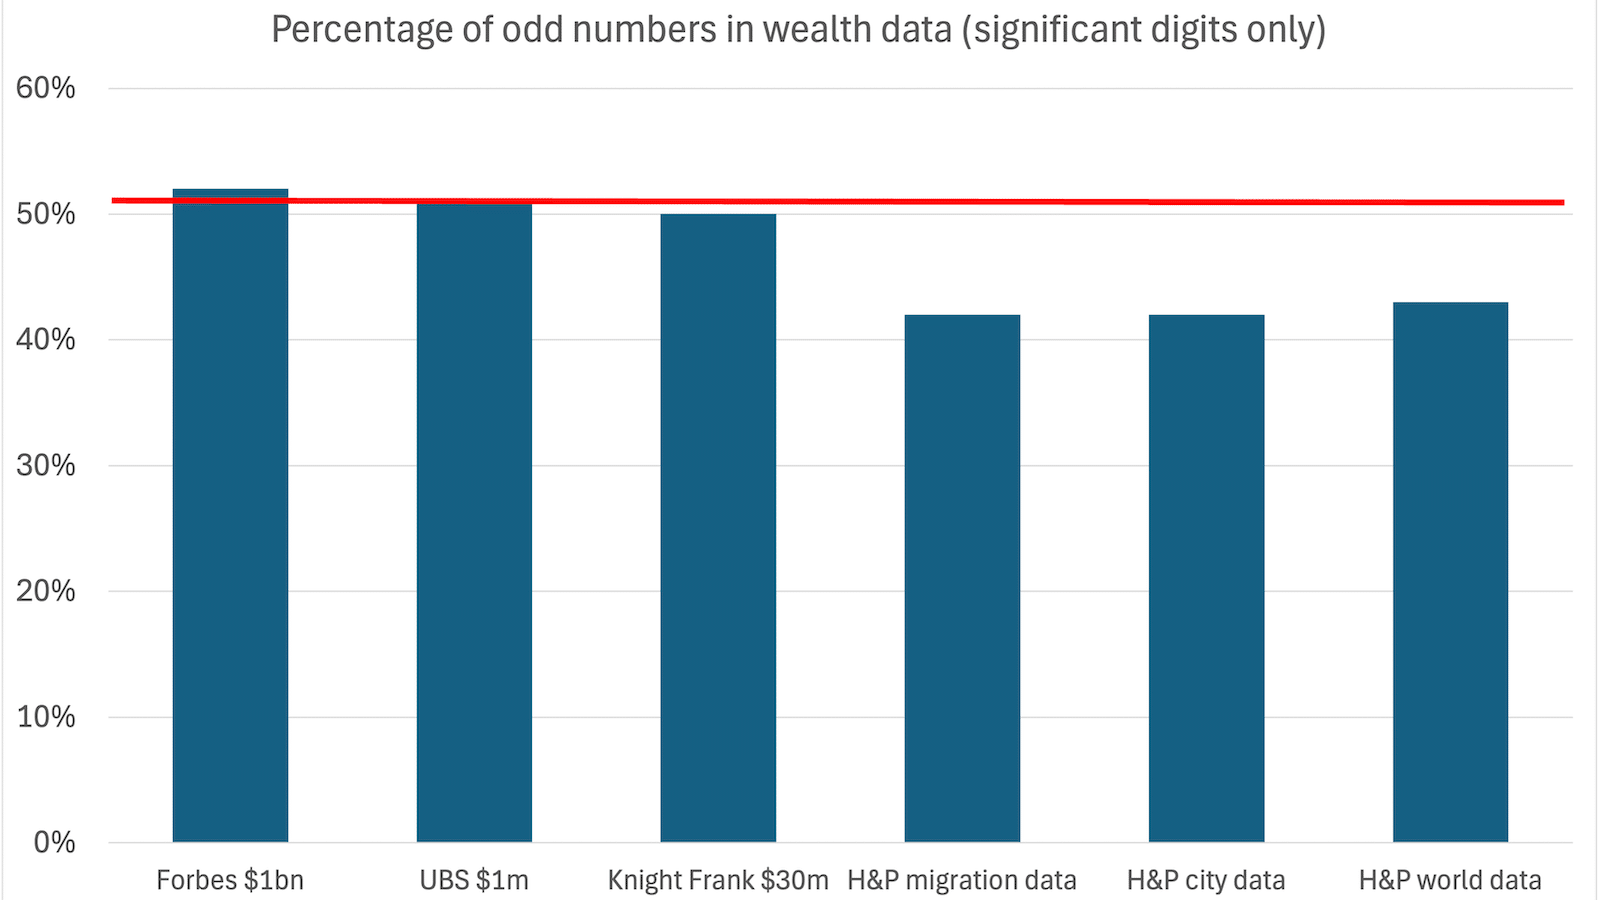
Odd numbers
A common method used by forensic accountants is checking what percentage of numbers in a list of figures are odd. For many datasets it should be 50%, but humans often have a subconscious preference for even numbers.
So we looked at the Henley & Partners data from 2022 to 202510 and checked the last significant digit in the counts of millionaires, billionaires (ignoring cases where the number is zero11), and centimillionaires:
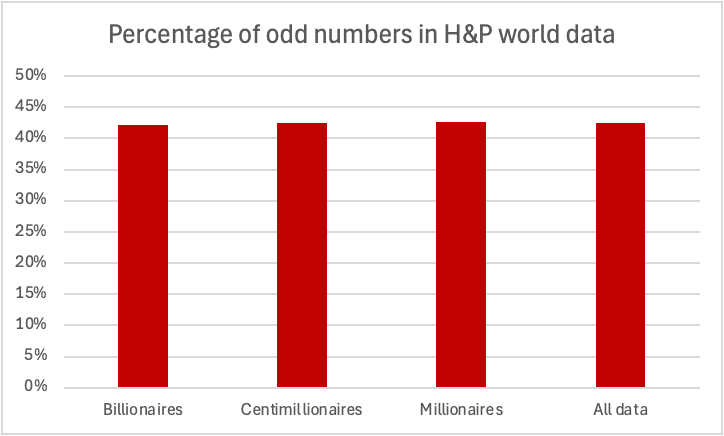
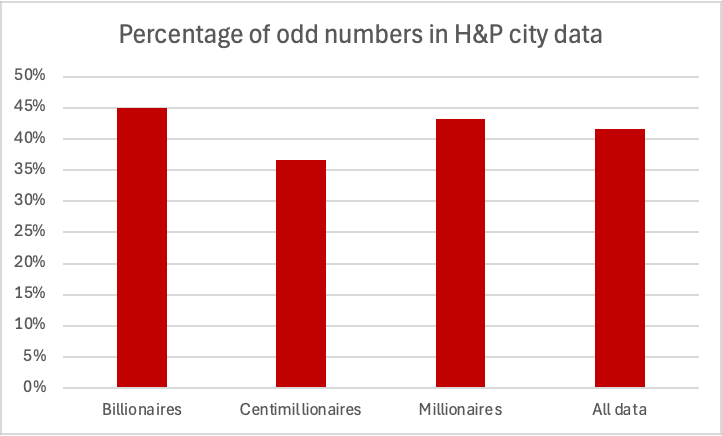
We’d expect to see as many odd as even numbers – but we don’t.12 There are many fewer odd numbers that we would expect: 42.5% out of 299 datapoints. The chance of such a result (or fewer) occurring by chance is 0.5%.13
The fact we are seeing such a similar percentage of odd numbers across the $1m, $100m and $1bn data (42.7%, 42.5% and 42.2%) suggests that the same process/person is responsible.
The city data is even more anomalous, with the centimillionaire data having only 37% odd numbers out of 210 datapoints – the probability of that being chance is 0.01%.14
We then looked at the migration flow data, which has been so widely reported.
We checked the last significant digit of the 159 migration‑flow numbers Henley published for 2022 to 2025. 41.5% of these were odd. That’s only 2% likely to have happened from chance.15
Distribution of digits
Another well-established technique for detecting rigged numbers is to count the last digits.
Imagine you’re investigating an election, and you suspect that the figures for the number of voters in each constituency have been faked.
Computers are pretty good at generating random numbers. Humans are surprisingly bad – we have funny biases. So you could go through all the voting figures and count how many times the last digit is a 1, how many times it is a 2 etc. You’d expect all the digit counts to be roughly the same – because for practical purposes the last digit is random, and so there’s a one in ten chance each digit comes up.
If you find that (say) most of the last digits are 0s, 5s and 8s, and there’s only one 1, then you’d have strong grounds for suspecting foul play.
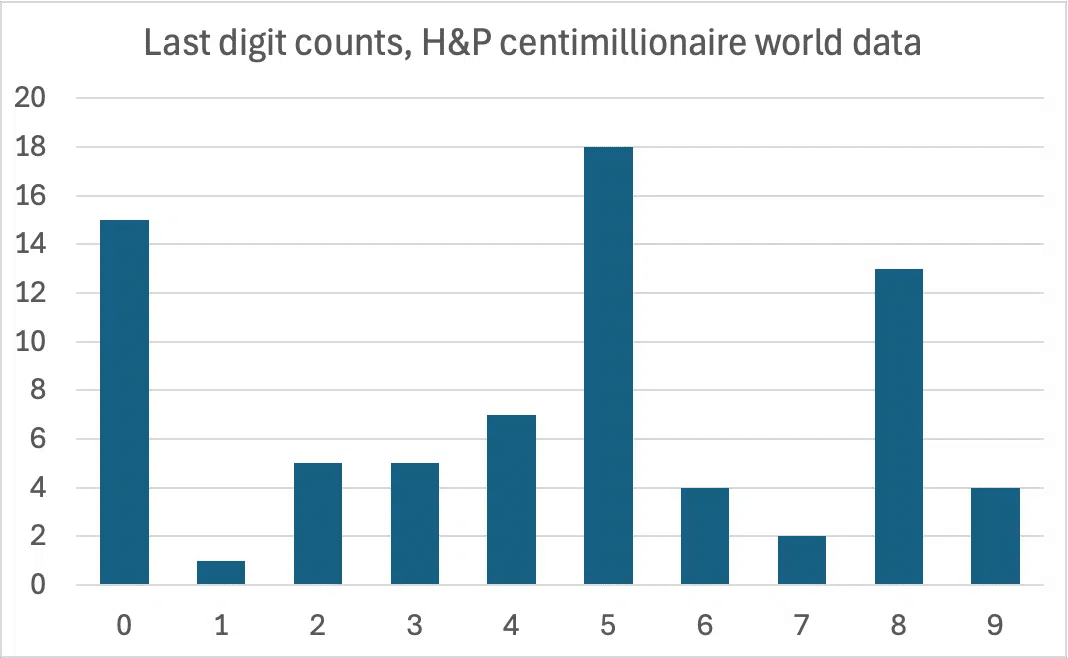
We did just that with the Henley & Partners data on the centimillionaires ($100m+) in each country,16 counting the last digits.17 And it turns out most of the digits are 0s, 5s and 8s, and there’s only one 1:

We can calculate how likely it is that this just happened through chance.
The probability of getting no more than one 1 is 0.4%.18 That’s unlikely – but the probability of the entire distribution being so peculiar is even less likely: 0.00042% or roughly one in 240,000.19
Forensic accountants often scrutinise datasets🔒 for this type of pattern, as it suggests that numbers were not the result of a direct count or measurement but were instead estimated or rounded to convenient figures. While this is common in budgets or forecasts, it is a serious anomaly in a dataset that purports to be a precise count of individuals. The additional spike in the digit 8, coupled with the near-total absence of the digit 1, further strengthens the case for artificial number generation.
We also see a suspicious pattern in the billionaire data:
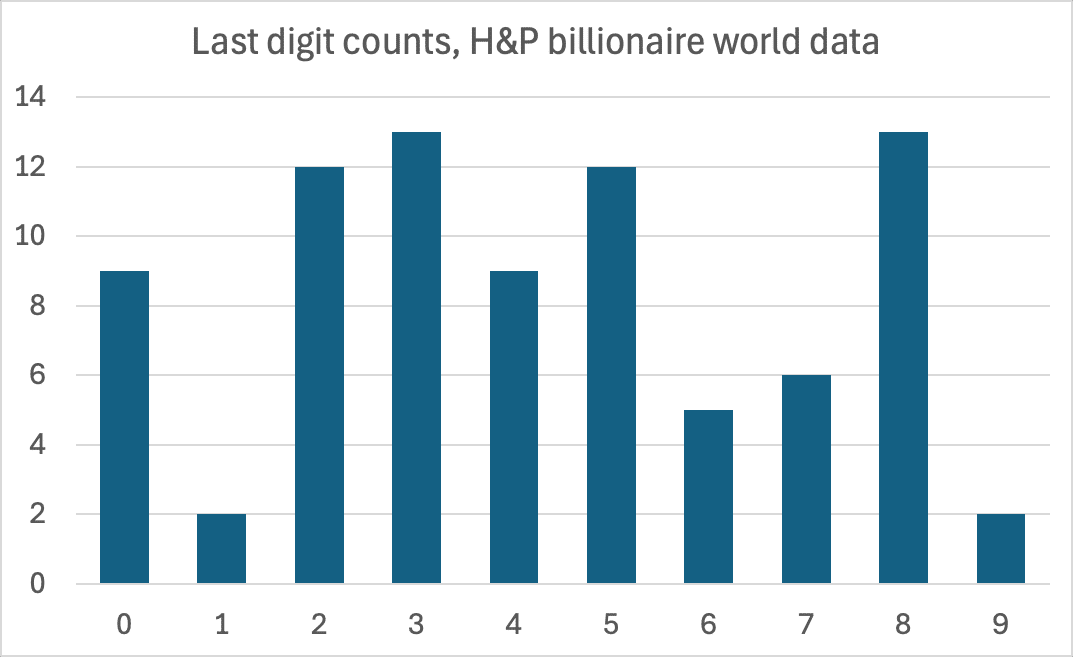
Again a lack of 1s. This isn’t as anomalous as the centimillionaire data, but still only a 2% likelihood such a distribution would arise through chance.20 This time rounding is not a good explanation, because there is no excess of 0s and 5s.
We then ran the same analysis on the Henley & Partners data for the number of centimillionaires in each city, again looking at the last digit:
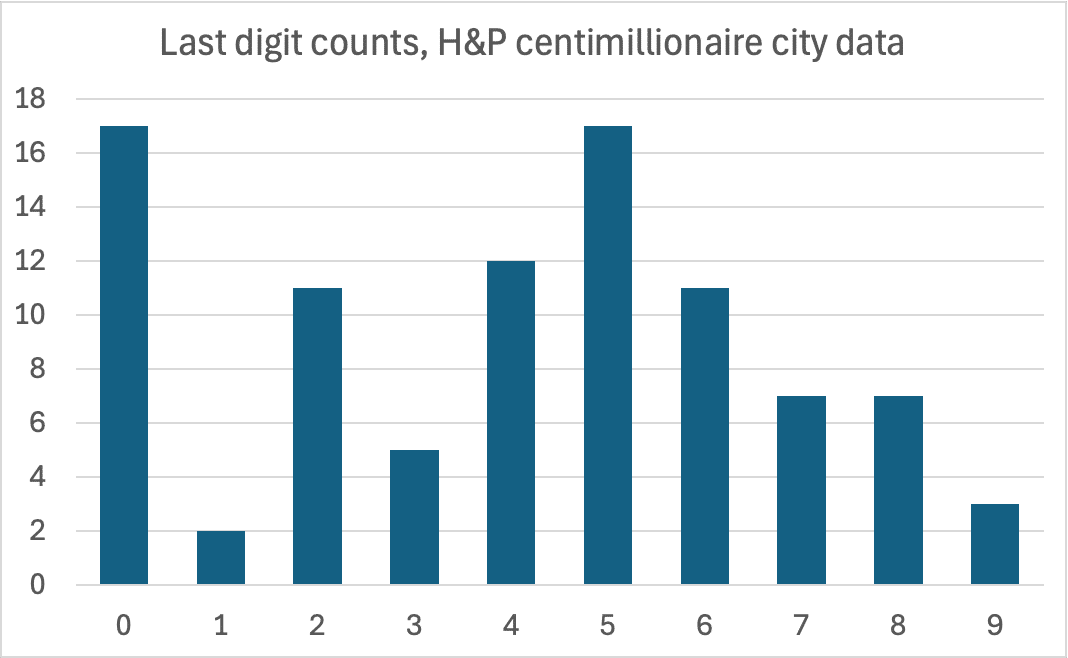
Yet again, few 1s, and a spike of 0s and 5s. The probability of this distribution being chance is 0.1%.21
The city billionaire data has too many repeated entries for us to be able to obtain a statistically valid result.
Interestingly, we didn’t see similar statistically significant anomalous patterns in the city or country millionaire data. 22. We also can’t apply these statistical techniques to the migration flow data, as there isn’t enough variation between the numbers – they’re smaller and rounded.
Do other wealth reports have similar anomalies?
We ran a series of statistical tests on the UBS Wealth Report counts of millionaires.23
Here’s the last digit count, which shows the kind of random distribution we’d expect,24:

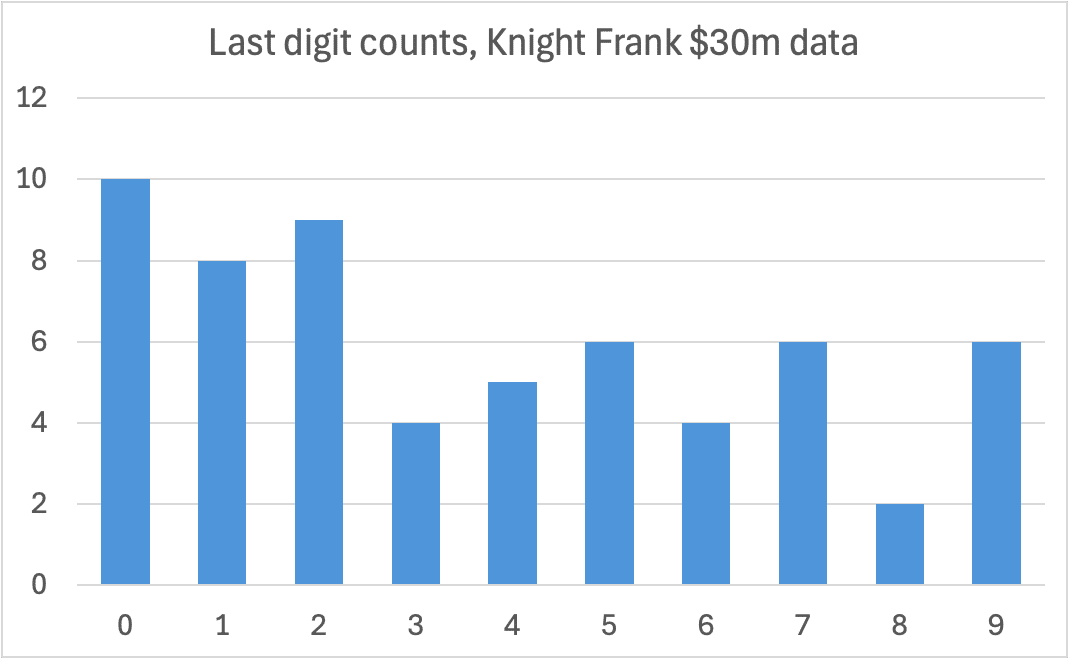
We also looked at data on the $30m population from Knight Frank.25 The smaller number of datapoints mean the distribution is “bumpier”, but it’s well within what we expect from random chance:26
We ran odd number checks against the UBS and Knight Frank numbers, as well as the most recent Forbes count of billionaires by country. All were in the expected range:27
Before the Henley & Partners reports, New World Wealth created migration reports for AfrAsia Bank for 2018, 2019 and 2020. The stated methodology is very different, and so we didn’t pool these with the Henley & Partners data. However, the format of the migration datapoints is very similar, and the data “looks” similar – so it’s noteworthy that when we run exactly the same tests on the AfrAsia Bank migration data as we did on the Henley & Partners migration data, we don’t see anomalous patterns in the AfrAsia Bank data.28
The even-number bias in the Henley & Partners data therefore looks unique:
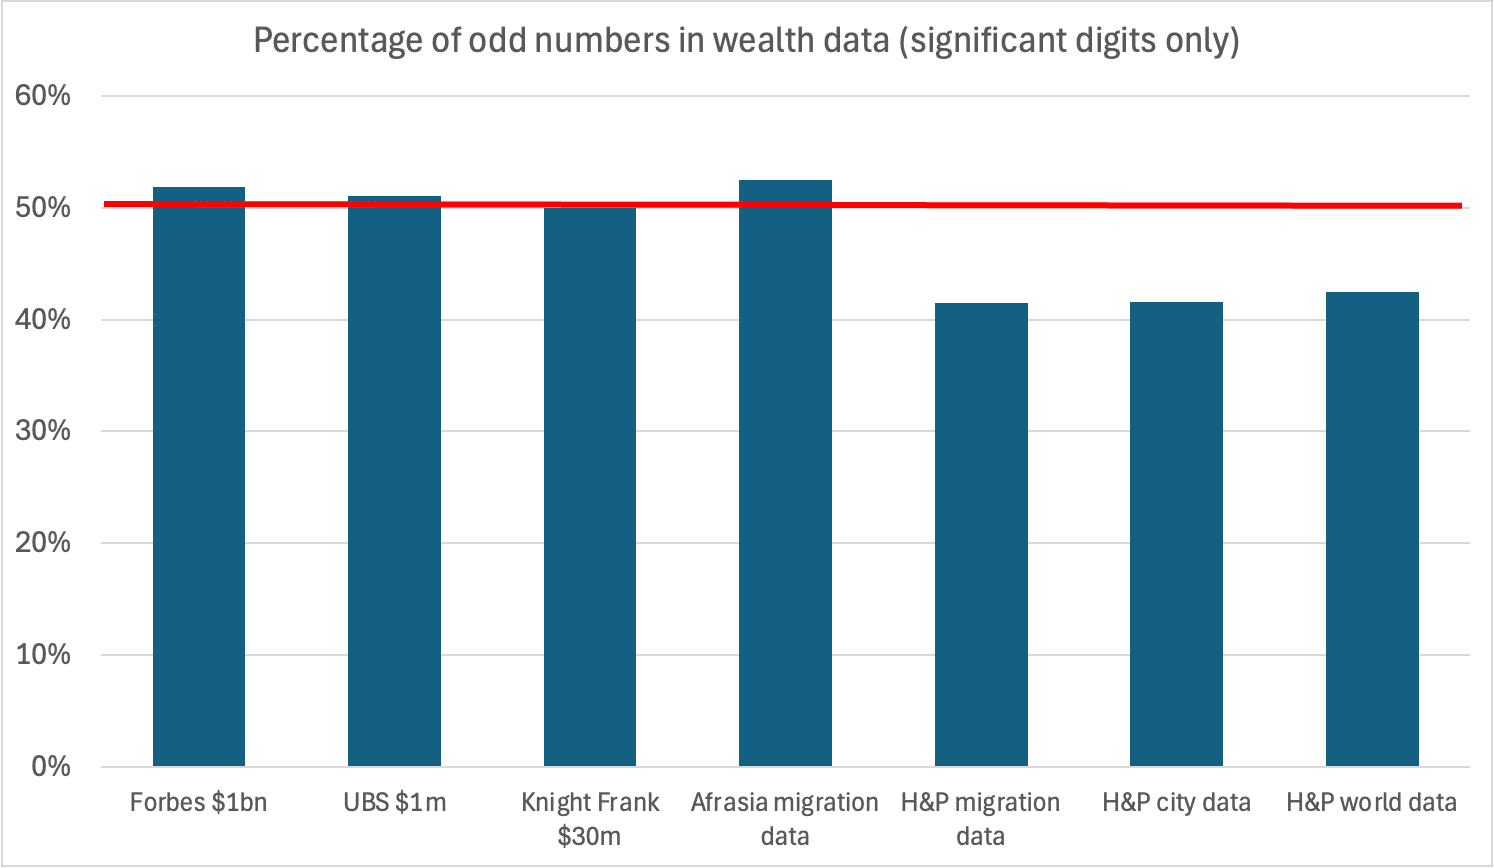
Taken together, five independent sources – UBS, Knight Frank, Forbes, and the NWW AfrAsia migration reports – show digit patterns fully consistent with chance. The anomalies are unique to the Henley & Partners series.
All of our data and calculations are available in this spreadsheet.
What does it mean?
Our analysis shows it is statistically almost impossible for the published centimillionaire and billionaire numbers to be the direct, untampered-with output of a financial dataset or model. The over-representation of figures ending in 0 and 5, and significant excess of even numbers, is a sign of human intervention.
The Henley & Partners migration data also looks highly anomalous, with an even-number bias that can’t be explained by normal processes.
We found a total of nine positive results, out of the 27 tests we ran. The likelihood of this being a coincidence is extremely low – many millions to one.29
This leaves two possibilities. The numbers could be fabricated. Alternatively, and probably more likely, raw numbers are taken from a calculation or model and then manually adjusted for unknown reasons before publication.
If these numbers are fabricated or manually adjusted, then it’s prudent to assume that all the other numbers may be too, particularly given the importance that the Henley & Partners methodology attaches to people with higher levels of net wealth. We’re just fortunate that the centimillionaire, billionaire and migration adjustments revealed themselves statistically; this won’t always be the case.
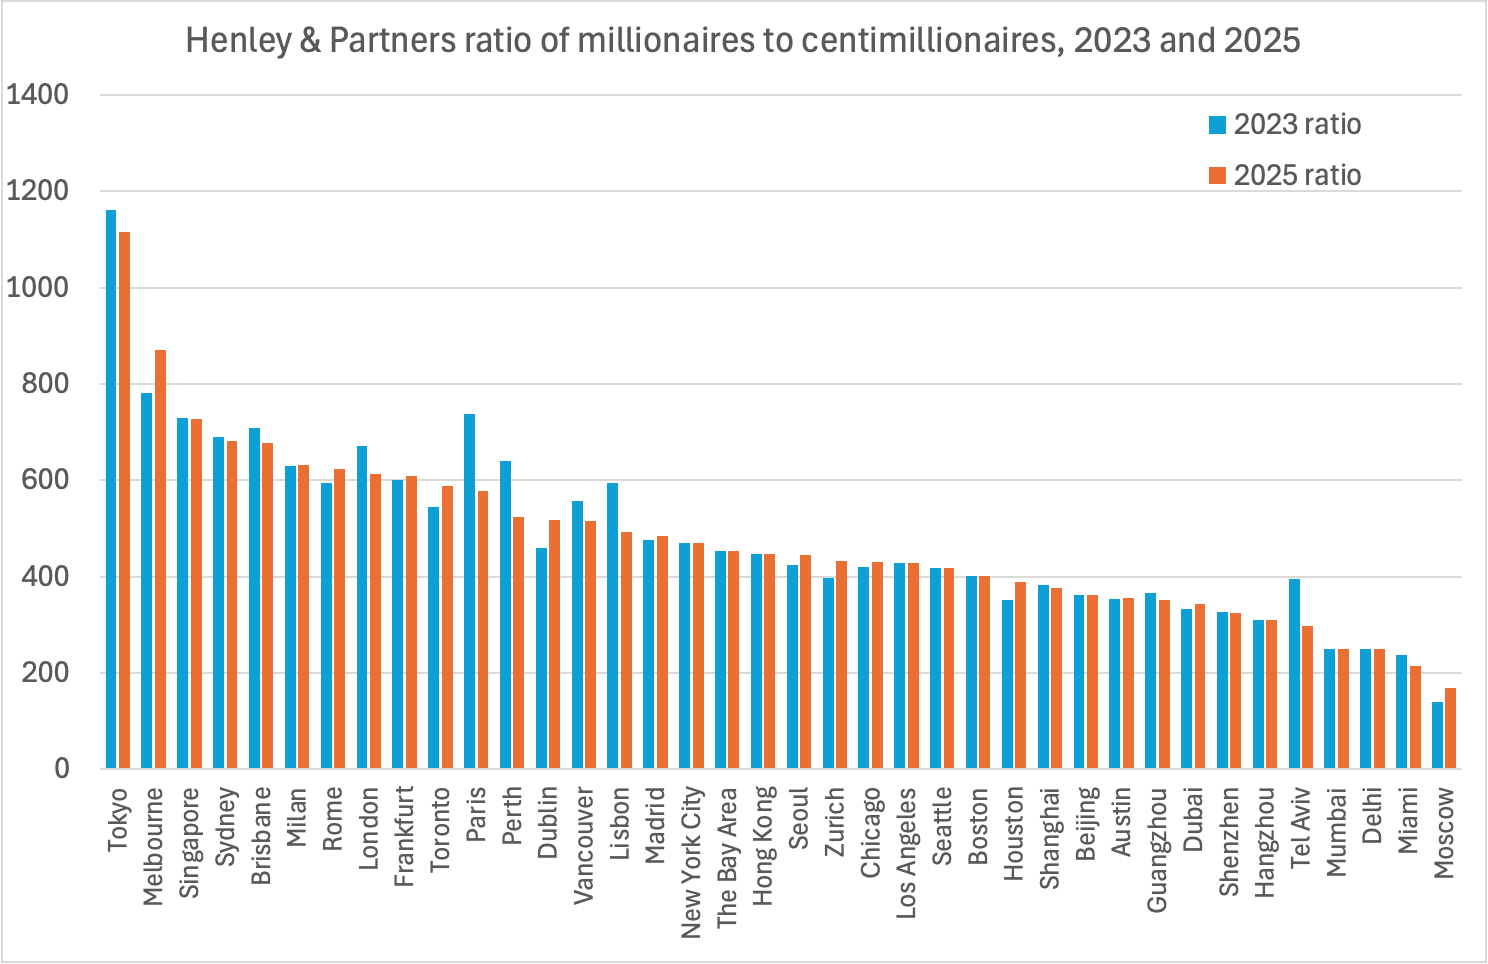
The remarkably steady millionaire/centimillionaire ratio
There are other oddities in the Henley & Partners city data. The ratio of millionaires to centimillionaires is curiously stable from 2023 to 2025:
If we focus on the change in the ratio:
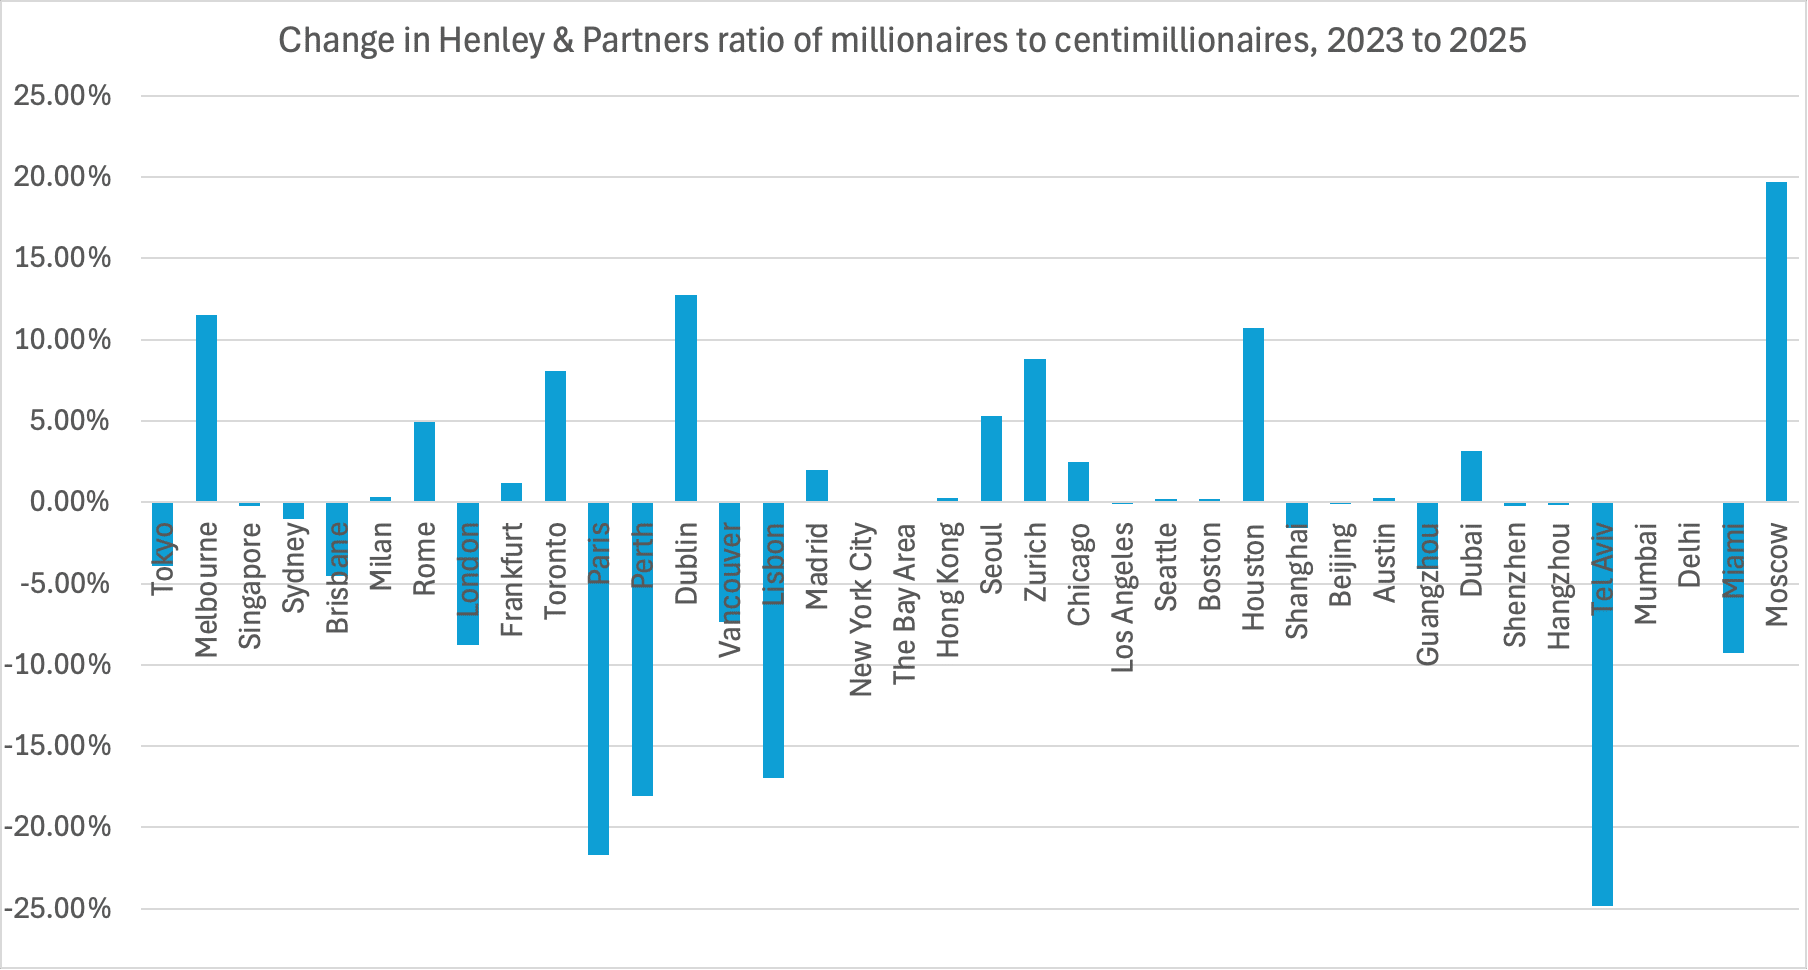
We see fourteen cities (38%) with a change in the ratio of less than 1%. Five (13%) show a change of less than 0.1%, with the numbers of millionaires and centimillionaires just happening to move by almost exactly the same percentage, so that the ratio was largely unchanged.
What’s even stranger is that these five are some of the world’s most economically dynamic cities: New York (0.09%), Los Angeles (-0.09%), the Bay Area (-0.04%), Delhi (0.01%) and Mumbai (0.07%).30 This adds to our sense that the data is artificial.
In reality we should see random noise in the millionaire and centimillionaire data. So an interesting question is: if millionaire and centimillionaire head‑counts are measured quantities that are correlated, but also wiggle around through ordinary economic forces, how often would the ratio between them end up almost perfectly unchanged?
We can answer this with a “Monte Carlo” simulation – running a million iterations on a computer in which we keep the millionaire/centimillionaire counts highly correlated, but add a degree of random noise (with the amount of noise taken from other wealth reports). We can then count how many of those million runs saw five or more cities with a change in ratio of 0.1% or less. This gives us a robust estimate of the likelihood of this occurring through sheer chance.
The result: only a 0.03% chance that five cities would see so small a change in ratio. The most obvious explanation: New World Wealth are applying an assumed common growth/shrinkage rate for some of the numbers, not a measurement.
The data with the ratios is on our spreadsheet, and the code for the simulation (with full notes) is on our GitHub.31
The stated methodology is not possible to apply
The credibility of the Henley & Partners report rests upon it being able to identify millionaires, and then track them.
We don’t believe either is possible.
The description of the methodology for both 2024 and 2025 is extremely thin. There are significant changes between years, with additional data sources cited in 2025, but the consistency of the last three years’ results suggest that the methodology itself has not changed.
The firm that created the report, New World Wealth, has one employee. It’s plausible that one man could use public sources to identify CEOs and other prominent wealthy individuals, and then scrape LinkedIn data to find less prominent individuals in high-earning professions. However, other aspects of the methodology do not seem possible for even a large team to accomplish, much less one man:
- Determining listed company holdings for CEOs is reasonably straightforward. For the very wealthy with a public profile, public estimates of wealth are available. Estimating wealth for less public people, on an individual (rather than population) level, is not possible. The idea that investment holdings, cash, and (in particular) crypto holdings can be identified on an individual is far-fetched. HMRC can’t see cash holdings – how can New World Wealth?
- Determining property holdings (until they were excluded in 2024) is again not possible – either individually or at scale. Even those countries with public land registries, like the UK, don’t let you carry out reverse searches (i.e. finding where a named person lives).
- The report also claims to assess net wealth, i.e. deducting levels of debt. We are unaware of any technique that can, either individually or at scale, determine a person’s level of debt.32
- The methodology claims to track investment migration program statistics. However, these statistics are usually not available.33
- There are then oddities like claiming to use “statistics from high-end international removal firms”. We don’t believe this could be integrated into migration data in a useful way.
- The report claims to determine the “true” location of high net worth individuals (particularly investors with net worth of over $30m) using “LinkedIn and other business portals”. That is not possible. LinkedIn data is not reliable.
- NWW also claims to use “company registers — with a focus on filings by directors that indicate a change in country of residence”. However company registries are not openly accessible in most countries and, when they are, residence is usually not kept up-to-date.34
- Even where high net worth individuals could be identified on LinkedIn, linking that data to other data about the same individual is not trivial. Even linking one name to UK Companies House entries is notoriously difficult. Yet New World Wealth would have to do this for 150,000 individuals worldwide. We don’t believe it’s possible, and certainly not for a one-man firm. So if even they could track millionaires, and could track migration, they wouldn’t be able to marry the two datasets up.
- For the very wealthiest, determining the place of residence is often not possible even conceptually: they often have multiple homes in multiple countries, and spend no more than a few months in each one. Even tax authorities can struggle to assess residence.
- The author of the study claimed in an interview with Tim Harford that NWW “track people on LinkedIn and other business portals” and that “the bulk of the database is between $20m and $100m in assets”. We don’t believe LinkedIn can be used to identify 75,000+ people who have more than $20m in assets.
- There is a suggestion in the report that the true methodology is to estimate salaries35 and then assume that someone with a salary of $200,000 will typically have a million dollars in net liquid assets. If so, this is a bad mistake – the assumption is not correct. HMRC and ONS data suggests that about 3% of UK taxpayers earn £150k/$200k, but only about 1% of UK taxpayers have net financial wealth of £850k/$1m. The reason is obvious: if you earn £150k then your take-home pay is around £91k. It’s certainly possible to save $1m on that income, but it will take decades rather than years.
- Before New World Wealth created reports for Henley & Partners, its client was AfrAsia Bank. These reports present apparently comparable (and very similar) migration data but the only cited sources are investor visa programme statistics (which, as noted above, are very limited), interviews with HNWI intermediaries, and tracking HNWI media reports of migrations and property purchases. All of that LinkedIn data appears to have made little change to the results.
- If New World Wealth really did track 150,000 individuals’ on LinkedIn they would have to be registered under GDPR in the UK and at least one EU country. New World Wealth are not registered in the UK and we haven’t located any EU registration.
One experienced wealth researcher told us:
“The only asset class for which I would believe they might have semi-reliable info is major shareholdings of listed companies – which is what most of the Sunday Times Rich List relies on. Anyone claiming they have good public data on any other asset class is making it up; it simply does not exist.“
The H&P reports contradict other data
The number of UK millionaires and centimillionaires in the Henley & Partners reports contradict official statistics:

The stated number of dollar millionaires in the UK – 578,400 – is too high. We have reasonably reliable data from the ONS, which shows that about 1% of UK taxpayers have net financial wealth of £850k/$1m, i.e. around 300,000 people.
Conversely, the stated number of dollar centimillionaires in the UK – 730 – is much too low. HMRC data suggests the correct number is around 3,400.36
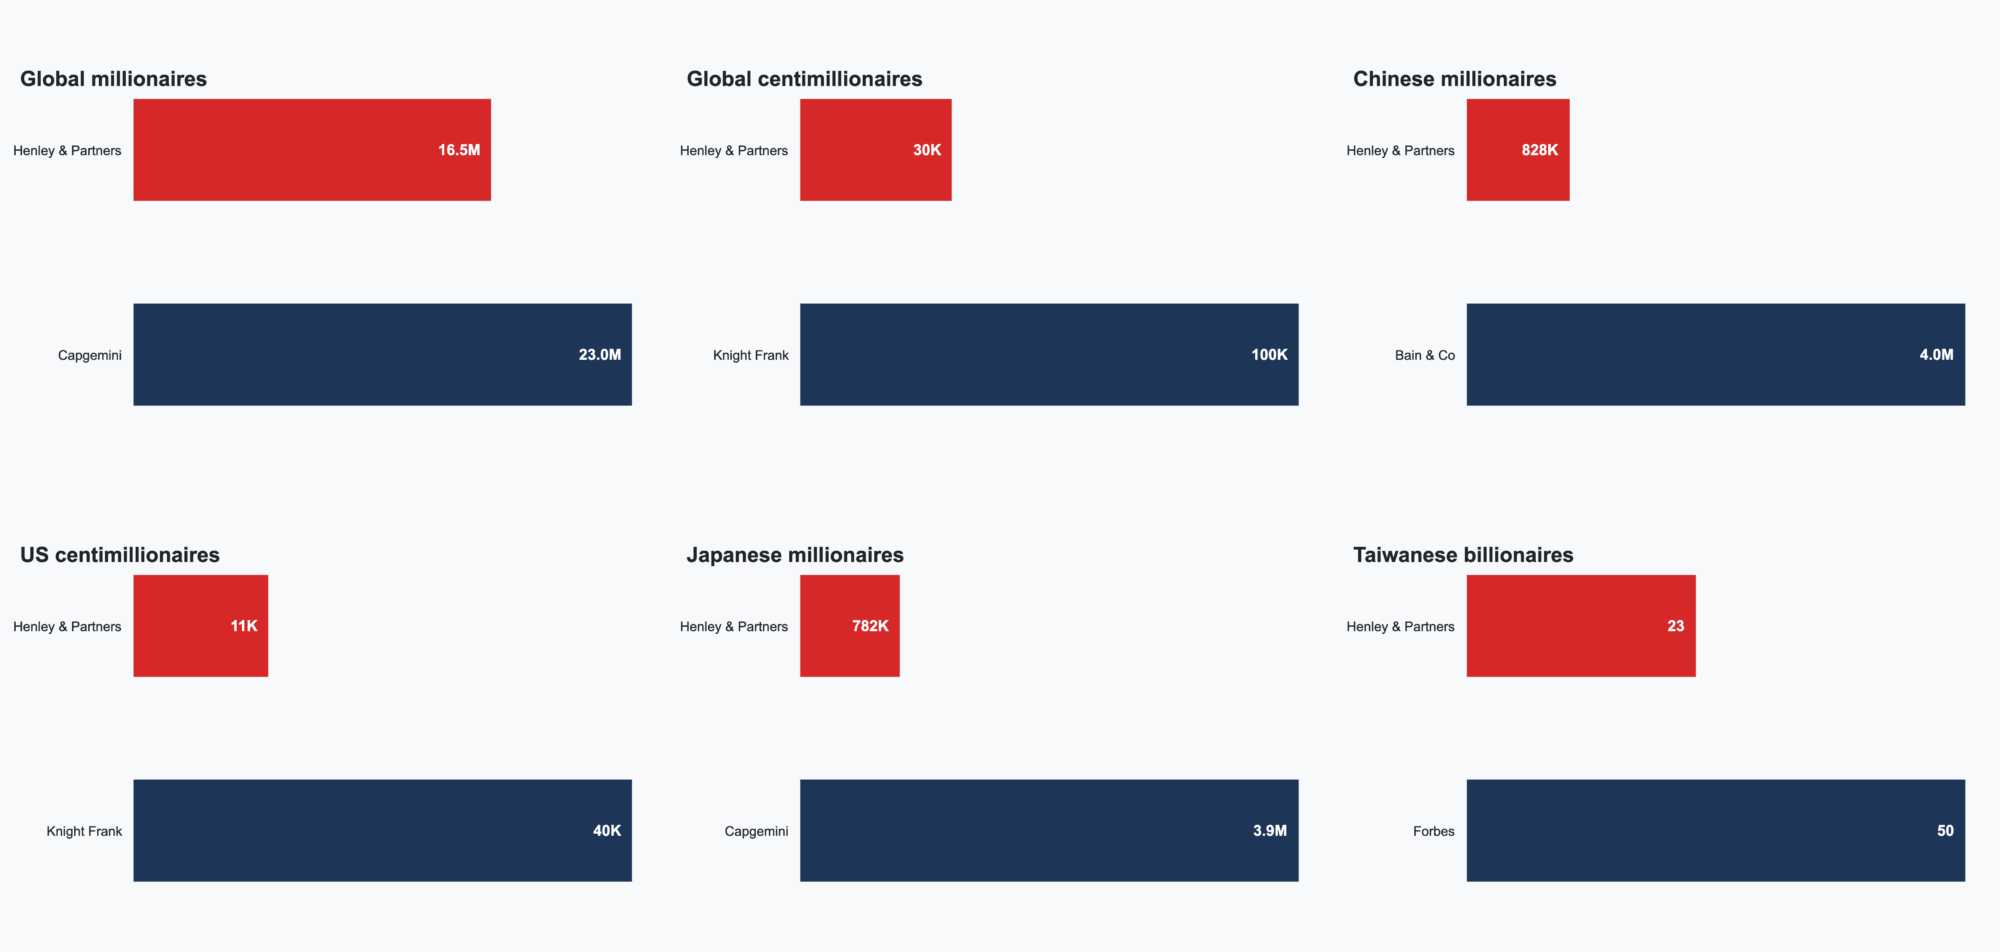
Given there are about 3,400 centimillionaires in the UK, the idea there are only 10,000 in the USA, and only 30,000 in the world, seems far-fetched.
There are numerous other results that look odd. Checking almost any figure with other reports (e.g. Bain & Company, Knight Frank, Capgemini, Forbes) makes Henley & Partners look like an outlier:37
The results aren’t representative
When we want to investigate something about a large population – voters, shoppers, or millionaires – we usually can’t speak to everyone. So we survey a subset called a sample.
For the survey’s conclusions to be trustworthy, that sample must be representative: its members should mirror the broader population’s key characteristics (age, income, geography, attitudes, and so on) in roughly the same proportions. Sometimes you can achieve this by picking people randomly (for example when conducting an exit poll). Often you can’t, because the way you are picking people will skew the results (people who answer a landline are likely more elderly than people who don’t).
A well-designed study therefore begins by defining the population clearly, selecting participants who reflect that population (as best you can), and then applying statistical weights or other adjustments to correct any imbalances that remain. Bigger samples help reduce random error, but sheer size cannot fix systematic bias: if the people you reach are untypical, larger numbers merely give you a very precise answer to the wrong question.
The Henley & Partners report claims to survey 150,000 people (assuming for the moment this is true). The methodology says there is a “special focus” on those with over $30m of listed company holdings, and the “primary focus” (50% of the database) is on company founders. These are two different things. But all the published data talks about “millionaires” (defined to mean $1m liquid wealth). These are different groups of people, and conclusions about one group do not apply to another. That suggests that the sample is highly unrepresentative.
Economic journalist Tim Harford interviewed the author of the report last year, and asked why he didn’t use a representative sample. The response was: “Well I would argue it is a representative sample. 150,000 people, that’s a lot… polls are normally done on less than 1,000. So 8,000 [the number surveyed in the UK] is quite a big number”. This is not how statistics work – an unrepresentative sample does not become representative as it gets larger.38
It is very surprising that the author of so widely cited a report has never heard of statistical sampling.39
One might conclude from this that the survey places an unrepresentative weight on the very wealthy, and so over-estimates $1m millionaire movement, but provides a good guide to $20m+ millionaire movement. We don’t think that would be correct, because even if the report really surveys the $20m+ population accurately, the people sampled are not representative of that population.4041
Tax Justice UK recently published a paper critiquing the Henley & Partners report.42 We agree with many of the statistical and methodological criticisms made by TJN. We don’t agree with TJN’s subsequent use of the report as evidence that that only 0.3% of millionaires are leaving the UK and therefore there is no “exodus”. The 0.3% figure would be wrong even if Henley & Partners were right43 but, more importantly, if a report has no statistical validity then the correct answer is to say that no conclusions can be drawn from it.
Henley & Partners’ response
We put the issues identified in this report to Henley & Partners. They haven’t seen any more detail on the New World Wealth data than is visible on their website, and they don’t appear to have anyone with statistical expertise on their staff. If the report is fabricated, they don’t know it.
Henley & Partners did say that the consistency of the report, and the fact it showed trends that matched their practical experience, made them believe it was real. But it’s hardly a surprise that the report matches Henley & Partners’ experience, because it uses client data from Henley & Partners.
Nor is “consistency” an answer to our criticisms. The reports may be consistent44 – but it seems likely they are consistently wrong. And the “consistency” is itself problematic when the methodology changed so dramatically from 2023 to 2025.
We wrote to New World Wealth for comment on two occasions before publishing this report, but did not receive a response. As noted above, they admitted to the FT that the methodology had never included property (even though it said it did). They didn’t respond to the FT regarding the other irregularities in the data.
New World Wealth’s founder and sole employee, Andrew Amoils, did provide comments to Spear’ Magazine. These are illuminating:
“In response to the claims made about the removal of property wealth from the methodology, Amoils said that only a very little amount of debt-free investment property was included previously and so the ‘impact of stripping it out was small’”
This looks like an evasion. Until 2024, New World Wealth claimed to include all real estate in their figures. In 2024 they removed indebted property. In 2025 they removed all property. These changes should have resulted in a c20% fall in millionaires in London, New York, and other cities where real estate makes up a significant component of wealth.
“On being the only person at his firm, Amoils said: ‘The “one-man firm” argument sounds good in print. However, the truth is even the big market research houses of 500 plus employees don’t put their whole team on a wealth report. They would typically put three people max.’”
This again looks like an evasion – Mr Amoils is not actually denying that he is the sole author of the New World Wealth reports. As for his claim that other firms only name three people as authors of wealth reports, this is from the 2025 CapGemini wealth report:
And:
“He added that the quantity of even numbers was a consequence of the rounding system he employed, where figures are rounded to the nearest 50, 100 or 1,000 depending on the report. ‘It is important to remember that our figures are not exact, they are modelled estimates, which is why we round them,’ he says.”
Mr Amoils either hasn’t read this report or hasn’t understood it. We looked at the last significant digit. What we saw wasn’t rounding, but something much more suspicious, for example:
The relevance for the UK non-dom debate
The 2025 Henley & Partners report estimates that net departures in 2025 will be 16,500 – around 1% of UK millionaires. This figure has been widely reported as part of the “non-dom” debate.
The many anomalies in the report mean that we consider the 16,500 figure to be meaningless. There’s also a more fundamental problem: figures on millionaires leaving cannot be translated easily into figures on non-doms. There are around 300,000 people in the UK with net liquid assets of $1m, but only about 21,000 non-doms (many of whom are not millionaires).45
The OBR expects 25% of the wealthiest non-doms to leave (those who use trusts) and 12% of other non-doms.46 The private wealth advisers we speak to estimate that perhaps 5% to 10% have left already. That’s fewer than 2,000 people – they’ll be invisible in even accurate estimates of the total numbers of “millionaires” leaving the UK.47
Our conclusion
The Henley & Partners reports do not do what they say they do. They do not count millionaires, centimillionaires and billionaires by reference to their “liquid investable wealth”. They don’t track migration. The stated methodology isn’t applied, and is probably impossible to apply. There are, at the least, significant manual adjustments to the figures, for whatever reason. The figures contradict authoritative data.
We believe Henley & Partners should withdraw their reports until they have been audited by a suitably qualified independent third party. In the meantime, they shouldn’t be relied upon by policymakers, journalists, or anyone seeking to understand global wealth or migration trends.
Many thanks to B and K for their help with this report, D and I for their statistical and methodological analysis, P and C for their forensic accounting expertise, Y for country advice, and all the private wealth experts who spoke to us.
Our spreadsheet with the forensic analysis and statistical calculations can be found here. All data from Henley & Partners/New World Wealth, UBS/Credit Suisse, Knight Frank, Forbes and Cap Gemini is their respective copyrights, and reproduced here for the purposes of criticism and review, and in the public interest.
Footnotes
At the end of this article we discuss what the actual migration figures may look like. However we note this point up-front because we don’t want this report to be used to suggest that non-doms are not leaving the UK. We believe it’s clear that they are (and also clear that this is what the OBR expected). ↩︎
Earlier reports were consistent with this. The 2022 Global Citizen reports said “private wealth” includes property (there were multiple reports that year and they are consistent). The Africa report from 2022 says “It should be noted that the average HNWI worldwide has the bulk of their wealth tied up in residential property and equities, so large movements in these two segments impact heavily on the total private wealth held in a country”. The earlier NWW reports for AfrAsia Bank included property. ↩︎
So, for example, someone who borrowed $1m against their $5m penthouse will have had $4m of wealth identified in the 2023 report which disappeared from the 2024 and 2025 reports. Mortgaging property is common even for the very wealthy, either to avoid “locking up” cash in non-yielding assets, or for tax purposes. Similarly, real estate held for investment (even by the very wealthy) will normally be leveraged, because it increases the yield. ↩︎
The main 2024 report is a little more ambiguous – it doesn’t define the term “wealth”, but says that property has a “significant impact on wealth”. ↩︎
There are various public lists of large crypto investors; they are unreliable and only reflect a small proportion of the overall population. ↩︎
Although, when interviewed by Tim Harford, the author of the report said he “mainly” surveyed “listed company holdings and some cash holdings”. ↩︎
The number is much lower higher up the wealth scale. Capgemini estimate that 14% of high net worths’ net wealth is in real estate; UBS estimate 13%. Knight Frank estimate 20%; real estate debt is probably around a third of this. ↩︎
If we give households the full benefit of a 30 % equity rally over this period, and (generously) assume they are one-third invested in equities, the elimination of property wealth means anyone worth $1m to $1.2m in 2023 would cease to be a millionaire in 2025 (because $1.2m x (1/3 x 1.3 – 2/3) is less than $1m). A Pareto distribution with α ≈ 1.35 implies around 54,000 people in London fall in that range – roughly 20% of all millionaires. ↩︎
There are also undocumented changes in methodology. The 2022 “Global Citizen Report” figures are substantially different from the 2023 figures, with the number of UK millionaires falling by 12% and the number of Japanese millionaires falling by 30%. Possibly the Global Citizen report is using a different approach – but the lack of any published methodology means we don’t know what. We have excluded the Global Citizen data from our report, although it may bear further analysis. ↩︎
The 2021 Henley & Partners reports don’t contain any detailed data. For earlier years, New World Wealth reports were published by AfrAsia Bank in 2018, 2019, 2020. The stated methodology is very different (see further below), so we didn’t pool this with the Henley & Partners data. However we did check for odd/even numbers and did not see anomalies in this dataset – see below. There was no data for 2020/21 because of lock‑downs and border closures. ↩︎
We were pooling different years’ of data, which is appropriate provided the odd numbers across the data are independent. This is generally the case, with the exception of the billionaire data, where three countries had a repetition year-on-year. We removed the repetitions from the datasets (but retaining the repetitions does not materially change the result). ↩︎
There’s an important but subtle point to watch when applying these techniques. Rounding can produce outputs which are skewed towards even trailing digits if a rounding mode known as “round-to-even” or “banker’s rounding” is used. Spreadsheets generally don’t use round-to-even rounding, but most programming languages do. Great care therefore needs to be taken when applying forensic techniques to data which (for example) was created by a computer programme which rounded a pre-existing dataset containing figures to one decimal point. In such a case, banker’s rounding of random numbers would only be expected to produce 45% odd trailing digits. The likelihood of observing 127 odd numbers in a sample of size 299 would therefore be 20.6%. However, the issue becomes much less significant where the underlying dataset has more than one decimal point (as 2.5 would round to 2, while 2.51 or 2.501 would still round to 3). We therefore don’t believe banker’s rounding explains the results found in this report. ↩︎
One-tailed binomial test, p = 0.0054. The individual results are not significant: p = 0.094, p = 0.066 and p = 0.084 respectively; however given all the results are independent outputs of one process, it is appropriate to pool them together. ↩︎
Centimillionaire result, p = 0.000068, millionaire result p = 0.035, billionaire result p = 0.084, overall result p = 0.000018, but obviously that is dominated by the centimillionaire result. There are repeated datapoints in the billionaire set so, even if we had found a significant result, we would have regarded it with scepticism. ↩︎
p = 0.019. Most of the migration flow numbers are given to the nearest hundred, and so we divide by 100 to obtain the last significant digit. However in 2025 (but not earlier years) numbers under 500 are rounded to the nearest 50. For the 2025 dataset only, we therefore divided all numbers under 500 by ten. We were concerned this might have introduced an element of subjectivity and therefore double-checked by instead binning all migration numbers under 1000 for all years. That left only 58 numbers, of which 38% had an odd last significant digit (p = 0.0060). We are therefore reassured that we did not inadvertently bias the data (and 58 is still high enough for validity). The curious consequence of binning numbers below 1,000 may indicate a higher level of manipulation for larger countries. ↩︎
We used all their data from 2023 to 2025 – as we note above, the 2022 data appears to use a different methodology (for an unknown reason), and we don’t think it’s appropriate to assume that the earlier AfrAsia reports are comparable. For many statistical tests one wouldn’t put different years together, because that means the datasets aren’t independent. However for this test it’s different, because we’re looking at the last digits. None of the centimillionaire number counts remain the same year-on-year, and so we can regard them as independent and pool the years. The first digits however would not be independent (because it’s likely the first digit of the millionaire count would be the same year on year), and so we did not test for first digit frequency. ↩︎
But only where there are three digits in the data, because otherwise you get a Benford-style distribution. For trailing digits, Benford converges to uniform as soon as we get past the first two positions. ↩︎
There are 74 last digits. The chance that none are a 1 is 0.90 ^ 74 = 0.00041. The chance that only one is a 1 is 74 x 1/10 x (9/10) ^ 73 = 0.0038. Adding them together = 0.4%. ↩︎
We used a chi-squared test – this is a statistical test that compares an observed frequency with an expected frequency, and calculates the likelihood that the difference is due to chance. ↩︎
vs a uniform distribution, p = 0.016. A Benford test is unlikely to be appropriate here, but we ran as a check, and p = 0.015. ↩︎
Chi-squared p = 0.0011. ↩︎
We can’t use the last digit, because the data is rounded to the nearest hundred, so we looked at the “thousands” digit instead. That found no anomalies. A Benford-style test on the first or second digit doesn’t give a statistically significant result, because the number of datapoints in any one year is too small, and combining years is not appropriate because (unlike last digits) first (usually) and second (often) digits are consistent from one year to the next – the datasets aren’t independent. ↩︎
Full data is available for 2020 and 2019 to 2025. The UBS definition of “millionaire” is different from Henley & Partners’, because it isn’t limited to liquid wealth, but that’s not relevant for the purpose of these forensic tests. ↩︎
p = 0.53 vs a uniform distribution. ↩︎
Comparable data is only available for 2022 and 2023. ↩︎
Last digit p = 0.44 vs uniform distribution. ↩︎
51% of the 180 UBS numbers are odd (binomial p = 0.42), 50% of the sixty Knight Frank numbers (p = 1), and 52% of the 81 Forbes billionaire counts (p = 0.41). ↩︎
52% of the 61 AfrAsia migration datapoints were odd, p = 0.40. ↩︎
When running several different tests against multiple data sources there is always a risk of achieving positive results solely through chance. More cynically, a researcher can keep running different tests against different subsets of data until eventually finding significant results (i.e. cherry-picking or “p-hacking“). It is therefore important that we disclose all the tests that we ran, with positive and negative outcomes. There were seven H&P datasets – millionaires, centimillionaires and billionaires for cities and the world, plus the migration data. On each of these datasets we tested first and (except migration) second digit Benford’s law, last digit distribution and last significant digit odd/even. That’s a total of 27 tests, of which nine were positive (p <= 0.02). If the data was in fact not anomalous, we’d (on average) expect to run 50 tests before chance gave us a p = 0.02 positive. The chance of fluking nine or more positives under a binomial (n = 27, p = 0.02) model is 1.7 × 10⁻⁹ (≈ 1 in 600 million, but this understates quite how unlikely it is, given that in most cases our results were more significant than p = 0.02). ↩︎
This can’t be down to rounding, because NWW give precise centimillionaire numbers and millionaire numbers to the nearest hundred (so for e.g. London that’s four significant figures. ↩︎
We deliberately used low‑ball volatility (5 % vs the 8 to 15 % many surveys record) and a high 0.7 correlation between centimillionaire and millionaire numbers; even under those gentle assumptions, the odds of five major cities seeing <0.1 % ratio movement are ≈ 0.03 %. Tougher but still realistic parameters drive that probability essentially to zero. If we go the other way, and make the correlation unrealistically high – 0.95 – the probability of seeing five cities with so little change remains well below the usual significance level: 0.5%. ↩︎
Nor do we believe it would be possible to use rules-of-thumb, e.g. average levels of debt, and obtain a meaningful result. ↩︎
There are some exceptions. The UK, US, Portugal and Greece publish data (e.g. Portugal attracted around 2,000 high net worth individuals over ten years). Italy published figures in the numbers taking advantage of its flat tax scheme for wealthy migrants: from 2017 to 2023, around 4,000 people used the scheme. The numbers are small and (even where available) have little impact on country migration figures. ↩︎
For example, Norwegian-born billionaire John Fredriksen has left the UK, and even though one would think he has a strong incentive to update his Companies House entry to reflect this, he has not done so. ↩︎
For example by scraping job titles/employer from LinkedIn and then using other sources like Glassdoor and Payscale to estimate the salary. ↩︎
In this document, HMRC says there are 5,000 people with £50m+ of assets and 2,500 people with £100m+ of assets. We understand these are more than estimates, and that HMRC actively monitors this population individually. We can use these figures and the number of millionaires from ONS data to estimate the number of people with £73m/$100m of assets. Note that there are credible studies showing that the wealth of the very wealthiest is systematically under-counted, and therefore not always visible to HMRC – HMRC doesn’t know the number of billionaires in the UK. Hence the true figure for the number of centimillionaires may well be higher than the 3,400 figure. ↩︎
Estimating wealth on a global scale is a difficult undertaking. We understand the Capgemini, UBS etc wealth reports are assembled by large and capable teams, and the UBS report is led by a respected professor. However the methodologies are not fully open, and we would regard all these estimates as approximations. ↩︎
The fallacy that a large survey will be accurate was most famously illustrated by the Literary Digest, who surveyed 2,376,523 readers for their poll of the 1936 US Presidential election, and got it spectacularly wrong. Modern opinion polling uses much smaller samples, but with careful statistical controls. ↩︎
Other elements of the reports suggest the author is out of his depth. A peculiar section criticises GDP for, amongst other things, counting value multiple times, and not including wealth. The first point is just a basic mistake – GDP counts the added value at each point – there is no double/multiple counting. The second point is more fundamental: GDP does not include wealth, because wealth is a stock and GDP is a flow. ↩︎
Even if these issues were resolved, the total for migrated wealth would still be incorrect. The methodology section says it’s arrived at by multiplying the number of movers by national average wealth. That’s a very naive approach: wealth distribution is highly skewed and migrants tend to be atypical. You also can’t assume that wealth migrates – a wealthy UK non-dom will almost inevitably have most of their wealth offshore (because that’s how they benefit from the non-dom regime). If they migrate, that offshore wealth won’t be moving. ↩︎
Nor do we think one can simply adjust the Henley & Partner country figures to reflect the difference between their count of millionaires in each country and more robust data – there are too many fundamental problems with the report and its claimed methodology. ↩︎
Available here⚠️, password no#exodus. There is an updated version here and a further update here⚠️ ↩︎
TJN takes the reported Henley & Partners migration figures and divides that by the number of millionaires reported in the UBS Global Wealth report but – as TJN themselves note (page 5 here⚠️) the UBS figure is for all dollar millionaires, whilst the Henley & Partners figure is (supposedly) counting liquid assets only. You cannot divide one measure by another completely different one. ↩︎
Although the 2022 Global Citizen data certainly isn’t. ↩︎
See this OBR paper, paragraph 1.10. ↩︎
See paragraph 1.17 of the OBR paper. ↩︎
The number of really wealthy UK non-doms (i.e. billionaires) is so small that statistical techniques are unlikely to be viable approaches for estimating their migration levels. The only way to obtain reliable data will likely be to either identify specific individuals leaving (not easy, without being able to count the days they’re in the UK), or for HMRC to publish its data (which will itself be incomplete). ↩︎

Samuel Leeds: the “property guru” and his bogus tax loopholes
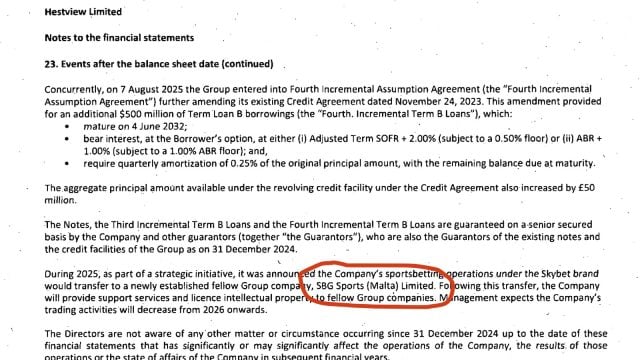
Betting on tax avoidance – is Sky Bet avoiding £55m tax per year?
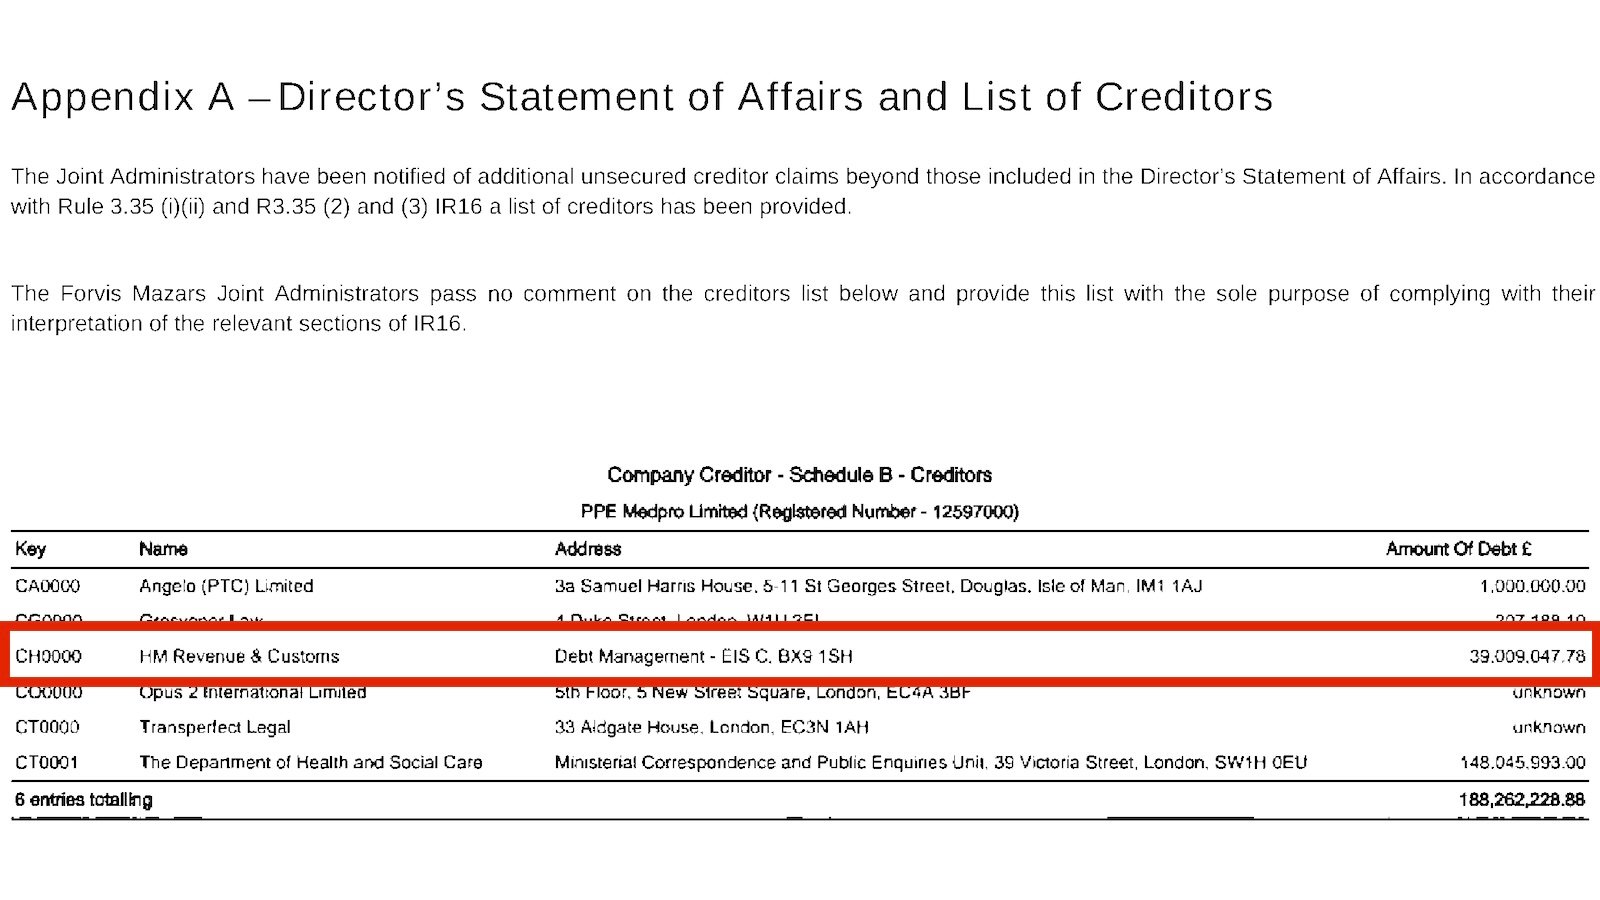
Douglas Barrowman and Michelle Mone may have avoided tax on their £65m PPE profits
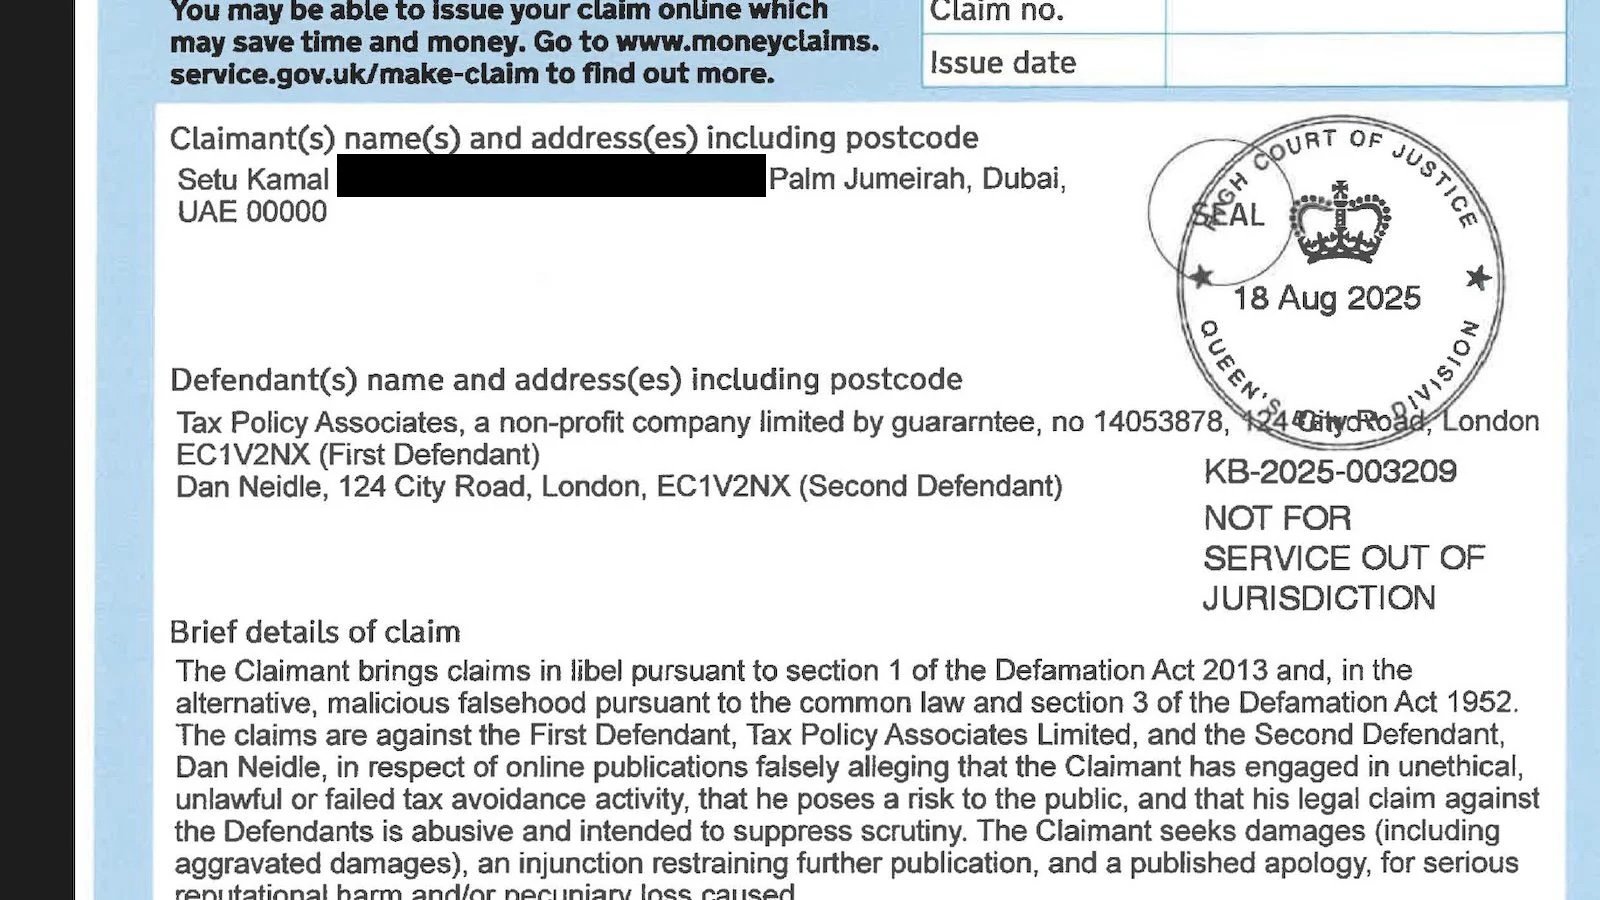
I’m being sued for £8m for a report on tax avoidance
Carter-Ruck enabled the $4bn OneCoin fraud. Was it a crime?

Leave a Reply