It’s sometimes said that we should go back to the tax system of the 1950s, 60s, and 70s, with very high rates of tax on the highest earners. We’ve spoken to people who were around at the time – both tax avoiders and HMRC officials – and looked at the data.
Our conclusion: the apparently progressive tax system of the post-war period was an illusion, with myriad ways for those on high incomes to pay little or no tax. Nobody, whatever their view of taxing the rich, should want to go back to that.
The people who think we should go back to the 1970s
Here’s campaigner Gary Stevenson:
Stevenson is asked if he can point to a period in British history where “massively taxing rich people” has benefited the country. His reply is that his father, born in 1957, earned an average wage but was able to buy a house and become financially secure. He says this is because he lived in an era – the 1950s, 1960s and 1970s, where the top rate of tax was significantly higher. Stevenson claims that it’s not a coincidence that, in that period, ordinary people could afford to buy houses.
Stevenson is assuming that, because the top rate of tax was higher in the 1950s, 60s and 70s, the rich paid more tax in those decades.
He’s wrong.1
Did the wealthy pay more tax in the 1970s?
People associate the 1970s with high rates, and they’re correct. UK tax rates reached their peak in 1975, when the top rate of income tax on “earned” income was 83%, and the top rate on “unearned” income (e.g. investment income) was 98%. 2 This was much higher than the rates in other comparable countries.
These rates didn’t just apply to oligarchs. The 83% rate applied to incomes over £24,000; in today’s money, around £120,000. So we’re talking about incomes that were high, but not exceptionally high. To put it in context, £24,000 was about five times average 1979 earnings, and twice the salary of a headmaster.3
After the 1970s, the rate fell precipitously:45
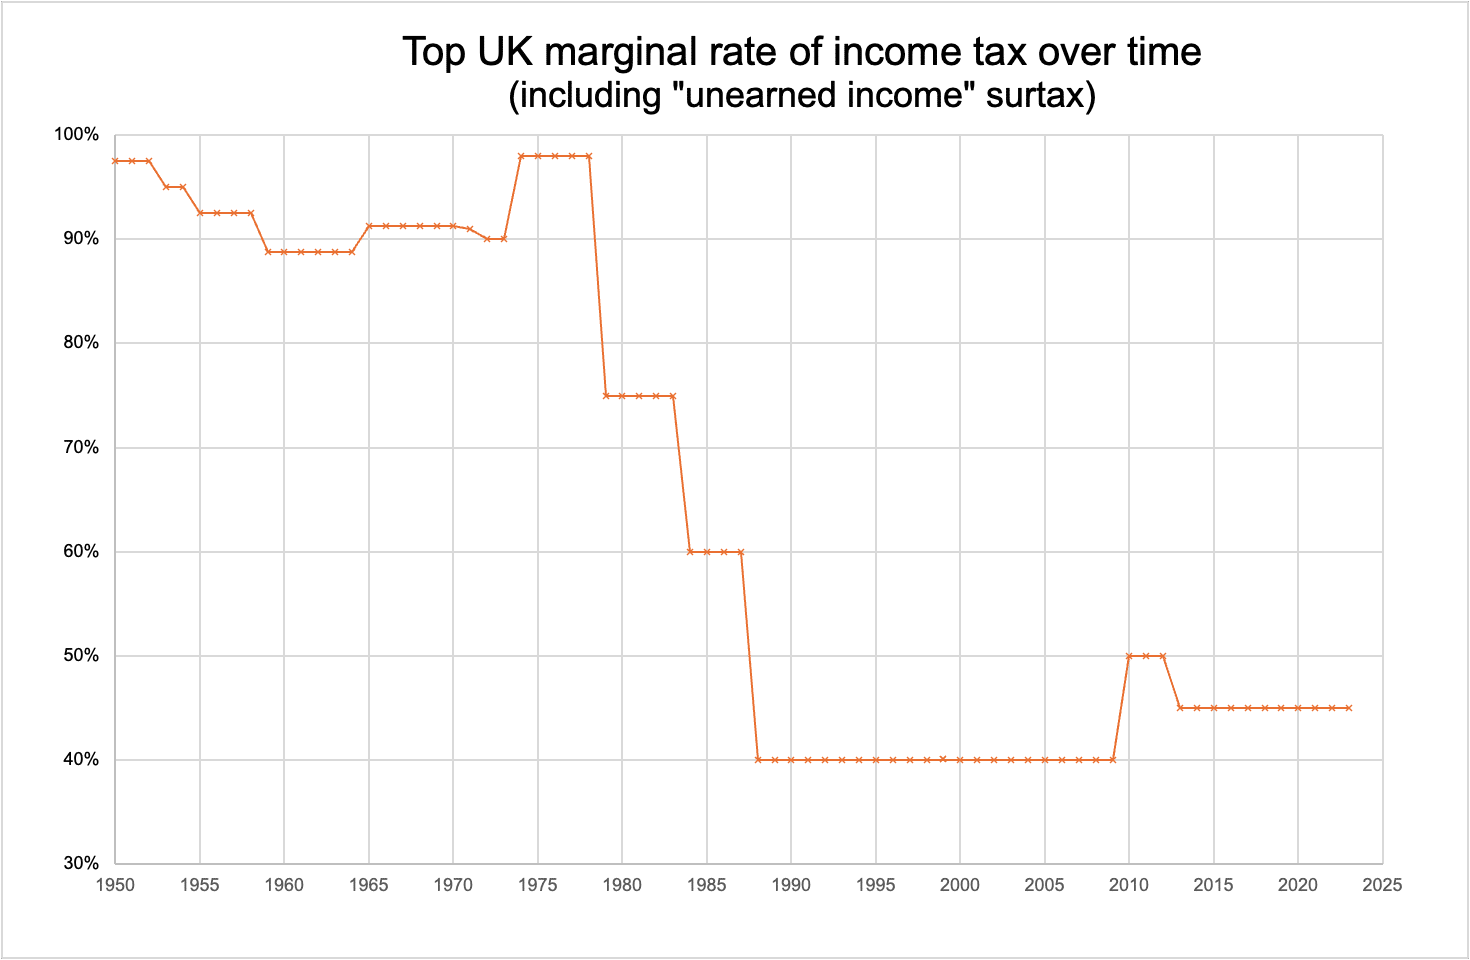
Today, the top rate of income tax on most income is 45%6 and 48% in Scotland.7
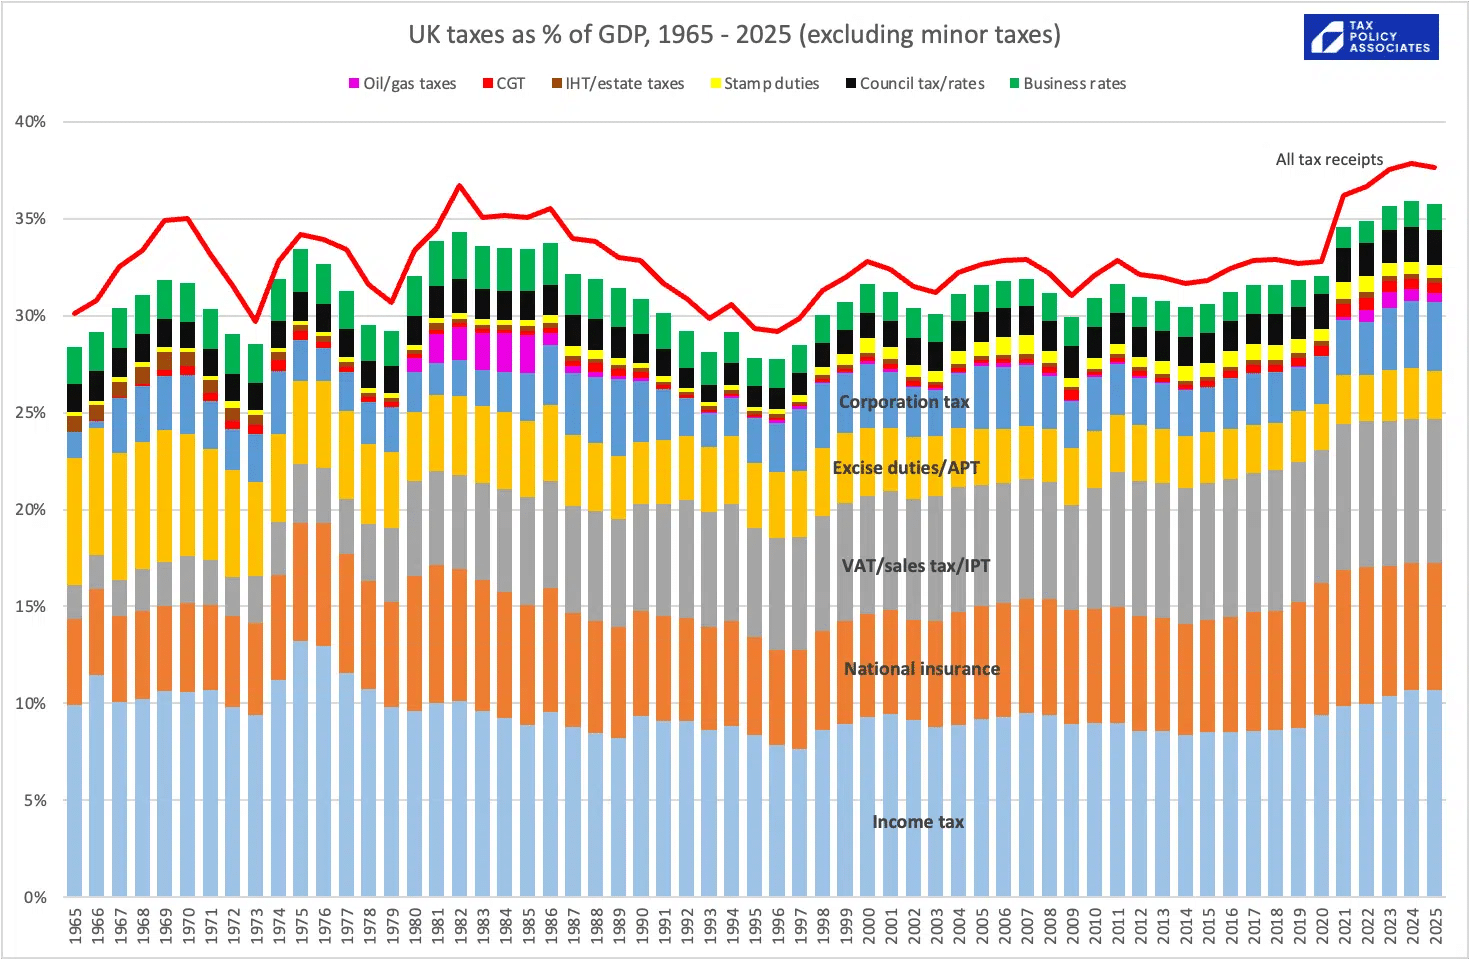
So all of this suggests there must have been a lot more income tax paid in the 1970s than today. But there wasn’t.8 Income tax raised about the same in the 1970s (as a percentage of GDP) as it does today:9
Perhaps this is because most people paid less income tax in the 1970s than today, but high earners paid a lot more?
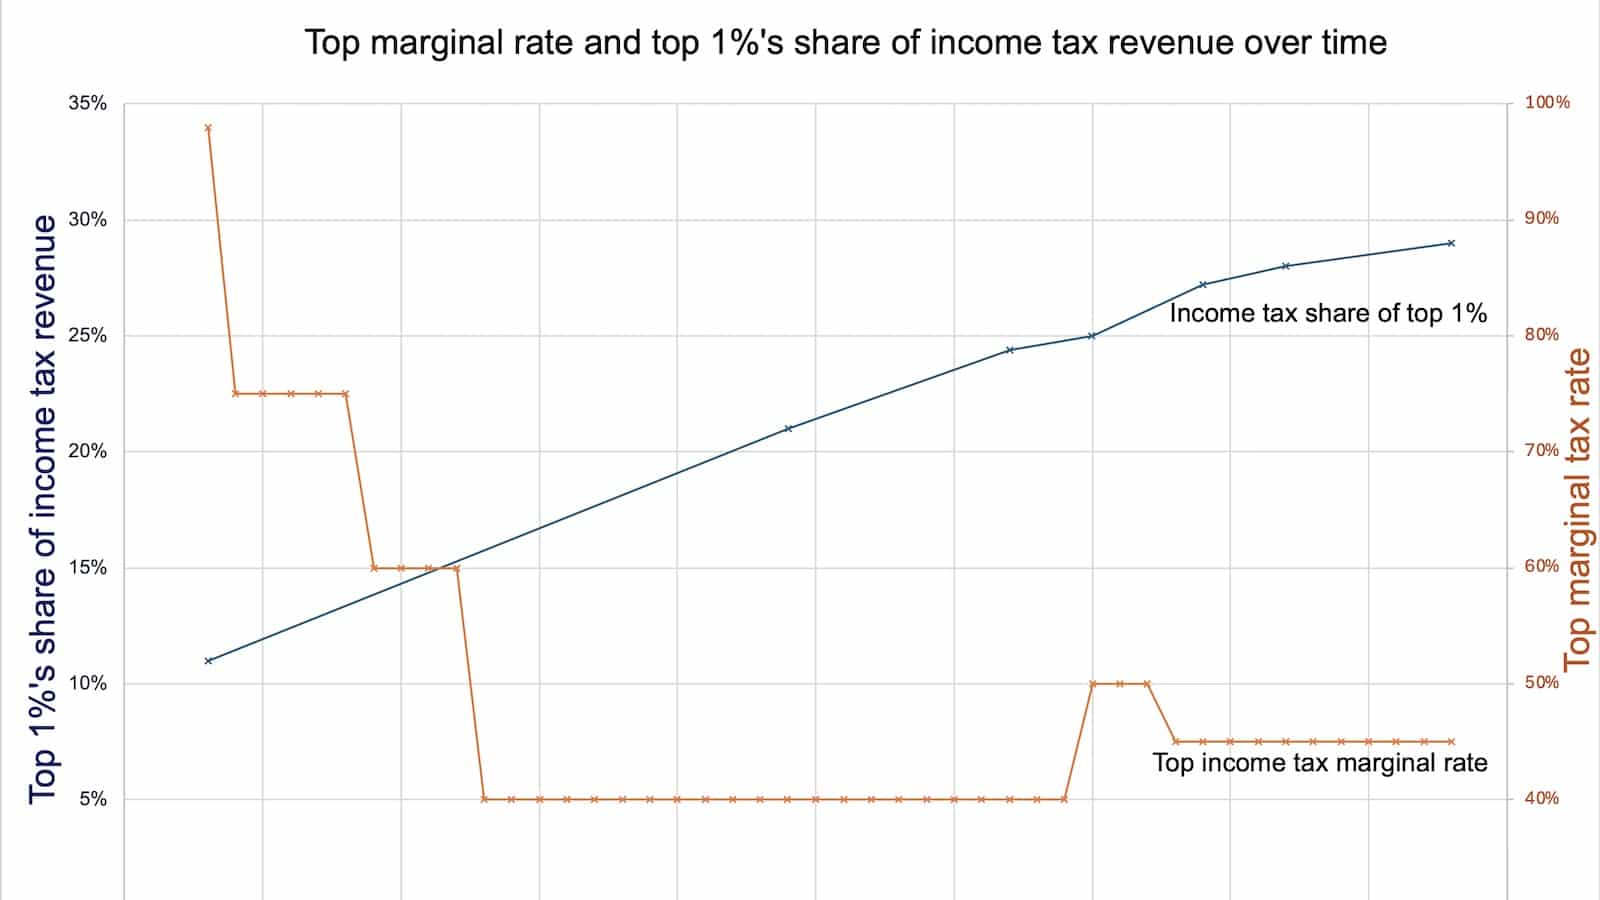
The opposite is the case. In 1978/79, top 1% paid 11% of all income tax. In 2024/25, the top 1% will pay about 29% of all income tax. The trend is extraordinary:10
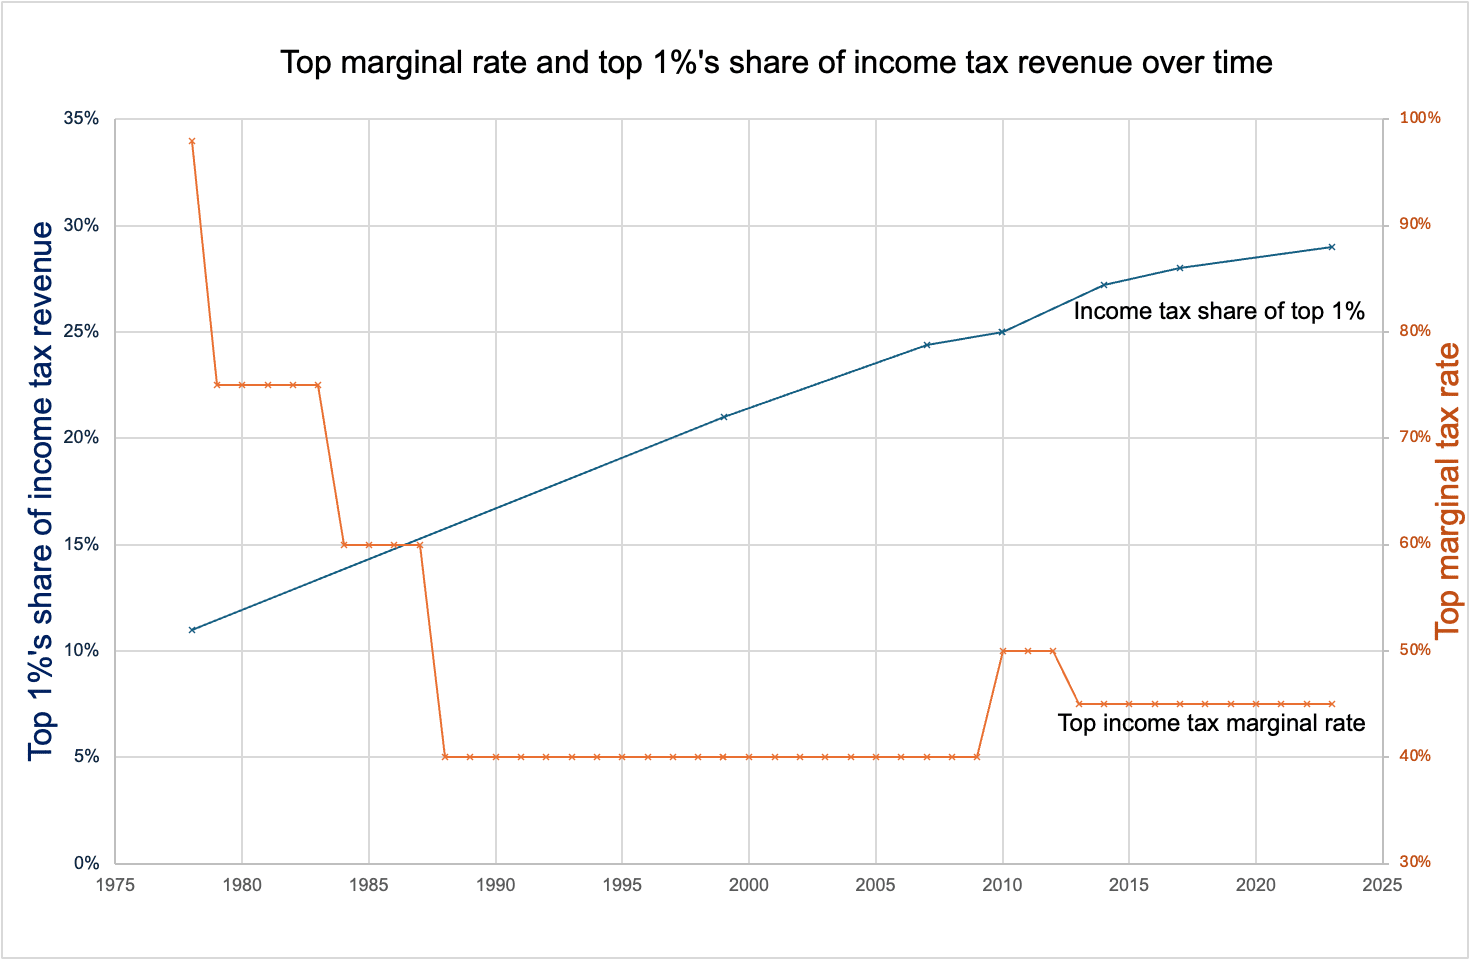
How can that be, when the rate of tax paid by the top 1% is less than half of what it was?
There are three explanations.
The first is simply that the top 1% earn more (as a percentage of national income) than in the 1970s.
The World Inequality Database contains estimates of the top 1% income share over time, and is compiled by an international consortium of academics. Here’s what happens if we add this data to the previous chart showing the top 1%’s share of income tax revenue:11
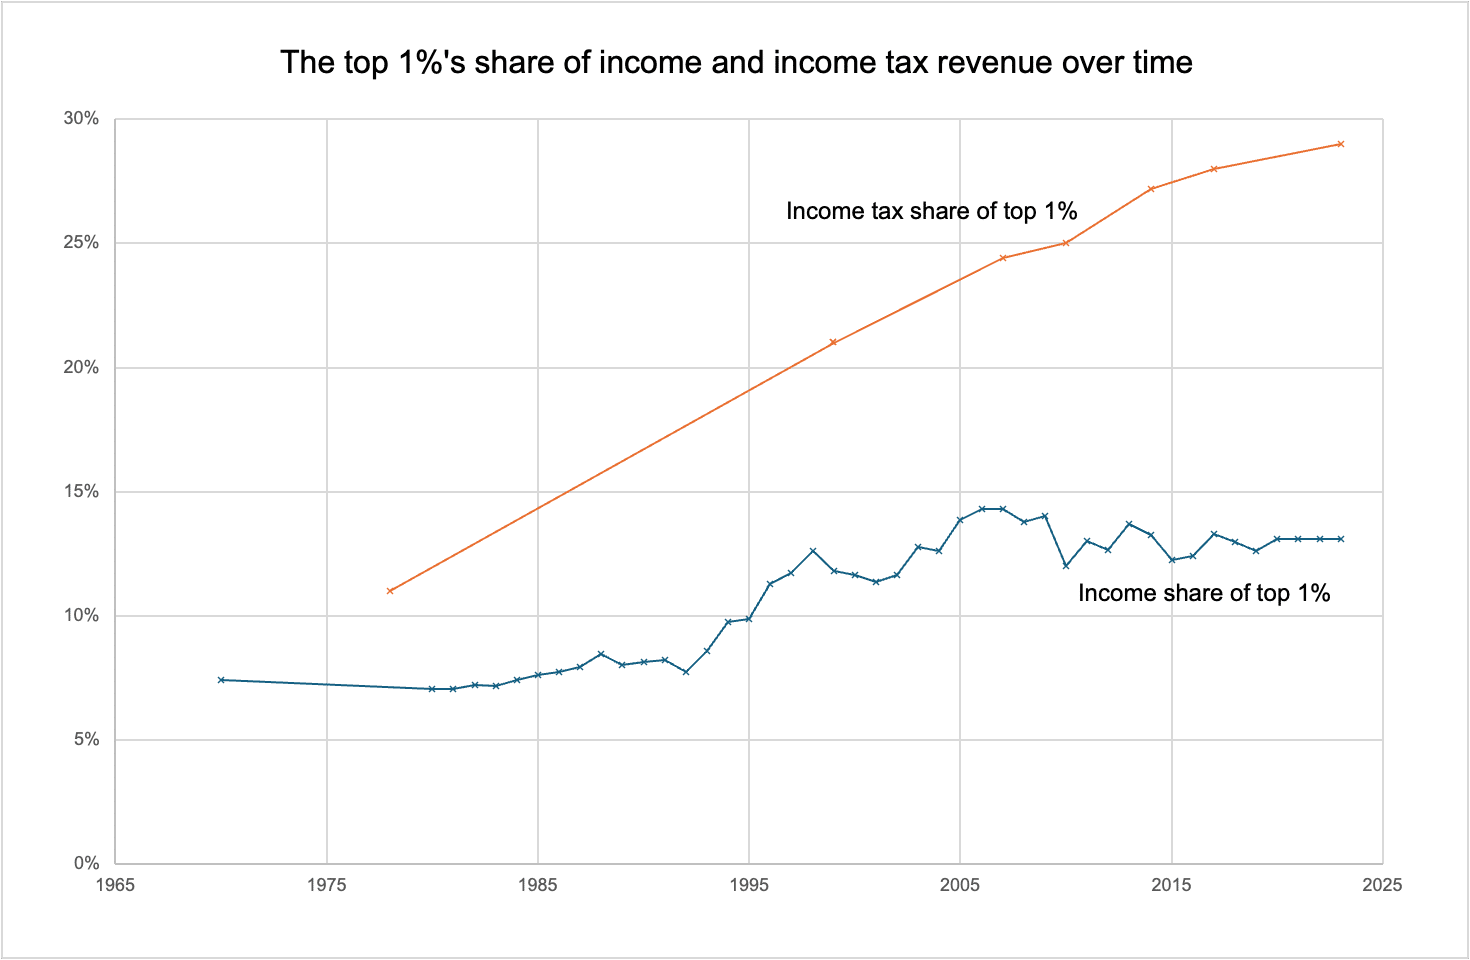
It’s reasonably clear from this that a rise in income share is an incomplete explanation.121314 Over a period when, to stress the point, the rate of tax paid by highest earners has fallen by half.15
The second is that about a third of the increase in the tax paid by the top 1% is recent, and was caused by a series of tax changes since the financial crisis that increased the tax burden on the 1%. Or, to be more precise, those in the lower levels of the 1% (i.e. incomes less than around £200,000). These include the introduction and freezing of the additional rate band and the clawback of the personal allowance.
The third, and least discussed, is that the high rates of the 1970s are illusory – they don’t reflect the tax that the 1% were actually paying. The reasons why are interesting.
The illusion of high rates
There is a difference between the “statutory” (or “headline”) rate of a tax and its “effective” rate.
The statutory rate is what the legislation says – so, today, that’s a top income tax rate of 45%16
But all taxes result from a calculation involving two numbers – the rate is multiplied by another number – the “base“. For income tax the base is the taxable income. And the base has changed dramatically since the 1970s. It’s become much wider, which means that 45% of the tax base today is a much larger number than 98% of the 1970s tax base.17
The short version is that, in the 1970s, tax law was much simpler – there was less tax legislation, and fewer statutory anti-avoidance rules. The courts also had a generally forgiving attitude to tax avoidance. This was well-known at the time – as early as the 1950s, commentators were describing UK tax policy as “the path charging more and more on less and less”.18
To discover the longer version, I’ve spoken to a variety of retired HMRC officials, tax advisers and businesspeople who either used or tried to stop the tax tricks of the 1970s. Here’s what they say:
- A pop star suddenly making huge sums isn’t in a position to control their income. A senior executive, or the owner of a private company, is. So, if a bonus would be taxed at 83%, or a dividend at 99%, the first step is: don’t take a bonus or dividend. Do something else. There were many something elses.
- Simplest and most effective: benefits in kind were undertaxed or completely untaxed. Today, any benefit an employee receives from their employer is taxable as a “benefit in kind”. Until 1970, benefits were mostly untaxed. After the Income and Corporation Taxes Act 1970, benefits were taxable – but only where they could be directly converted into cash. Later they became taxable on a more general basis, but assessed at the cost to the employer, not the value to the employee – a rule which was easily abused.19 So high earning salaried employees (say executives) would avoid tax by taking much of their remuneration in the form of extensive “perks” or “fringe benefits” from their employer instead of cash salaries. Cars, housing, travel, holidays, club memberships, dining out, the “luncheon voucher“… all enabled a very high standard of living to be obtained tax-free.20 And all of this was tax-deductible for the employer. These perks assumed a much greater importance in the 1970s than before or since, and across all income levels, but became particularly significant for high earners. Tax was not the only motivation: perks were a way of side-stepping statutory pay controls. The consequence was that perks replaced a significant proportion of high earners’ salaries and bonuses (troubling some researchers at the time).21
- Until 1976, companies could lend large sums to their executives and charge zero interest. Rules were enacted in 1976 charging the benefit of no/low interest rate loans to income tax, but they were widely avoided.
- Perks and interest-free loans enabled tax-free remuneration of executives during the time they were employed. Once they retired, generous pension rules would enable very large lump sums to be paid to executives tax-free.22
- All interest was fully tax-deductible until 1974. The rules then changed so that only interest on business loans and home mortgage loans was deductible, with mortgage interest capped at £25,000 (£125,000 in today’s money). But that was still pretty generous. And for someone paying tax at a marginal rate of 98%, their interest would be almost entirely paid for by reduced tax liability. A common response to receiving a pay rise (by middle class professionals, never mind the 1%) was to take out a larger mortgage. What’s now called the “buy, borrow, die” strategy was highly effective – at the time it was often called “living in debt”.23
- People born abroad but living in the UK (“non-doms”) could live in the UK for decades but pay no tax on their foreign earnings; until 1974 there were loopholes which meant they could easily pay no tax on their UK earnings either.24 And, until as late as 2017, people who had lived in the UK all their life, not even born abroad, could sometimes claim to be non-doms.
- Before the introduction of Capital Transfer Tax in 1974/75, lifetime gifts into trusts weren’t taxed. Distributions to trust beneficiaries in principle were taxable, but easy to avoid, and the Inland Revenue had difficulty tracking such distributions.
- Someone about to make a large capital gain (say by selling their company) could leave the UK and become a tax exile, take the capital gain tax free, and then return to the UK the very next tax year (or, with the right timing, nine months later). The same trick would work for someone expecting a large stream of income, such as royalties – there’s a reason why so many musicians became “tax exiles” in the 1970s. This continued to be a highly effective strategy until the “temporary non-resident” rules were introduced in 199825 – tax exiles today need to be willing to leave the UK for five years, which many are not.
- The increase of tax rates and closing of loopholes in 1974/75 resulted in an boom in tax avoidance schemes, which neither the tax legislation of the time or the doctrines applied by the courts26 were able to counter. The schemes would often convert incomes (taxed at 98%) into capital gains (taxed at 30%)27, magic large tax losses into existence to eliminate tax entirely28, or use “whole-life” insurance policies or other structures to shelter assets from tax. An entire industry arose to sell such schemes and, unlike today, these schemes worked.29
- All of the above were perfectly legal strategies, but another option was to simply break the law and evade tax. The rise of tax havens in the 1970s, most of which guaranteed absolute secrecy, meant that those with cash outside the UK could stash it untaxed into an offshore account, with very little prospect of ever being caught. That isn’t at all the case today.
It is, therefore, a fundamental error to simply compare the statutory tax rates of the 1970s with the statutory tax rates of today – it ignores the reality of how much tax is actually paid.30
What about the 1950s and 1960s?
The 1970s are often described as the highest tax decade, but that’s not quite right – income tax rates in the 1940s and 1960s briefly went over 100%. However the rate of capital gains tax in those years was zero – because there was no UK capital gains tax.
It was, therefore, standard practice for the very wealthy to (without too much effort) convert their income (taxed at very high rates indeed) into capital gains (completely untaxed). An episode of Untaxing discusses the Beatles’ successful use of this strategy, and how the same tricks don’t work today. For a much more detailed exploration of the strategies adopted in the 1950s and early 1960s, I highly recommend the 1962 edition of Titmuss, Income Distribution and Social Change.
So, whilst it’s harder to find information on the tax and income share of the 1% in the 1940s, 50s and 60s, I would be reasonably confident that the 1% paid less tax then than in the 1970s – and much less than today.
Why does it matter?
It matters because the tax policies of the 1970s were a failure. They failed to tax the rich effectively. They failed to fix the Government’s fiscal problems – overall tax as a percentage of GDP was higher in the 60s and the 80s than it was in the 1970s.
The lesson of the decades since the 1970s is that the best way to tax the wealthy is by expanding the base and closing loopholes. That makes a less snappy soundbite than sending rates sky-high, but the evidence and the history shows that it’s fairer and much more effective.
Many thanks to all the veterans of the 1970s tax wars who spoke to me, and to T for help with the economic evidence.
The charts and data used to compile them are available in this spreadsheet.
Footnotes
Stevenson is also likely wrong about the link between tax rates/inequality and house prices. To a significant degree, he has it the wrong way round. The cost of housing is a significant driver of inequality, in terms of both income and wealth. The evidence suggests that a number of factors combined to drive up house prices: an increase in demand (more one and two person households), restrictions on supply (planning and lack of space) and (most importantly) a long period of historically low interest rates. The impact of inequality seems much less significant, and the direction of that impact is contested. There is some evidence that absolute (but not relative) inequality somewhat increases house prices. Others have reached the opposite conclusion, particularly over the long term. Possibly the effect is being confounded by credit availability, which impacts both inequality and the housing market at the same time, but in any event the effect is much smaller than the other factors I mentioned above. ↩︎
83% income tax plus 15% investment income surcharge. There’s a common belief that Dennis Healy would have raised the top rate of income tax further, but the effective on investment income would then have been over 100%. ↩︎
Average earning figures are here. I’ve used the figure for average male earnings; average female earnings were 40% lower, but significantly fewer women were in the workplace than today. ↩︎
There’s a table showing how the highest rate fell over time here and another here showing the different bands at the time. Note that there was more movement in the top rate than shown in the chart because, until 1974, there was both income tax and surtax on all income. From 1973 there was instead a higher rate of income tax and a 15% surtax on unearned/investment income – the net effect was that the top marginal rate of tax on employment income fell from 91.25% to 75%, but investment income was taxed at 90%. ↩︎
Rates have also fallen for those on median incomes. The statutory effective rate of national insurance and income tax for someone on median income has almost halved since the 1970s. The effective rate for someone on half of median income is one quarter of what it was in the 1970s. See figures 16 and 17 in this Resolution Foundation paper. There will have been some impact of “perks” and tax relief (particularly mortgage interest relief) to bring down the 1970s effective rate for median and low paid workers, but the use of more structured avoidance tools was of course much less common for workers in these categories than for high earners. ↩︎
For dividends the rate is 39.35%, reflecting the fact that the company profits (from which the dividend was paid) were themselves subject to corporation tax. In the 1970s there was instead a credit: direct comparison between the current dividend rate and the old tax credit regime is not straightforward but in broad terms the credit system was (for UK dividends) somewhat more generous than the current rules. Given the complications I’ll focus on the main rate in this article. ↩︎
In this article I’m leaving out national insurance; realistically it means the highest marginal rate of tax on employment income is 47% (or 50% in Scotland). In the 1970s there was no employee national insurance past the upper earnings limit. Employer national insurance was 10%, rather than 13.8% in recent times, and 15% now. So national insurance to a small extent defies the overall trend. ↩︎
That’s despite the bump in the latter half of the 1970s, when very high inflation meant fiscal drag had an even greater effect than it has had in recent years. ↩︎
The source for this chart, and other related data, is set out in my previous article on the shape of the UK tax system. There’s another chart on page 6 of this IFS paper covering 1948-1999, which also shows remarkably little change in the total raised by income tax and wealth taxes. ↩︎
Unfortunately I wasn’t able to find any data on the income tax share of the top 1% before 1978. It is in principle possible that it was higher in earlier years/decades, but nobody I’ve spoken to thinks this is plausible. When top tax rates are above 90%, very few people will take their income above that level. ↩︎
Precisely what the correct percentage is and was is highly contested. The IFS has published a very helpful chart (page 14) showing the most well-known estimates, but all have one thing in common: the increase in the income tax paid by of the top 1% outstrips their increased income share (even if we ignore the fact that the rate of tax is dramatically lower). ↩︎
It’s important to note that estimates of income share subject to considerable uncertainties and limitations. One under-discussed element, very relevant to this article, is that the very strategies used by the wealthy to avoid tax took their income out of tax returns and national accounts. The 1% income share estimates for the 1970s, both ONS data and Piketty’s figures, may therefore be significant under-estimates. It was suggested in the 1960s that, for this reason, the apparent decline in the top income shares in the post-war period could be an illusion. There is little evidence for that as an overall proposition, but research into hidden dynastic wealth has found that one third of the apparent fall in the top 10%’s income share may in fact reflect hidden wealth. Piketty falls into the trap of assuming that high apparent tax rates translate into high effective rates, not appreciating that his sources are based on national account statistics which don’t include many common forms of avoidance (see e.g. Bachas page 10, bottom of first paragraph, cited by Piketty on page 584 here). ↩︎
We also need to be careful when using “income” as a proxy for “rich” or “poor”. For example, it’s often said that the very poor pay a higher percentage of their income in tax than the very rich. That’s incorrect – when we drill down into the data we see that this effect is driven by the lowest-earning 1%, who pay 265% of their income in tax. How can anyone be in such a position? Because these people aren’t “poor” at all – they’re some combination of: students, the temporarily unemployed living off savings, and retirees living off savings (plus, possibly, errors in the data). ↩︎
Another point to watch is that a significant number of the 1% come to the UK from abroad, and that fraction has doubled since the 1970s. ↩︎
The explanation for the increase in the income share of the top 1% is well outside my expertise. It’s common to see a simple assertion that the rise in inequality was caused by the drop in tax rates – these claims typically don’t look past statutory tax rates and are therefore hard to take very seriously. There are more sophisticated analyses such as Hope and Lindberg which attempt to include changes in the tax base as well as rates – although (perhaps because of the international nature of the study) the authors don’t appear to realise quite how many tax avoidance strategies there were in the UK. Their approach to estimating effective tax rates (national accounts) should properly take income-to-capital schemes into account, but won’t capture tax avoidance strategies like under-valued perks, circular transactions, loss generation etc. It is therefore likely that Hope and Lindberg over-estimate the effective tax rates of the 1970s, when such arrangements were endemic. And of course there are those who say this was a “Laffer” effect where it was the drop in tax rates that incentivised additional labour supply, increasing incomes. However the evidence suggests that, whilst such effects are very real when tax rates are at high levels, the effect is mostly shifting of income to a taxable form, rather than an increase in actual labour supply). All in all, I find the non-tax explanations to be more persuasive, particularly globalisation, technological change, and the decline of unions. ↩︎
48% in Scotland. ↩︎
The tax base today is much wider/better than in the 1970s, but certainly very flawed. The evidence shows that only one in four of those earning £1m in 2015/16 pays a rate close to the 47% we’d expect (tax plus NI); the average rate of tax paid by that cohort was just 35%. That isn’t down to anything very clever, but simply because capital gains in 2015/16 were taxed at rates as low as 10%. ↩︎
Kaldor, An Expenditure Tax, reviewed here. ↩︎
For example, an employer already owns a mansion. It lets the executive live in the mansion. The employer says it only bears the running costs, and so the cost of the mansion itself isn’t a taxable benefit. Or even further; that it would bear the running costs even if the mansion was empty, so there is no cost to it of letting the executive live in the mansion – and there’s no taxable benefit at all. This kind of planning was commonplace for senior executives. ↩︎
There was also widespread abuse of “expense accounts”, which executives would use for items which realistically should have been taxable benefits, but which the Inland Revenue had great difficulty tracking. ↩︎
As I note above, this means that the cash income and taxable income of executives in the 1970s is not necessarily a good guide to their actual economic resources; the estimate of the 1%’s income share are likely under-estimates. It also means that significant sums of what was realistically remuneration are missing from the national accounts statistics relied on by Piketty and others to estimate effective tax rates – they therefore over-estimate those rates. ↩︎
Until 1960 it was even easier, as compensation for loss of office was entirely tax-free. This wasn’t just used for “golden goodbyes”; directors were often hired on short term contracts and, when each contract expired, a tax-free compensation payment was made and the director was immediately rehired. It was a “cloak for additional remuneration“. ↩︎
See Titmuss, Income Distribution and Social Change, page 134. ↩︎
There’s a fascinating exposeé here of how one of those non-doms, Stanley Kubrick, lobbied to maintain those loopholes. ↩︎
The original draft of this article said 1988. That was a bad typo – my apologies, and thanks to the commentators who pointed this out. ↩︎
At least until the WT Ramsay case in 1982. ↩︎
There’s a good explanation of how “bond-washing” and other income-to-capital schemes worked here. The schemes were more popular before 1965, when there was (broadly speaking) no capital gains tax at all. The incentive to use the schemes diminished subsequently, and further as anti-avoidance schemes were introduced – but they continued through to the equalisation of rates in 1988, and indeed still exist in some forms today. ↩︎
As noted above, such schemes have the incidental effect of eliminating income from the national accounts (because the real income is offset by the artificial losses); these schemes therefore aren’t picked up in the estimates of effective tax rates relied upon by Piketty and others. ↩︎
For anyone interested in the most notorious of the scheme promoters, Rossminster, I highly recommend The History of Tax Avoidance by Nigel Tutt (or its predecessor, Tax Raiders). Out of print now, but second hand copies are often available online, and it’s widely available in libraries. ↩︎
Nevertheless this is a mistake made by eminent economics. The late Tony Atkinson was an eminent scholar of inequality, but he presented a chart of raw changes in headlines rates in Inequality: What Can be Done (Figure 7.1 at the start of Chapter 7), and used this to calculate the “marginal retention rate”. This seems a bad error. ↩︎
51 responses to “Why the rich paid less tax in the 1970s – despite 98% tax rates”
Excellent article. Normal working to middle class people in Ireland still file income tax returns, if they have (or ever had) additional income outside their employment. Rental income on a second property for example. Claims for rebates on certain medical expenses are made via the same return.
Might be helpful to split the analysis: for most of the period (the pre 2007 numbers), the disparity does appear to be well explained by income distribution (tax goes from 11%-22% as income goes from 7% to 14% [eyeballing the numbers]). After 2009 I wonder if the much vaunted “flattening of the middle class” would explain the rest. Example: In a progressive system the tax share of the top payer in this distribution could be higher in case 2, with exactly the same share of the income?
Case 1 200, 150, 100, 50
Case 2 200, 110, 110, 80
This would imply the focus might need to be on what happened to the rest of the previous higher payers post 2008- the marzipan layer?
that doesn’t really make sense, because the tax rate went down so significantly 1974 – 2007. So (all things being equal) an increase in the income share of the top 1% would result in a truly massive increase in tax paid by the top 1%. We don’t see that. The reason is that all things aren’t equal, for the reasons in the article.
Not sure I understand your response.
If the top rate comes closer to the middle and lower rates why would an increase in earning at that top tier be disproportionately taxed?
As I said from 1979-2007 as the top 1% earned more they ONLY paid proportionately more tax (twice the income share, twice the tax share)- in a progressive system as they earned more they should have paid disproportionately more shouldn’t they (i.e. growth in tax share >growth in earnings share)
You’re forgetting the tax rate. It fell from 85% (or 98%) to 40% – so it more than halved. The income share of the top 1% went up by a bit less than twice. So all things being equal, the income tax share of the top 1% should have *fallen*.
Instead it went up almost three times.
The only logical conclusion is that the effective tax rate on the top 1% has gone up since the 1970s. The data seems clear. The technical reasons are compelling. The anecdotes are plentiful. Unless I’m missing something, isn’t that a slam dunk?
My first job in the 1970s was with the Inland Revenue in London. I dealt with some very wealthy people but mainly sent them large tax refunds due to their investments in woodlands and Lloyds underwriting. The 98% top rate was largely an illusion
The evidence shows that people will stomach rates of up to 49% but once they go above that the tax take falls.
As for wealth taxes, I think the government might get away with a one off tax, but at a huge loss of goodwill from those subject to it.
Very interesting and helpful article. Regarding the comments on VAT or in Australia GST. Yes by and large studies of the distributional effects show its regressive. However one has to look at the total package. With VAT or GST the rich pay when they buy stuff. A package with a higher VAT can reduce tax paid by low income earners as well as social security changes and collect a larger share of tax from high income earners even before you get into estate and wealth taxes
A point of detail re Note 2 the 15% on investment income was called the investment income surcharge.
thank you so much – fixed!
Just noticed a small typo. Temporary Non Residence rules were introduced in 1998 not 1988.
thank you. Fixed!
This has clearly generated a huge discussion from several points of view. Since Pitt who introduced it most people despise paying tax, the problem is many do not have the luxury of doing anything else and this is not really to my mind a transactional discussion as per the philosophical point made by Priestly in An Inspector Calls. Yes, I am a layperson but my question then is how is it that some are made to pay tax and others are not. Whatever the rates?
Talk about missing the point that Gary Stevenson was making. The point he was making was not that the tax policy of the 50s,60s, and 70s meant the rich paid a bigger share of the income tax in aggregate, or that the income tax brought in was a higher percentage of the GDP. The point Gary was making was that inequality (wealth and income, but especially wealth) was much lower back then and has been growing ever since.
The data in the article proves Gary’s point. Not only is income tax brought it less now, but more taxes are VAT (sales taxes) which are regressive. In other words, the poorer people in society are taking on a bigger share of taxes. They are transferring them from a progressive tax system (income and wealth taxes) to a regressive one (sales taxes and VAT).
Talk about missing the whole point of Gary Stevenson’s argument. The point was that inequality was less back then and the tax system was one reason why. Now inequality is high and keeps getting higher. So yes, we want to go back to the tax system of the 50s, 60s, and 70s not because of getting extra taxes, but because it slows down and may reverse the rise in inequality.
He was asked when high tax had vbeen a success. He said the 70s. He’s wrong.
The claim that the tax system is more regressive now needs evidence. You can’t just point to VAT, as that has complex distributional consequences which are rather more nuanced than “it’s regressive”.
The ONS publishes reports on the effects of taxes and benefits on household income, and the fact that the poor spend more on VAT in terms of the % of their income means VAT is regressive. A greater reliance on VAT now compared to the 1970s (and a smaller share of income tax, as the blue line jumps up and then goes back down) reflects the argument that the tax system as a whole is less progressive now.
The idea of a tax-avoidance industry that reacted to those tax rates is a good argument against the system ‘working’, but the government response should be to address the tax avoidance, not drop the tax rates in response.
When one says “the rich paid less tax”, the useful meaning of that would be to mean ‘as a share of their income/increased wealth’, not as in ‘net revenues’ because as economic activity grows, the latter point is obviously true. As the point made earlier, the discussion on tax for high income earners is about inequality and the redistrbutive nature of the fiscal mechanism, and the indirect idea that the explosion of inequality is a driver of double income households today being able to afford less ‘staples’ (vehicles, leisure but mainly housing) than the generation 50 years their senior.
A few things here seem incorrect.
First, see the footnote above – the very low income % paying a high amount of VAT are not “poor”.
Second, it’s important to read VAT revenues together with duties revenues. There was a big move from duties towards harmonised VAT when we entered the EEC, but both were indirect taxes with similar distributive effects. The total duties plus VAT was about 9% of GDP in the early 70s; it’s about 11% now.
Third, see footnote re. the proposition that inequality is responsible for the housing crisis. Doesn’t seem well evidenced. The proposition that middle income households are less able to afford leisure and vehicles today also feels very questionable
I don’t understand your point about “the rich paid less tax”. If the data shows that the % tax paid by the rich (as a % of GDP) has increased faster than the share of income of the rich (as a % of GDP) then that seems to be that.
These rates (and those on corporate income) bred the serious tax avoidance industry in the 60’s and 70’s (Empson & Dudley, Bradman & etc) with smooth tongued presenters selling schemes which probably worked and created a pile of avoidance legislation, which ironically through poor drafting and unintended consequences, generated more avoidance opportunities. All substantially curtailed by the House of Lords in the Ramsay case.
YOu mention in point 17 that the tax base now but offer no evidence to support this – where can I find this please?
An alternative interpretation of some of the data is that if the richest 1% are paying a much higher percentage of teh overall tax take but the overall tax take as a percentage of GDP is the same is one conclusion that some people are paying less tax or there are a much larger number of people who are economically inactive. Have you done an anlysis of what tax is being paid in the lower brackets over time along with the number who are economically inactive?
The whole article is evidence that the tax base is wider now. If the tax base hadn’t changed then halving the top rate of tax would have halved the tax paid. Obviously that didn’t happen.
With 100% first year allowances available those with income liable at 98% would create “trading businesses” by investing in amongst other things shipping containers. The losses created would be available to set against investment income and profits would be taxable at the lower 83% rate
thanks – I’d love to see documents on that sort of thing, if anyone has them…
I do not have documentation but I think Kevin is right. As I saw it (I was working as a tax accountant from 1978 to 1983) the growth of the leasing industry was driven by a number of factors:
1) manufacturing industry had low profits (or even losses) because of the general state of the economy. Hence that sector could not absorb the capital allowances available
2) capital allowances/tax depreciation rules were made more generous; the authorities recognized that in times of high inflation profits computed using historical cost accounting significantly overstated the taxable capacity of businesses dependent on physical capital
3) banks became very profitable because inflation, and hence interest, rates were high but in that era higher interest rates were not fully passed on to savers.
The resulting growth in leasing enabled the manufacturing sector to ‘sell’ its surplus capital allowances to those that could use them. The purchasers (lessors) were primarily banks, but also high income individuals. This process was material in the UK, and to al lesser extent in the US.
many thanks. I’d love to understand the impact of that on the national accounts – the scale of leasing transactions was so large that I wonder if it distorted manufacturing/banking sector profits as well as masking the income of the wealthy.
I think what you also saw on the leasing front was business with large upfront capital outlays to create large infrastructure assets – either physical or intangible would use leasing as a way of managing cash flow because as you say they could neither absorb the capital allowances from a cash flow perspective or recognise the deferred tax assets from an accounting EPS perspective.
I’ve just cut and pasted some numbers on the number of houses built in the UK compared with population. Recognising that statistics can be prove whatever someone wants, I looked at (i) the total of dwellings completed per decade, and (ii) the increase in the UK population per decade. These are arbitrary things and not directly related (e.g. a new baby does not need a house, there may be a big shortage of houses to start with) but I think it does show that there might be an issue not related to the highest marginal rate of tax:
1950s: 1.75 new houses per decade per additional person
1960s: 1.03
1970s: 4.03
1980s: 2.60
1990s: 1.18
2000s: 0.53
2010s: 0.38
thanks – yes, the idea there’s a link between tax rates and housing is a bit weird to me (obviously there’s a correlation, but there’s also a correlation between the popularity of house music and UK house prices)
It’s not just that it was easier to (legally) avoid tax in the 1960s and 70s – but also there was little point in being a high earner if virtually all of your earnings would be taken in taxes. There was no incentive to earn more than the threshold for the topmost tax rates. If your taxable
Income was projected to exceed these thresholds, you just slowed down your work (at least if you were self-employed) – you took long lunches, left work promptly at 5pm, and disappeared off on holiday.
So not only was less tax collected through tax avoidance, but less tax was collected because there wasn’t the high income to be taxed.
Didn’t stop the Beatles recording two albums a year, making films and touring the world though! 😉
Taxman is a fantastic song!
I vaguely remember that there was a period in the late 60s when marginal tax rates exceeded 100% because of some sort of surcharge. Am I misremembering?
there were a couple of points like that – it’s in the footnotes!
Isn’t it also the case that the less affluent were paying “more tax” as the basic rate of tax was 30% until the mid-80s (and 33% or 35% at some points)? It fell to 25% by 1988/89. There was also a trend of increasing personal allowances to take low earners out of tax, though Gordon Brown at the same time brought more into higher rate tax. The base would not have increased as much for lower earners as they were not in receipt of benefits in kind to the same extent.
There were also fewer women in the work force – a husband’s salary was more adequate to support a family. Today it could well be earned by both partners together and taxed less.
Also, the expressions paying “more tax” and “less tax” are very context dependent.
Interesting research and I think it highlights the challenge with taxing the “rich”. This will be conflated with the top 1% who in relative terms are rich. But given the extraordinary increase in tax burden I think this is where the problems start to arise. If you take say 200k earnings as the top 1% in the UK, and assume this is concentrated in the South East, if you tax this and deduct living costs including mortgage costs, the top 1% or rich end up with a few thousand pounds of disposable income per month. This may sound a lot if you are struggling but bear in mind this is the top 1% of earners. Now Labour will want to further tax the rich. Wealth taxes do not work as you have written previously and the data supports that, but there seems to be a groundswell of opinion that the wealth tax could come through higher council tax. Again this would disproportionately hit the South East and be levied essentially on assets that are illiquid, so the few thousand pounds I talked about above is reducing even further. Add into this inflation and the pressure on pay rises due to the national insurance increase and the picture looks very grim for those who are meant to be at the top of society… ultimately this country cannot tax itself to prosperity but it seems that this seems to be a lost narrative.
Higher property taxes (think most of USA) mean that people are generally quicker to sell properties that are large/in expensive areas when they can no longer afford the ongoing costs.
I suggest that leads to more effective distribution of resources (not quite the same as of wealth)
It is the opposite of the 1980s Tory drive to cut Rates which seemed largely driven by a desire for pensioners to be able to afford to stay in the family house so that their children can come back for Christmas etc.
I think the US property market operates differently to the UK market with far less frictional taxes such as a high stamp duty burden. Essentially what you are saying is that older people who are cash poor but property rich should sell their houses in say the south east and move somewhere cheaper, incurring significant cost along the way just to lower their council/wealth tax?
I’m curious to know what the result is when you add National Insurance into the analysis? A lot of income for the wealthier isn’t subject to NI.
there’s more national insurance now than then (in the 70s employer national insurance was lower and there was no employee national insurance over the upper earnings limit), so it doesn’t change the overall picture. But it makes the picture very different for low-to-median earners, who’ve seen income tax fall but national insurance rise. I’ll write about that soon.
Very interesting piece. I’d love to see a similar treatment of corporation tax and how that has evolved over time. My impression is that companies like Google can effectively pick whatever amount of tax they deem appropriate to pay, and if it looks ridiculously low then they can engage in legal battles with governments and come to a settlement.
You mention the top 1% pay 29% of the income tax. A lot of campaigners and Gary Stevenson are advocating on taxing wealth which doesn’t necessarily mean income. Assets generating wealth are being hoarded in the UK tax free. As stated by Oxfam: “The richest 1 percent grabbed nearly two-thirds of all new wealth worth $42 trillion created since 2020, almost twice as much money as the bottom 99 percent of the world’s population”. This is where the inequality is being driven from. Not just income of people earning over 120k a year.
in this piece he was specifically advocating for going back to the tax system of the 1970s. I’ll write about wealth tax soon.
The Oxfam figures are entirely irrelevant to UK tax policy, given that most of the new wealth was created in the US and China. Good luck proposing a wealth tax in either country.
Great article by Dan, but your point is key to looking at this from a macro-economic perceptive. For example, GDP is not the same a the national wealth. GDP has grown by around 40 over the last 20 years, but wealth has doubled. We need to consider that economies like the UK tend to distribute most wealth via asset appreciation.
It would be interesting to see this analysis redone including NI (both employers’ and employees’). They are both just income taxes by another name, so it is potentially misleading to say that the top rate now is 45%.
Aside from anything else, doing analysis on only part of the taxes charged on income encourages successive governments to hide the true amount of income tax they are charging.
Fascinating piece of work. I joined the then Inland Revenue in 1981, having just completed a degree in economics. Fairly rapidly I came to recognize a gulf between how the academic literature perceived the UK tax system worked and its reality. Your footnotes touch on this. I also came to realise that the cruise my father’s employer had funded for our entire family 10 years earlier was of course a “perk” in lieu of a taxable cash bonus. The company car & generous expense account went without saying. A ripe topic for further research.
thanks! Yes, it’s funny how everything I’ve written here is “old news” to the tax profession (particularly people around at the time), but I think hasn’t entered popular consciousness at all.
Going back to the 50s, tax avoidance was advanced by eminently respectable advisors. In the case of my Grandfather’s business the advisors acting for the business were Allrm & Overy and Peat Marwick Mitchell. The avoidance centred on the definition of a Close Company and what constituted a Participator with the express intention of avoiding what my father referred to as a forced distribution. The business won in the Court of Appeal, with permission refused to appeal to the HoL. The Inland Revenue changed the law the following year.
It was, of course, a deliberate restructure with the intent to avoid tax. It would never have held water today.
and respectable advisers continued to create tax avoidance schemes (renamed to “structured finance”) until the financial crisis. Now of course they wouldn’t go near it. That change wasn’t driven by ethics but by changes in law and practice which meant anyone honesty knew the schemes were all doomed.
Worked as a junior accounts clerk for a reasonably large West End (of London) firm of accountants. All they did was a bit of audit, absolutely no business consulting, and floor to ceiling tax returns for people most of whom were on PAYE. Seemed to me, at the time, that, everyone regardless of their income, had a reason to file a tax return.
I feel there’s been a collective memory loss about how normal middle class people used to file tax returns (and claim reliefs/deductions). It’s been a big change.
Excellent Dan and team as ever.
I suspect something similar would emerge from analysis of the US in the 1950’s and 60’s.Relatively high income tax but massive growth post WW II.
Expansion of Working and Middle Class
I expect so – would be great to see a US-specific article covering the same ground.
Thank you i look forward to receiving these newsletters as I feel I’m being educated. You rock.