It’s often claimed that tax cuts will “pay for themselves”. There’s good reason to believe that some historic tax cuts have done precisely this – what does that tell us about proposals for tax cuts today?
And what does history tell us about the potential to increase revenues by raising tax on the highest earners?
When tax cuts probably paid for themselves
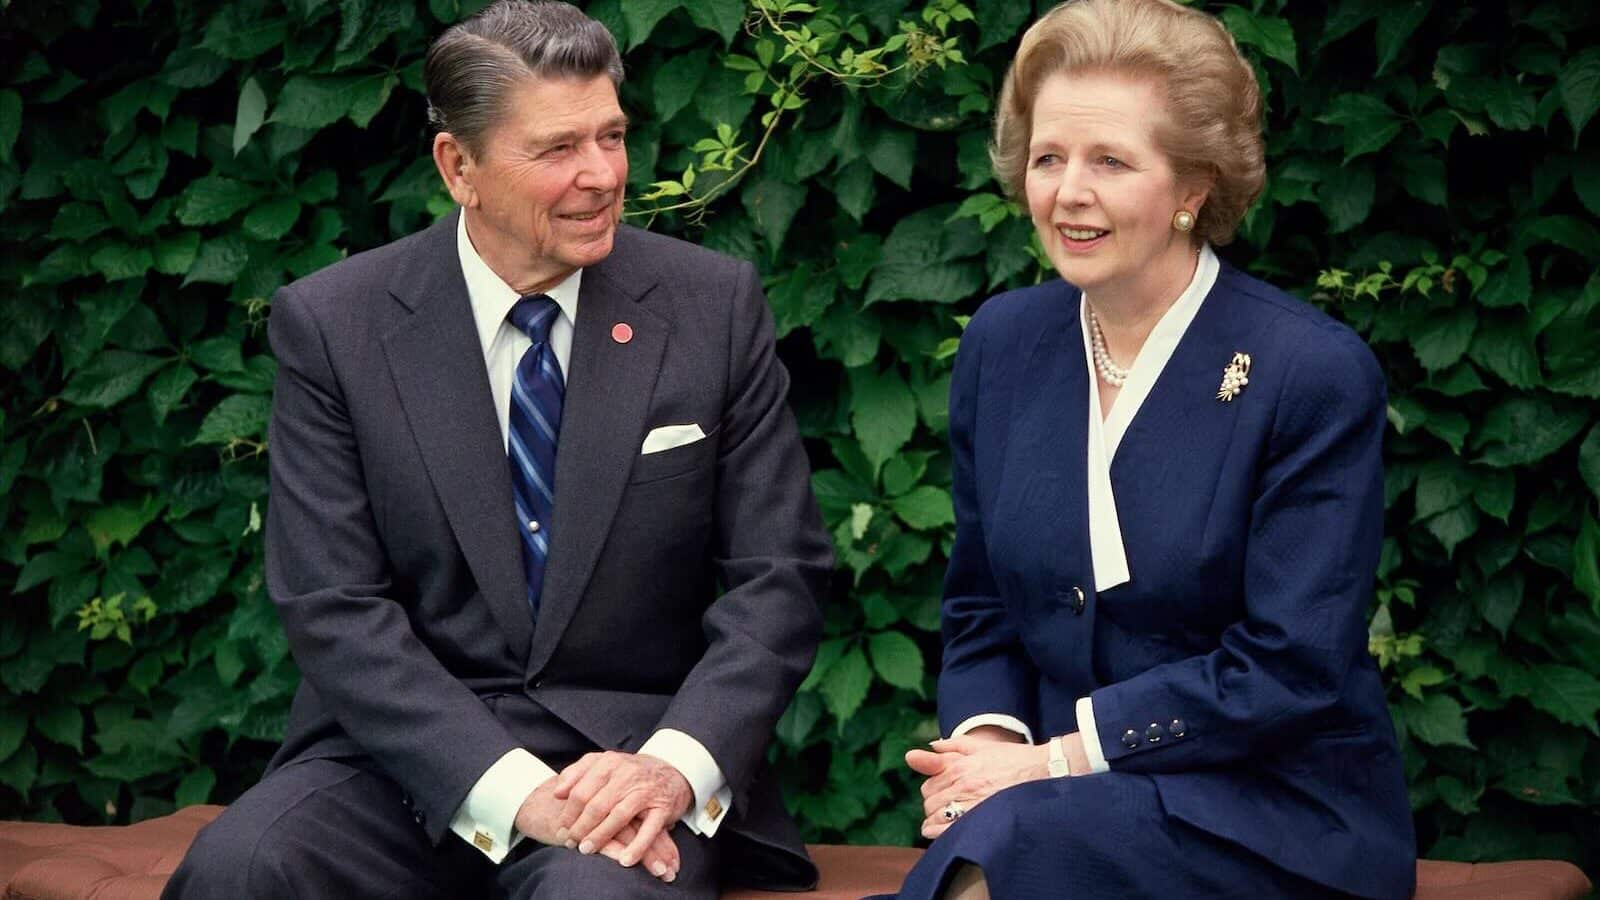
Margaret Thatcher and Geoffrey Howe cut tax dramatically in 1979.
Thatcher inherited a top rate of income tax of 83% on “earned” income.1Also, astonishingly, 98% on “unearned” income. I’ll focus on the 83% rate in this article. I would hesitate before applying the approach below to the 98% rate, because the numbers get very silly, and I’m doubtful many people ever paid the 98% rate (because: why would you?).
The 83% rate applied to incomes over £24,000; about five times average 1979 earnings, and twice the salary of a headmaster.2Average earning figures are here. I’ve used the figure for average male earnings; average female earnings were 40% lower, but significantly fewer women were in the workplace than today. In today’s money, around £120,000. It was a high income, but not exceptionally high.
In Howe’s first Budget, the rate was cut to 60%.
Wearing our 2024 spectacles, 83% to 60% isn’t a hugely generous tax cut. But think about what it means in cash terms. £10,000 taxed at 83% leaves you with £1,700. £10,000 taxed at 60% leaves you with £4,000. That’s a 135% increase in your after-tax income (“change in net of tax rate”, in the jargon).
This is a much more dramatic change than for the tax cuts we see discussed in 2024. There is literally no tax cut that could have this kind of impact today. Even cutting the top 45p tax rate all the way down to 1p would “only” increase after-tax income by 80%.
Intuitively, it feels plausible that more than doubling peoples’ after-tax income would have significant effects on peoples’ behaviour. But we can do better than “plausible” – let’s put some numbers on it.
A simple example
Economists talk about the “taxable income elasticity” – the TIE. That’s the degree to which people’s reported income increases as tax cuts leave them with more income after-tax. Why does it increase? Some mixture of incentive effects, reduced avoidance and reduced tax evasion.
Let’s say the TIE in 1979 for people paying the 83% rate was 1. This figure is almost certainly wrong, but it makes the maths easy, and we’ll come back to the true figure later.
And, whilst TIEs are usually applied to the aggregate tax base, i.e. the whole economy, let’s make our calculation simpler by assuming the economy consists of one taxpayer, who has £10k of earnings in the top tax band.3I’m ignoring another factor; Howe reduced the tax bands in real terms – that makes the tax cut even more effective than this simple model suggests.
Applying the hypothetical TIE of 1, then that Thatcher tax cut, with a 135% increase in after-tax income, would result in reported incomes increasing by 135%.
Instead of our one taxpayer earning £10k and paying £8,300 tax, they’d be earning £23,529. Perhaps they work more hours, perhaps they work harder, perhaps they stop avoiding tax or under-declaring income.4And in a real “whole economy” approach there would be other factors – increased net migration of high earners, deferred retirement, etc. And of course not all taxpayers paying the top rate of tax are the same – someone earning just a little more than £23,000 would have been very different from someone receiving millions. Either way, they are earning more, retaining more after-tax and paying more tax:
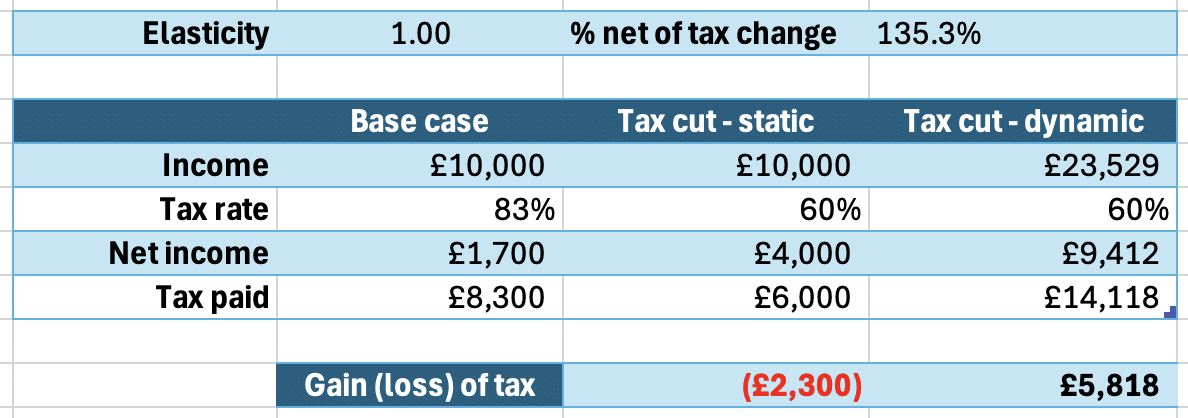
Everybody wins. It’s that rarest thing in economics – a free lunch.
You can download this example spreadsheet here. The “base case” is before the tax cut. The “static” column is with the tax cut, but ignoring elasticities. The “dynamic” column includes the TIE effect (but not other dynamic effects, e.g. economic growth – see below for that).
It’s important to stress that this calculation was purely illustrative – I pulled a taxable income elasticity of 1 out of the air, just because it made the calculation easier.
What would the TIE actually be?
A more realistic example
The problem is that estimating the TIE is hard. It varies between countries, changes over time, and is different for people earning different incomes, and even for people of different ages.5There’s a good discussion of these issues in this paper by Saez, Slemrod, and Giertz, see page 40.
There’s an even more important factor: the TIE varies depending on tax policy.6See the reference to “loopholes” on page 16 of Saez et al. Let’s say I can pay £50 for a tax avoidance scheme that magically reduces my tax rate from 83% to 60%. The TIE on the Howe tax cut would be enormously high, because all the people previously buying the scheme will now just declare their income.7This example is not that far away from some of the tax avoidance schemes that were common in the 1970s and early 1980s.
The TIE has to be inferred from natural experiments created by tax reforms and “kinks” in the tax system. For example, sometimes we see more taxpayers than expected “bunching” at a particular income point, just before a higher marginal rate kicks in (but estimating the TIE from these kind of effects is difficult).
A TIE of 1 is extremely high.8Note that I am talking here solely about tax on income – elasticities for some other taxes can be much higher. Stamp duty land tax is an extreme example, given that a person’s decision whether or not to buy a house will in some cases be entirely affected by SDLT. We tend to see elasticities like that only for people on very high incomes – think the top 1% – and in very exceptional circumstances.9There’s a good introductory Harvard lecture series on this – see here and here. It is possible that those circumstances applied to the UK 83% rate – I don’t know (and I’m not aware of any evidence on this).
We do, however, have some recent evidence from the UK’s more recent introduction and then repeal of the 50p top rate.10There is an outstanding House of Commons Library briefing paper on the history of the 50p top rate. HMRC used the resulting data to estimate a TIE of 0.48, but others have come to very different conclusions. 11One might think the UK’s brief 50% top rate was a beautiful natural experiment, but the brevity of the rate means that income effects are dominated by people accelerating their income to before the rate went up, and then deferring it until after the rate went down – the linked IFS paper goes into detail on the attempts to reverse-out these effects.
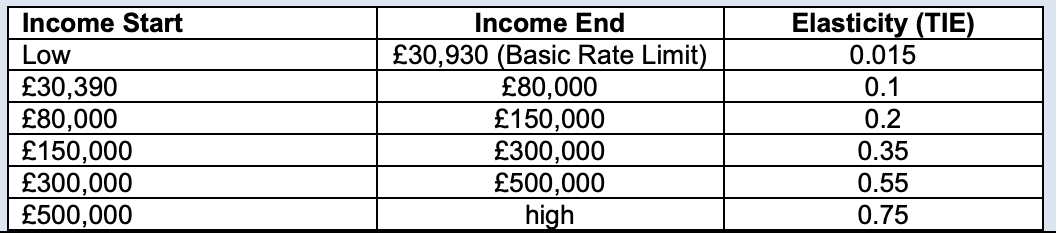
Here’s a table from the Scottish Fiscal Commission showing the TIE they expect at different income levels, based on the HMRC 50p data and a review of the literature:
So, given we can’t be sure what elasticity applied in 1979, let’s ask the question the other way round. What elasticity would be needed for the Thatcher tax cut to pay for itself, on our modelled £10k of income?12Obviously a different and much, much, easier question than “did the Thatcher tax cut pay for itself overall”.
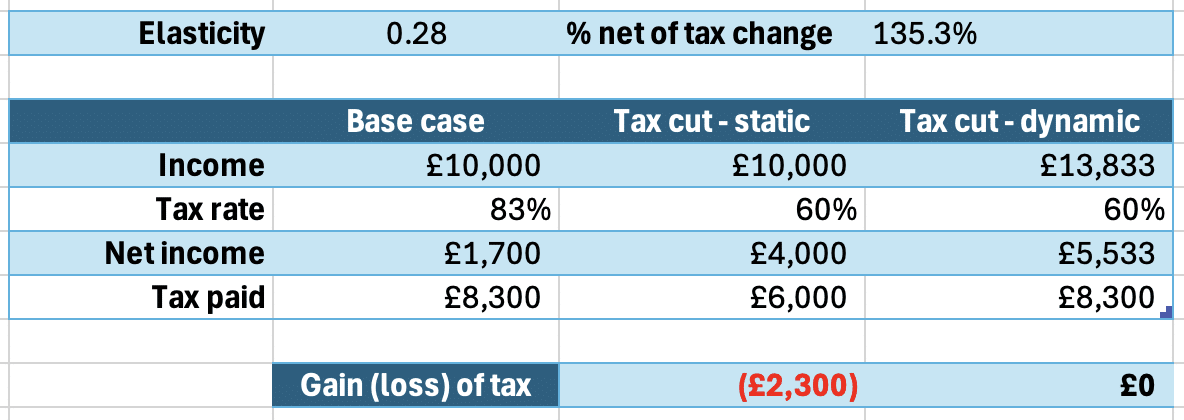
A TIE of only 0.28.
I should stress again that modelling one taxpayer in this way is an extremely simplified approach, but that the numbers are so stark that we can still say it looks very plausible that the Thatcher top-rate tax cuts paid for themselves.
This was, however, an exceptional case for two reasons. First, the effect of the tax cut was very significant (with that dramatic 135% increase in after-tax income). Second, the tax rate, even after the cut, was very high – so a good chunk of the additional income that the tax cut incentivised into existence would itself be paid in tax.
When tax cuts won’t pay for themselves
What if the UK scraps its current 45p top rate?
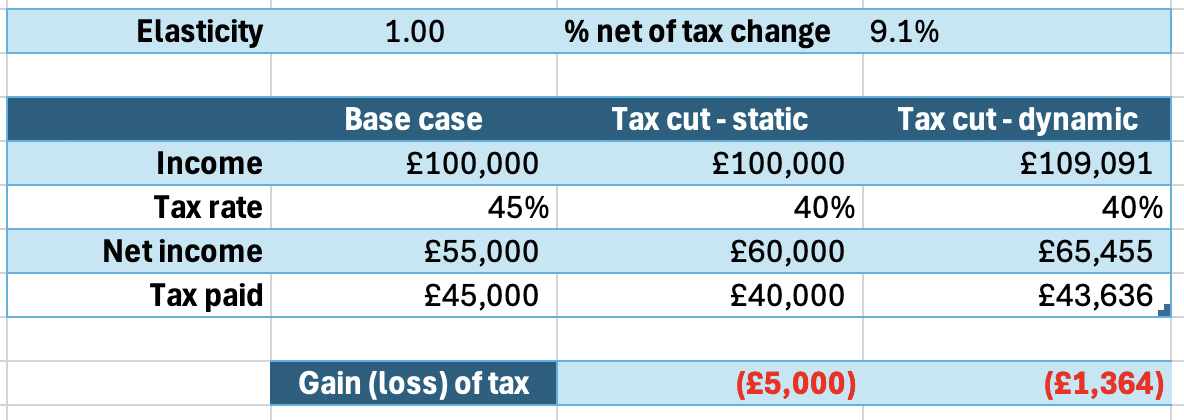
This would have a much less dramatic effect than Thatcher’s tax cut. A tax cut from 45p to 40p is the difference between retaining £55,000 and £60,000 from a £100k slice of gross income above £125k.13Important to remember that 45p is the marginal rate on this slice of income. The overall rate is much less – but it’s marginal rates that matter for incentives, and therefore for tax elasticity calculations. That’s not nothing, but it’s only a 9.1% increase in after-tax income.
We therefore need an exceptionally high elasticity for this tax cut to “pay for itself”. Even an (unrealistic) elasticity of 1 doesn’t cut it:14Although it comes quite close! See below re. Scotland.
Let’s do something more exciting. What if we adopted a “flat tax”, with everyone paying a 20p rate? So the marginal rate on a £100k slice of gross income above £125k drops from 45p all the way to 20p.
Again, let’s assume an unrealistic elasticity of 1:
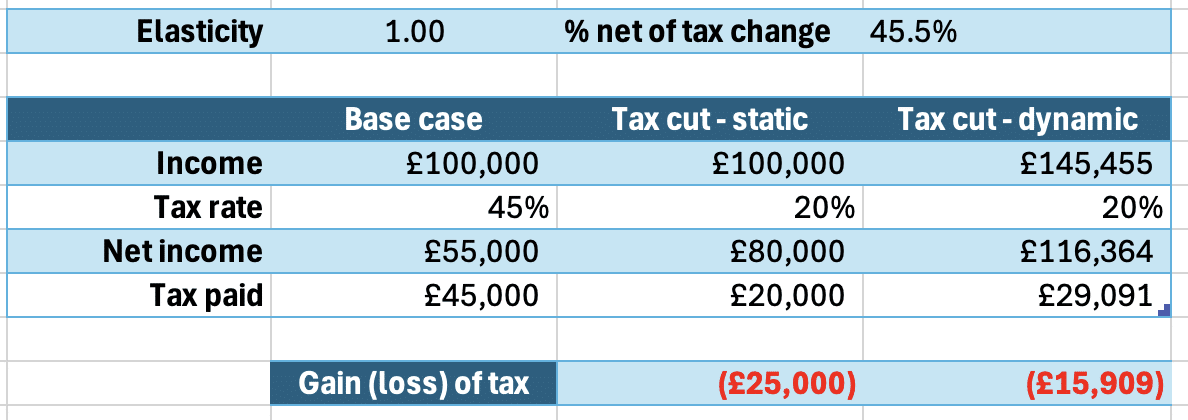
The flat tax isn’t even close to paying for itself. Why is that, given the sizeable 45% change in after tax income?
Partly because 45% is still a lot less than 135%. But also because that £45,000 of new income we’ve incentivised into existence is only taxed at 20%. It’s much, much harder for this tax cut to pay for itself than when the rate, even after the tax cut, was 60%.
I should repeat the caveat that it’s woefully simplistic to think of the economy as just one taxpayer but (as before) the numbers are clear enough to make the point.
So the depressing conclusion from this is that what was plausibly true in the 70s and early 80s probably isn’t true today – we shouldn’t expect income tax cuts to pay for themselves in the short/medium term.
There’s no free lunch in 2024.
Is the answer different in the long term?
Perhaps. Whether tax cuts pay for themselves in the long term is a different question, and one that’s highly contested.
Some economists believe the evidence shows that tax cuts in the US led to higher GDP and lower unemployment, with faster effects when the tax cuts benefit those on high incomes. Other economists have found no evidence that tax cuts for those on high income increases growth; conversely, others have found that tax cuts targeted at people on low income can increase growth.
There is also a view that funded and carefully implemented tax cuts may create growth, but unfunded/deficit-funded tax cuts will not.
I’m not an economist and so don’t have a position on these questions. However I would tentatively suggest that the lesson of the Truss/Kwarteng mini-Budget is that either the bond markets don’t believe unfunded tax cuts deliver growth, or they’re not patient enough to wait.15The outcome of the Truss/Kwarteng Budget tells us nothing about funded tax cuts, but it’s a rare politician these days who proposes to fund tax cuts with either other tax rises, or public spending cuts. Thatcher, by contrast, did fund her income tax cuts. Whilst the cut in the highest rate of income tax probably paid for itself, other income tax cuts (for example cutting the basic rate from 33% to 30%), did not – and they were much more expensive. So Howe’s Budget raised the rate of VAT from 8% to 15%; later tax cuts were partly funded by revenues from oil and gas taxation.
What does the TIE tell us about raising taxes?
The simple spreadsheets above show the position for hypothetical individual taxpayers. They don’t attempt to model the impact across all taxpayers.
You can, however, use the TIE in a more sophisticated calculation to find the “revenue maximising tax rate” – the top income tax rate that will raise the highest amount of tax, based upon assumptions as to the shape of the income distribution.16If we assume income is flat, the revenue-maximising rate is simply 1 / (1 + TIE), but we shouldn’t assume income is flat.
So, let’s forget tax cuts for the moment, and answer a different question: can we raise more revenue by increasing tax on those on the highest incomes?
One influential paper estimated that, if the TIE is 0.46, then the revenue-maximising tax rate on the highest earners would be 56.5% (see page 102).
An employed17Employer’s national insurance means the marginal rate is much higher for an employee than someone who is genuinely self-employed, or an investor. high earner in England today pays a top income tax rate of 45%, plus 2% employee national insurance – and their gross wages are subject to 15% employer national insurance.18That’s relevant because, in the long term, the burden of employer national insurance falls on employees. That’s a total effective rate of 55% – rather close to the revenue-maximising rate.19One might think the current effective rate is 62% (45% + 2% + 15%) but the employer NI is a % of the gross salary, and income tax and employee NI is a % of the same gross salary number. As an example: imagine a highly paid employee receiving a £100 pay rise. Employer national insurance applies at 15%. There is then 45% income tax and 2% employee national insurance – so employee taxes of £47. So the total tax is £62 (£47 plus £15) out of a total of £115 paid by the employer – a rate of 53.9%. (Apologies for the error in the original version of this article, which said the rate was 54.95%). More if we take indirect tax into account.20Whether we should do that, and how we should do that, isn’t clear to me. Brewer et al uses a 52.7% figure (on page 91) that includes indirect tax, but doesn’t explain where it comes from.
There are a large number of uncertainties – the TIE itself, as well as the assumed shape of the income distribution. So the 56.5% figure should not be taken as a policy absolute – but it does suggest that we should be cautious about assuming that increasing the 45p rate will raise more tax.
The Scottish experiment
The Scottish government is kindly conducting an experiment into what happens if you do go higher than 45p.
In this year’s Scottish Budget, the top rate went up to 48p (from 47p). Here’s the Scottish Fiscal Commission’s figures on how much that will raise:21See figure 4.12
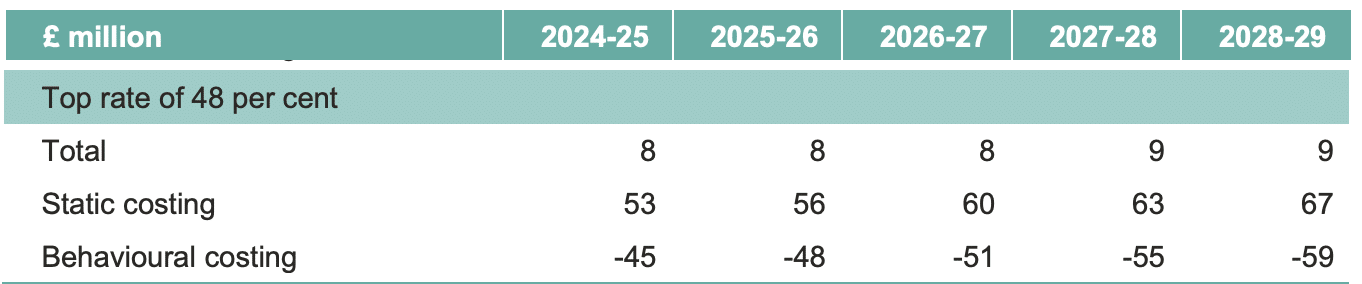
Almost all (85%) of the potential revenue from the 48p rate vanishes in “behavioural responses”. This is an extremely inefficient tax increase.
There is still a positive revenue yield from the 48p rate, based on reasonable assumed tax elasticities. But, given how close this is to the break-even point, it wouldn’t take much for the behavioural response to exceed the static revenue. We may well find that elasticities that are reasonable for the UK as a whole are not appropriate for Scotland. Scottish taxpayers have a magical tax planning solution available to them that UK taxpayers don’t. They can leave Scotland, or not return, or not arrive in the first place. 22These effects will be small, but they are real, and across an economy small effects can matter. And migration is a particularly bad effect for a tax rise to have, because you’re not just losing some marginal amount of a taxpayer’s income – you’re losing all of it. So, as the IFS says, the Scottish top rate of tax may reduce revenue.23Disclosure: I’m a member of the Scottish Government’s Tax Advisory Group, but we were not involved in the decision to raise the top rate.
We should know the result of the Scottish experiment in a few years’ time.
Is it just about the numbers?
Of course some people believe high taxes on those on high incomes are justified for reasons other than tax revenue – for example to reduce inequality by reducing the after-tax incomes of people on high incomes.24There is also a deeply counter-intuitive view that higher taxes can encourage entrepreneurship. Others believe that we shouldn’t be trying to maximise tax revenues, but rather maximise economic growth25i.e. because when we are the Scottish point of extremely diminishing returns, some of the tax revenues “lost” to behavioural effects represent real lost economic growth or welfare. Some believe that high taxes are not very effective at reducing inequality. And of course some believe that high taxes are immoral per se.
My take is that, if you want to raise more tax from people on high incomes, you should not do so by raising the top rate of income tax, but focus on the base – for example capital gains tax. And if we want tax cuts, we have to fund them.
Photo by Levan Ramishvili, identified as public domain.
- 1Also, astonishingly, 98% on “unearned” income. I’ll focus on the 83% rate in this article. I would hesitate before applying the approach below to the 98% rate, because the numbers get very silly, and I’m doubtful many people ever paid the 98% rate (because: why would you?).
- 2Average earning figures are here. I’ve used the figure for average male earnings; average female earnings were 40% lower, but significantly fewer women were in the workplace than today.
- 3I’m ignoring another factor; Howe reduced the tax bands in real terms – that makes the tax cut even more effective than this simple model suggests.
- 4And in a real “whole economy” approach there would be other factors – increased net migration of high earners, deferred retirement, etc. And of course not all taxpayers paying the top rate of tax are the same – someone earning just a little more than £23,000 would have been very different from someone receiving millions.
- 5There’s a good discussion of these issues in this paper by Saez, Slemrod, and Giertz, see page 40.
- 6See the reference to “loopholes” on page 16 of Saez et al.
- 7This example is not that far away from some of the tax avoidance schemes that were common in the 1970s and early 1980s.
- 8Note that I am talking here solely about tax on income – elasticities for some other taxes can be much higher. Stamp duty land tax is an extreme example, given that a person’s decision whether or not to buy a house will in some cases be entirely affected by SDLT.
- 9
- 10There is an outstanding House of Commons Library briefing paper on the history of the 50p top rate.
- 11One might think the UK’s brief 50% top rate was a beautiful natural experiment, but the brevity of the rate means that income effects are dominated by people accelerating their income to before the rate went up, and then deferring it until after the rate went down – the linked IFS paper goes into detail on the attempts to reverse-out these effects.
- 12Obviously a different and much, much, easier question than “did the Thatcher tax cut pay for itself overall”.
- 13Important to remember that 45p is the marginal rate on this slice of income. The overall rate is much less – but it’s marginal rates that matter for incentives, and therefore for tax elasticity calculations.
- 14Although it comes quite close! See below re. Scotland.
- 15The outcome of the Truss/Kwarteng Budget tells us nothing about funded tax cuts, but it’s a rare politician these days who proposes to fund tax cuts with either other tax rises, or public spending cuts. Thatcher, by contrast, did fund her income tax cuts. Whilst the cut in the highest rate of income tax probably paid for itself, other income tax cuts (for example cutting the basic rate from 33% to 30%), did not – and they were much more expensive. So Howe’s Budget raised the rate of VAT from 8% to 15%; later tax cuts were partly funded by revenues from oil and gas taxation.
- 16If we assume income is flat, the revenue-maximising rate is simply 1 / (1 + TIE), but we shouldn’t assume income is flat.
- 17Employer’s national insurance means the marginal rate is much higher for an employee than someone who is genuinely self-employed, or an investor.
- 18That’s relevant because, in the long term, the burden of employer national insurance falls on employees.
- 19One might think the current effective rate is 62% (45% + 2% + 15%) but the employer NI is a % of the gross salary, and income tax and employee NI is a % of the same gross salary number. As an example: imagine a highly paid employee receiving a £100 pay rise. Employer national insurance applies at 15%. There is then 45% income tax and 2% employee national insurance – so employee taxes of £47. So the total tax is £62 (£47 plus £15) out of a total of £115 paid by the employer – a rate of 53.9%. (Apologies for the error in the original version of this article, which said the rate was 54.95%).
- 20Whether we should do that, and how we should do that, isn’t clear to me. Brewer et al uses a 52.7% figure (on page 91) that includes indirect tax, but doesn’t explain where it comes from.
- 21See figure 4.12
- 22These effects will be small, but they are real, and across an economy small effects can matter. And migration is a particularly bad effect for a tax rise to have, because you’re not just losing some marginal amount of a taxpayer’s income – you’re losing all of it.
- 23Disclosure: I’m a member of the Scottish Government’s Tax Advisory Group, but we were not involved in the decision to raise the top rate.
- 24There is also a deeply counter-intuitive view that higher taxes can encourage entrepreneurship.
- 25i.e. because when we are the Scottish point of extremely diminishing returns, some of the tax revenues “lost” to behavioural effects represent real lost economic growth
12 responses to “Tax cuts and tax rises: do tax cuts pay for themselves?”
Over the years, the ‘morality’ attitude towards taxation has always escaped me. The government is there to provide for its citizens, and so governments everywhere tax us, to pay for the stuff we all need and use. I have never minded paying my taxes, even whilst bemoaning (and voting accordingly) incompetent policy choices on spending.
The idea that people should be ‘punished’ for being either at the top of the income ladder, or the bottom, still seems bizarre especially when accompanied by a seemingly intractable blindness when faced with taxing wealth as opposed to income
Wishing for a New Year with competent adults in charge that are not afraid to make sensible tax policy decisions, even if they cost me some money.
I’d love to understand more about people’s non-linear behaviour to tax. By that I mean that increasing something by 1% makes it 1% worse but increasing the same thing by, say, 2% makes it 100% worse.
An anecdote – I used to talk to senior managers at companies about ways to reduce employee tax and NIC (not dodgy or aggressive schemes). Some of these ideas were straightforward to implement, some more complex.
When the highest rate was 40%, the managers focused on the implementation complexity (“payroll won’t cope – can’t do it”), rather than the tax/NIC saving, and this meant that there was resistance to taking steps to reduce tax that were not straightforward to implement.
When the 50% tax rate was annouced in April 2009, the people I spoke to again focused on the simplicity / complexity to implement. However, the managers often started discussing between themselves how to deal with those complexities without prompting (“payroll won’t cope – but we probably need to get a new one anyway”).
My personal takeaway was that there is a big switch in people’s attitude to tax when more than 50% of (just a part of) someone’s pay (tax and NIC) is taken away. In these cases the tiny change to someone’s marginal tax rate (leading to an extra £20,000 of additional tax on someone earning £350,000) could result in millions of lost tax/NIC on the whole organisation’s pay for many years to come.
Another anecdote was that for a while I had a marginal tax rate of 75.2% on a small element of my income that I could not do anything about. As it was on a tiny element it made relatively little difference to my average tax rate, but it bugged me so much that after a couple of years it was one of the reasons I decided to stop working.
Final anecdote – I know someone who booked flights to Dubai a couple of hours after new the government’s October budget. Not to emigrate this year but to see whether they’d want to move there in the next couple of years. So small tweak might mean 100% loss in tax.
I think you are missing a key point about lower taxes and in particular a flat tax. It is not just the rate. You need to decrease the rate but also simplify the system and reduce the special exemptions and silly rules that make everything so complicated. Give with one hand and take a bit back with the other in such a way you encourage economic activity and decisions on their own merits and not to game the system. This is more subtle and likely to greatly increase the size of the pie so making sure ‘cuts’ are self funding in the whole.
For most people, the only special rule/exemption relevant to their income tax is tax relief on pension contributions. If you’re suggesting ending this then that’s quite a big deal, and means basic rate taxpayers would be losing out badly. If you don’t mean this, then what exemptions/rules are you referring to?
Point 19 – the gross salary would be £86.96. Therefore the tax would be £39.13 & employee NIC £1.74. So the total would be 39.13+1.74+13.04 =53.91
On the lower earnings side and incentives you can treat reductions in means tested benefits as a ‘tax’ and that can lead to 93% of employers additional pay being taken by government on next April’s NLW increase – see https://benefitsinthefuture.com/the-new-government-is-continuing-to-be-extremely-generousto-itself/. The combined effect of tax / NI / benefits reduction Meike’s MDR very different at different stages of income increase – https://benefitsinthefuture.com/2020-a-good-year-for-generous-work-incentives-how-the-government-is-really-doing/ .
Universal Basic Credit is now required to even out the economy, clear away, using AI, all the blockers and time wasters dealing with marginal rates of aggravated income. Better to cooperate and share as a basic – and then people will be free to be innocent, carousing and feasting.
And then we go back to work – doing something to help others and earn as much as we want. Tax rates should head towards 10%; with Land Value Tax paid to us for forcing us to go around an estate; and a daily variable transaction tax to ensure the day’s books (AI generated) are balanced. Being free is from those who TIE us to our current broken system.
Dan already has covered the issue of the marginal rates as income get higher. The other issue as we will find with employers nic is the higher numbers of smaller businesses that will not register for paye at all and pay cash to staff especially ethnic restaurants that get staff from overseas that don’t know their rights. This just isn’t policed now as Hmrc only works from home.
If HMRC only works from home then they might well do more “test” purchases of their local takeaways: https://caselaw.nationalarchives.gov.uk/ukftt/tc/2024/1124
Not wishing to be pedantic, but I don’t think your maths quite right on the 55% effective rate (footnote 19).
Of a total employer cost of £100, £87 would be pay and £13 would be employer NIC (being 15% of £87). Then IT and employee NIC would be 47% of £87, or £41.
my apologies – you’re quite right. Silly error, now fixed.
It is the high marginal rates of tax due to personal allowance taper, HICBC and tapered annual allowance,that make people change behaviour by reducing effort and output, using pensions to avoid these high rates and, to some degree, participate in tax evasion. I know a lot of people who would pay significantly higher income tax if these were removed.