
The general election tax debate has been irrelevant. The few £bn being discussed is dwarfed by the actual tax UK tax increases over the last few years, and the further tax increases we’ll almost certainly see in the future.
I summarised this point on Sky TV on Wednesday.
Here’s all UK taxes paid in 2023-24:1The source is the receipts figures from the OBR’s public finances databank. This is the raw data – the only change I’ve made is aggregating taxes that raise less than £3bn into the “other taxes” bucket. The OBR’s most recent economic and fiscal outlook is here.

Here’s what happens if we add on the Conservative Party’s extremely debateable claim that Labour will increase household taxes by £2,000 over four years – that’s about £10bn in total:2Here I’ve just taken their £38.5bn over four years and divided it by four, i.e. £9.6bn.

£10bn is just an irrelevance in the context of almost a trillion pounds of total tax receipts. And it vanishes into statistical noise when we remember that OBR tax receipt forecasts are lucky to get within £30bn of the true figure.3The most recent error was £36bn – see the OBR’s October 2023 forecasting evaluation report, table 3.1.
And here’s Labour’s actually announced tax increases:4About £10bn in total – a very similar amount to the Conservative estimate, but raised from different people. £5bn from “cracking down on tax dodgers“, £1.7bn from VAT on private school fees, about £1bn from “closing non-dom loopholes“, about £2bn from extending the energy “windfall tax”:

Also an irrelevance.
By contrast, here’s the OBR’s projections for the overall increase in taxation as a % of GDP from 2023/24 to 2028/29:5The source is the receipts figures from the OBR’s public finances databank. The tax increase is calculated by simply taking the difference between tax receipts as a % of GDP in 2023/24 vs 2028/29 (1.2%), and multiplying this by the UK GDP figure used in that same dataset. This results in £30bn. We’d of course get a much larger number if we looked at the real terms difference between cash tax receipts over that period – £114bn – but it’s a fairer comparison to calculate by reference to GDP.

The bigger picture
The current level of taxation follows a few years of significant increases in tax.
Here’s how much of the 2023/24 tax burden reflects an increase since 2010:6Same OBR source. The tax increase is calculated by simply taking the difference between tax receipts as a % of GDP in 2023/24 vs 2010/11 (2.7%), and multiplying this by the UK GDP figure used in that same dataset. This results in £70bn. We’d of course get a larger number if we looked at the real terms difference between cash tax receipts over that period – £216bn – but it’s a fairer comparison to calculate by reference to GDP.

And here’s the OBR’s expected overall increase in taxation from 2010 through to 2028/2029:7Same methodology but looking at the 2028/29 OBR receipts figures and forecast. The increase in tax as a % of GDP over this period is 3.9% which equates into £100bn in 2023/24 money. If we look at the real terms difference between cash tax receipts over this period we’d get £330bn.

This is dramatic, but not in the main the result of policy choices – it’s largely a function of demographic change and systemic shocks from the financial crisis and the pandemic (and, to a smaller degree, Brexit). And any attempt to convert these figures into “per household” numbers would be highly misleading given that many ordinary households have not seen an increase at all.
The European picture
Even the charts above leave us a long way off European levels of taxation.
Here’s the additional tax we’d be paying if we increased UK tax to the average 2023/24 level in the Euro-area:8Source is Eurostat – average 2023/24 figure is 41.9%, equating to £152bn more tax if we apply to UK GDP for 2023/24. We aren’t aware of projections for 2028/29, but we assume the figure will be materially higher. So the fair comparison isn’t with the 2028/29 chart immediately above, but the 2023/24 chart before that.

And here’s the increase if we matched France:9Source again is Eurostat – the French figure for 2023/24 is 49%, equating to £334bn more tax if we apply to UK GDP for 2023/24. One would assume the figure will be higher for 2028/29 but it’s not clear how high it can realistically go. But again the fair comparison is with the UK 2023/24 chart not the 2028/29 chart.

The difference is massive – more than the total UK VAT and corporation tax receipts.
The tax debate I’d like to see
So my plea to everyone is: stop discussing irrelevant amounts of tax as if it matters.
Here are three honest positions politicians could take:10In principle there is an alternative; boost productivity and grow the economy. It was economic growth that enabled significant rises in public spending in the 2000s without significant tax rises. But even if this could be achieved, it’s not going to move the dial much in the next few years.
- Accept the status quo, and that the UK will, by 2028/29, pay about £100bn more tax than it did in 2010/11 (in 2023/24 money). Make changes at the margins but acknowledge that’s all they are. The question then is: where will this burden fall? And what will the consequences of that be?
- Advocate for significantly lower taxes, and (assuming you don’t want to crash the markets) explain which public services you’ll cut to fund the tax cuts, and the consequences of this for households and the wider economy.
- Advocate for a significantly higher level of state spending, comparable with the European or even French figures. Again assuming you don’t want to crash the markets, explain what taxes you’d increase, and the consequences of that for households and the wider economy. And expect everyone to be sceptical if you claim only the rich would pay, because that’s not what happens in any of the countries that actually do have significantly higher spending than the UK.
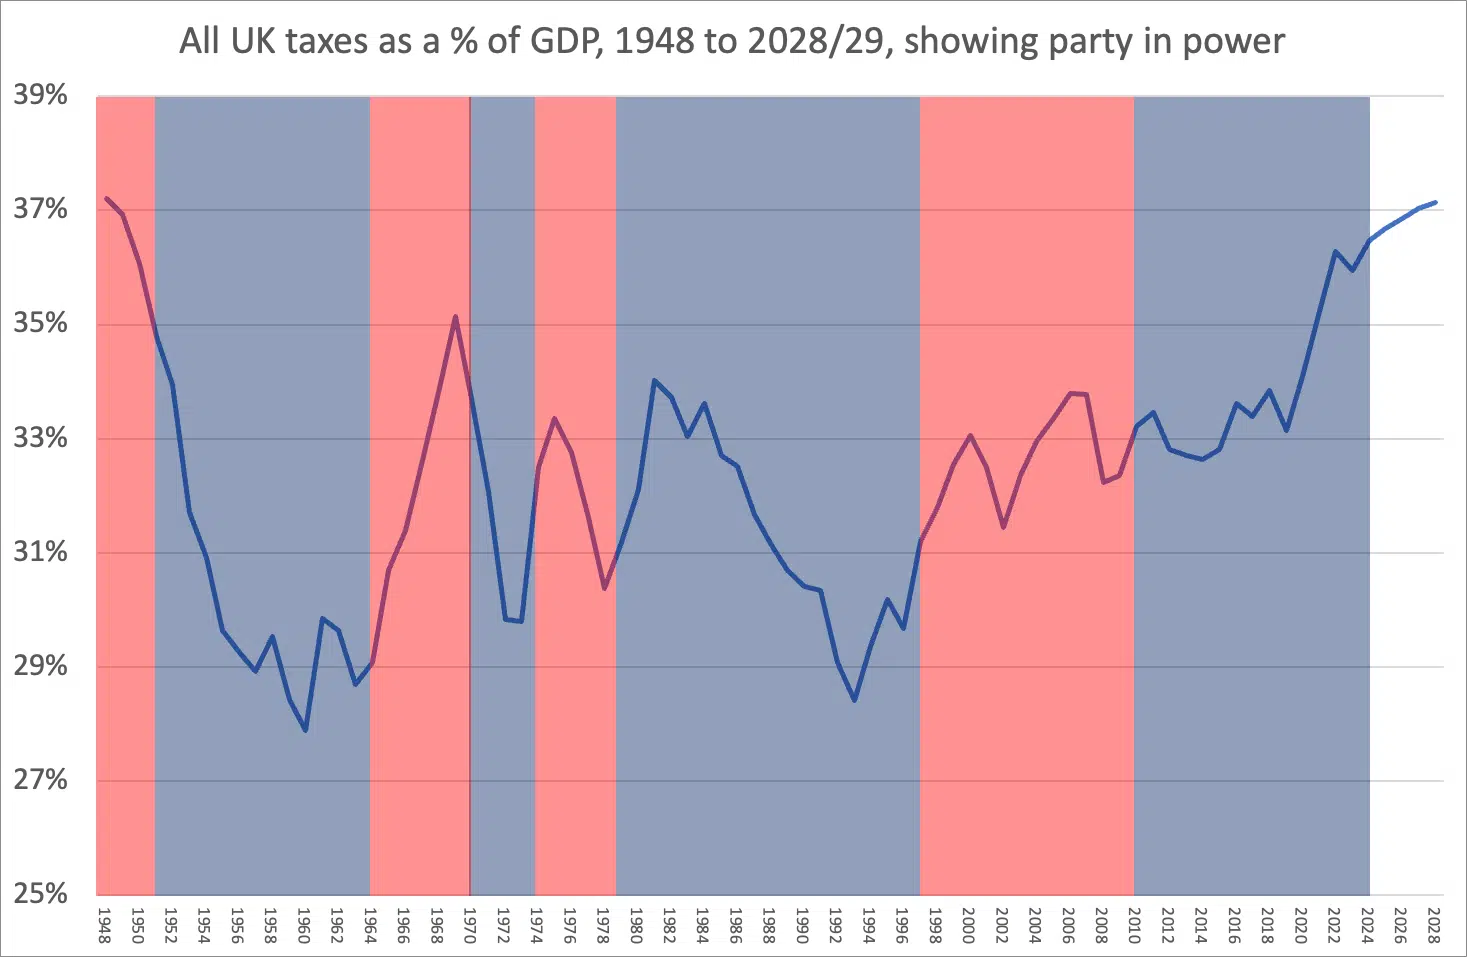
And let’s please try to be careful not to fall for simple stories about political parties and levels of tax. If we take tax as a % of GDP over the last eighty years, and shade in periods of Labour government (red) and Conservative11And from 2010-2015, Conservative/Lib Dem coalition government (blue), it’s reasonably clear that the economic cycle has been much more important than the political cycle:
Finding answers is hard – but let’s at least try to ask the right questions.
- 1The source is the receipts figures from the OBR’s public finances databank. This is the raw data – the only change I’ve made is aggregating taxes that raise less than £3bn into the “other taxes” bucket. The OBR’s most recent economic and fiscal outlook is here.
- 2Here I’ve just taken their £38.5bn over four years and divided it by four, i.e. £9.6bn.
- 3The most recent error was £36bn – see the OBR’s October 2023 forecasting evaluation report, table 3.1.
- 4About £10bn in total – a very similar amount to the Conservative estimate, but raised from different people. £5bn from “cracking down on tax dodgers“, £1.7bn from VAT on private school fees, about £1bn from “closing non-dom loopholes“, about £2bn from extending the energy “windfall tax”
- 5The source is the receipts figures from the OBR’s public finances databank. The tax increase is calculated by simply taking the difference between tax receipts as a % of GDP in 2023/24 vs 2028/29 (1.2%), and multiplying this by the UK GDP figure used in that same dataset. This results in £30bn. We’d of course get a much larger number if we looked at the real terms difference between cash tax receipts over that period – £114bn – but it’s a fairer comparison to calculate by reference to GDP.
- 6Same OBR source. The tax increase is calculated by simply taking the difference between tax receipts as a % of GDP in 2023/24 vs 2010/11 (2.7%), and multiplying this by the UK GDP figure used in that same dataset. This results in £70bn. We’d of course get a larger number if we looked at the real terms difference between cash tax receipts over that period – £216bn – but it’s a fairer comparison to calculate by reference to GDP.
- 7Same methodology but looking at the 2028/29 OBR receipts figures and forecast. The increase in tax as a % of GDP over this period is 3.9% which equates into £100bn in 2023/24 money. If we look at the real terms difference between cash tax receipts over this period we’d get £330bn.
- 8Source is Eurostat – average 2023/24 figure is 41.9%, equating to £152bn more tax if we apply to UK GDP for 2023/24. We aren’t aware of projections for 2028/29, but we assume the figure will be materially higher. So the fair comparison isn’t with the 2028/29 chart immediately above, but the 2023/24 chart before that.
- 9Source again is Eurostat – the French figure for 2023/24 is 49%, equating to £334bn more tax if we apply to UK GDP for 2023/24. One would assume the figure will be higher for 2028/29 but it’s not clear how high it can realistically go. But again the fair comparison is with the UK 2023/24 chart not the 2028/29 chart.
- 10In principle there is an alternative; boost productivity and grow the economy. It was economic growth that enabled significant rises in public spending in the 2000s without significant tax rises. But even if this could be achieved, it’s not going to move the dial much in the next few years.
- 11And from 2010-2015, Conservative/Lib Dem coalition
11 responses to “Why the general election tax debate is irrelevant”
I would be very interested to know what is needed in the future to fund state employees index linked pensions (police, fire service, civil servants, nhs etc etc) over the next 10, 20 and 30 years. I suspect the figures are mind boggling.
Hi
Love the article but the charts do not seem to change. It’s the same stats on every chart.
there’s a red rectangle on each chart showing the additional tax in each scenario, overlaid on the current UK tax revenue stats
Thank you very much Dan, I love this type of big picture article that help me understand what’s happening.
Of the possible positions, you suggested that politician could take, 2 are constrained by the market.
In big picture terms “who” makes up the market. Seems everyone needs to dance to the tunes of the this “market”. Is there any thing you can point me to that will help me understand in big picture terms who is the market and what it wants?
I’d look at what happened when Liz Truss tried unfunded tax cuts. The “market” is just people not being less willing to lend to a government that looks fiscally irresponsible.
I spend a fair amount time watching & commenting on the UK dairy foods sector. One developing trend I have seen in recent years is tax avoidance by creation of ‘groups’ and holding companies for very simple, small scale enterprises. Compounding this is the matter of supposed director loans, inter-company loans and so forth, and a not insignificant tax revenue has been spirited away. I want to see the next government focus on such tax avoidance (however legal) – first and foremost, to show other tax payers that the system is fair and equitable. But of course, the extra income will also be useful!
Thanks,Dan. An interesting read, but I question whether the infographics effectively convey your message. When the red squares are introduced, they cover up what was previously shown as blue income tax rectangle – making it appear smaller. Indeed, there is less area of blue.
One option would be to show the red square as its own top left rectangle and let the rest of the diagram adjust. (But maybe the software does not allow top left rectangle be anything other than the biggest number.)
I would be interested to see the growth in each of the categories of tax since 2010 presented in this graphical format. (Assuming the none of the categories has reduced – since negative areas cannot be easily shown!)
An excellent article.
I especially liked the graphics.
Why can’t mainstream media produce stuff like this? It’s almost as if they were in cahoots with political parties to keep the people in the dark!
Hi Dan – another great article. I agree with everything you say, except for one point. I don’t think the general tax debate is entirely irrelevant to the extent that it reveals a readiness to say things that are untrue. It was not true for the prime minister to say on Tuesday evening that the figure he put on Labour’s tax plans had come from “independent Treasury officials”.
Perhaps his defence is that he didn’t know it was untrue. That seems unlikely, given that, a day earlier, the Treasury permanent secretary had written to the shadow chief secretary making clear that a Conservative analysis of Labour spending and tax policy included costs beyond those provided by officials and pointing out that costings from unofficial sources “should not be presented as having been produced by the civil service”. The letter said that ministers had been reminded of this.
But whether this was deliberate dishonesty or merely a failure to get on top of the facts it does not reflect well on the prime minister and can only contribute to the erosion of trust in politicians and politics. In that sense, the debate matters.
You are of course right about the unimportance of the relatively trivial numbers currently being discussed by the main parties. I share the frustration of those who want a more sensibly framed debate, which acknowledges the major challenges that the public finances face. But we won’t get anywhere near that if we can’t even trust claims made about the small stuff.
Keep up the good work!
Fantastic article!
Could you do the same for Ireland?
Our general election expected in November 2024
thanks – that’s really kind, but unfortunately we don’t have capability to do that…