![o Apr 2022
_---7 Mar 2022
Feb 2022
7 Jan 2022
La Dec 2021
oo Nov 2021
“oO Oct 2021
~- Sep 2021
ee Aug 2021
7} Jul 2021
. Jun 2021
~ May 2021
a7 Apr 2021
~-* Mar 2021
ext Feb 2021
ene tL Jan 2021
Dec 2020
--* Nov 2020
-~*7 Oct 2020
Sep 2020
Aug 2020
« Jul 2020
a Jun 2020
May 2020
Apr 2020
Mar 2020
Feb 2020
Jan 2020
Dec 2019
Nov 2019
Oct 2019
Sep 2019
Aug 2019
Jul 2019
Jun 2019
May 2019
Apr 2019
Mar 2019
Feb 2019
Jan 2019
Dec 2018
Nov 2018
Oct 2018
Sep 2018
Aug 2018
Jul 2018
Jun 2018
May 2018
Apr 2018
Mar 2018
Feb 2018
Jan 2018
x Dec 2017
0% ebook VAT cut
!
U
~
£ £ £ 2 £ £ £ £ £
Oo co) co co] c=) o Oo Q c=) Q
& S & = & 8 = 8 & #](https://taxpolicy.org.uk/wp-content/uploads/2023/02/Screenshot-2023-12-27-at-16.43.54-e1703726855235.png)

The Scottish Budget – four thoughts on a tiny tax cut
The Scottish Budget was on 13 January 2026. The flagship policy is being widely reported as a cut in income tax for low earners,…
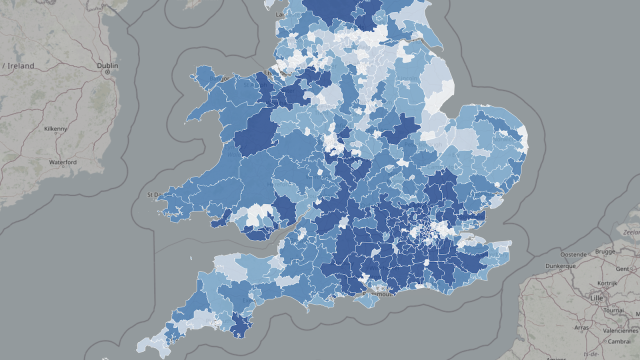
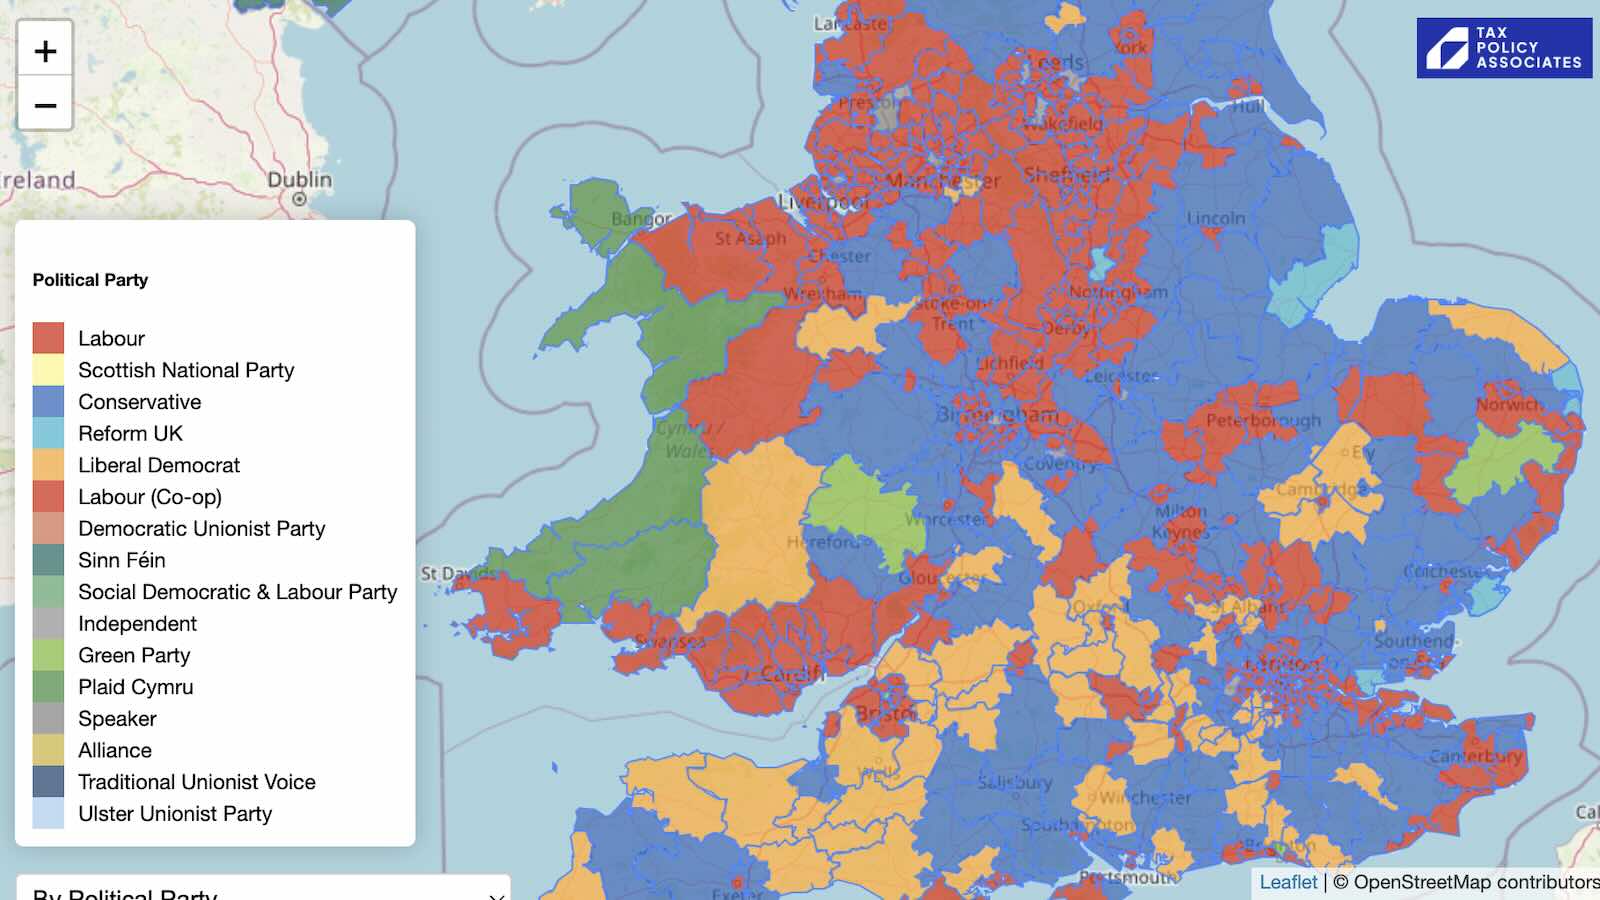
The mansion tax map: where the money comes from
We’ve modelled the impact of the English “mansion tax” by analysing land registry data on every property transaction since 1995. This lets us estimate…
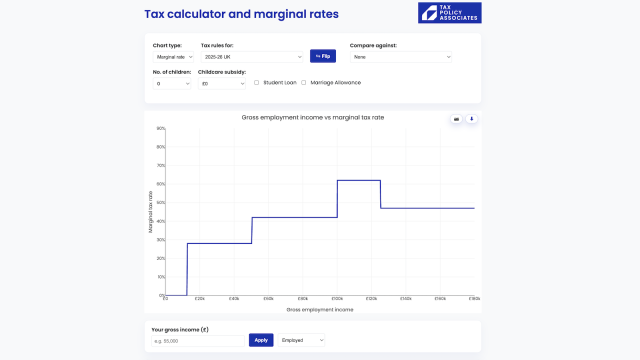
The Budget 2025 tax calculator
This online calculator calculates your tax on employment, self-employed or partnership income, and shows how it changes under a variety of Budget proposals. It…
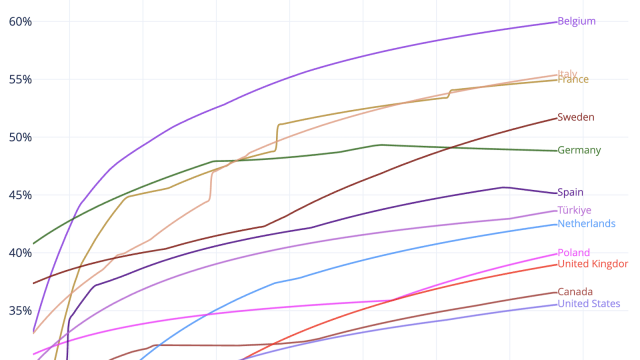
Are UK workers over-taxed? The answer in four infographics
There’s a tax paradox in the UK. Overall, we’re paying more tax as a percentage of GDP than at any time since the 1940s…
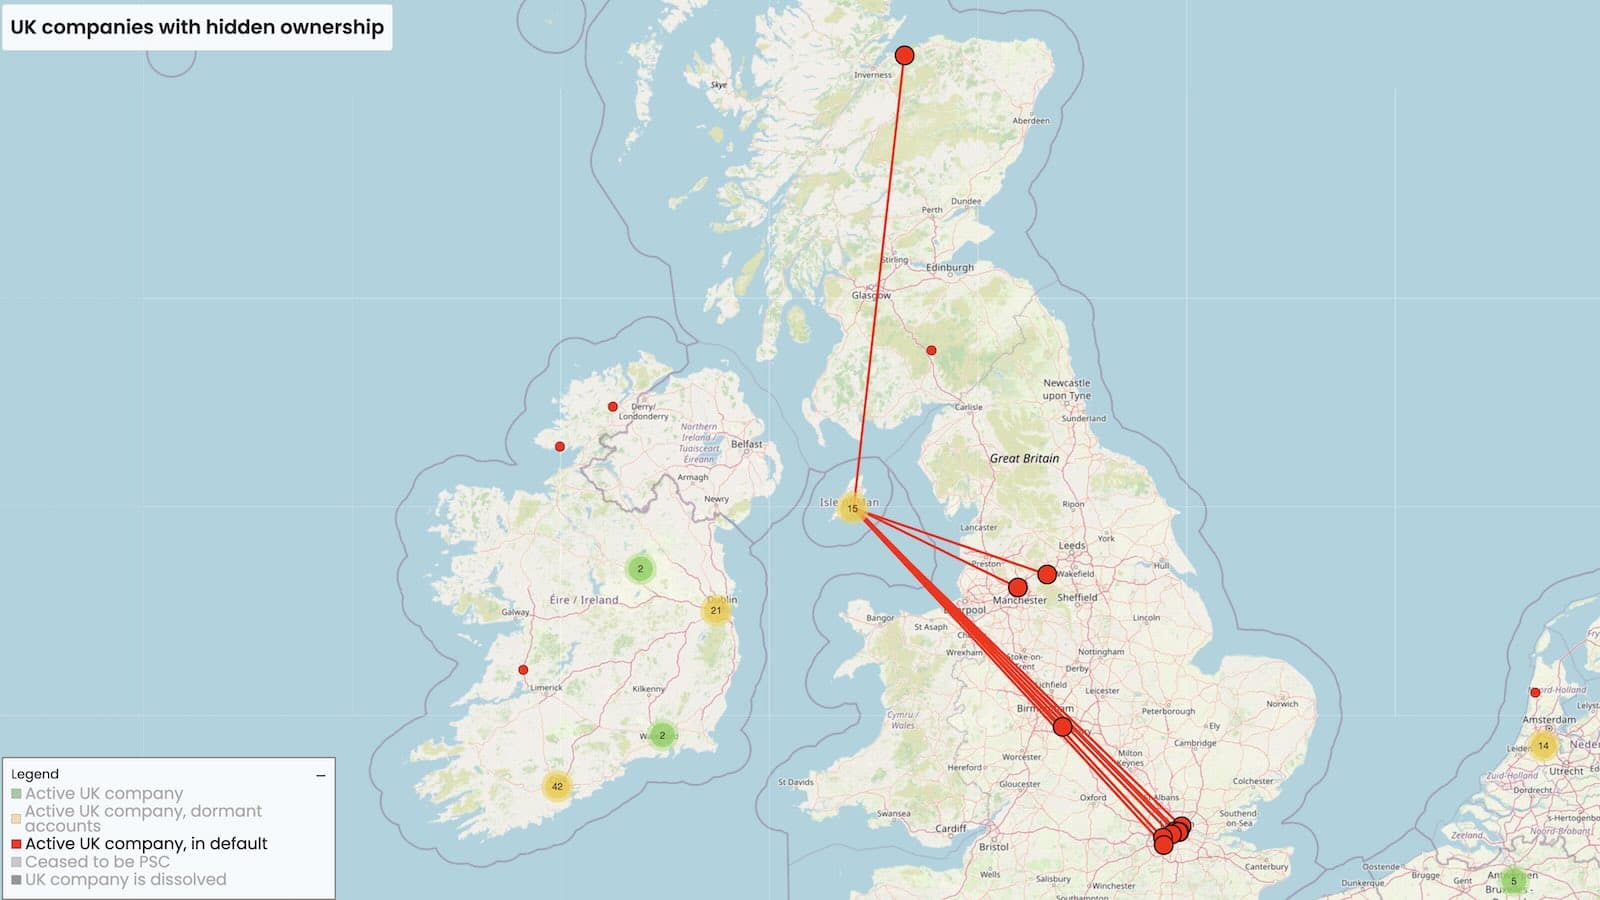
50,000 UK companies are unlawfully hiding their true owners
UK company law requires every UK company to disclose the individuals who control it – their “person with significant control” (PSC). But the rules…
Map of MPs’ donors and interests
Which MP is the highest earner? Who receives the highest donations? Who takes the most foreign trips? We’ve just launched an interactive map that…
Leave a Reply