-

The mansion tax map: where the money comes from

November 27, 2025

25 Comments

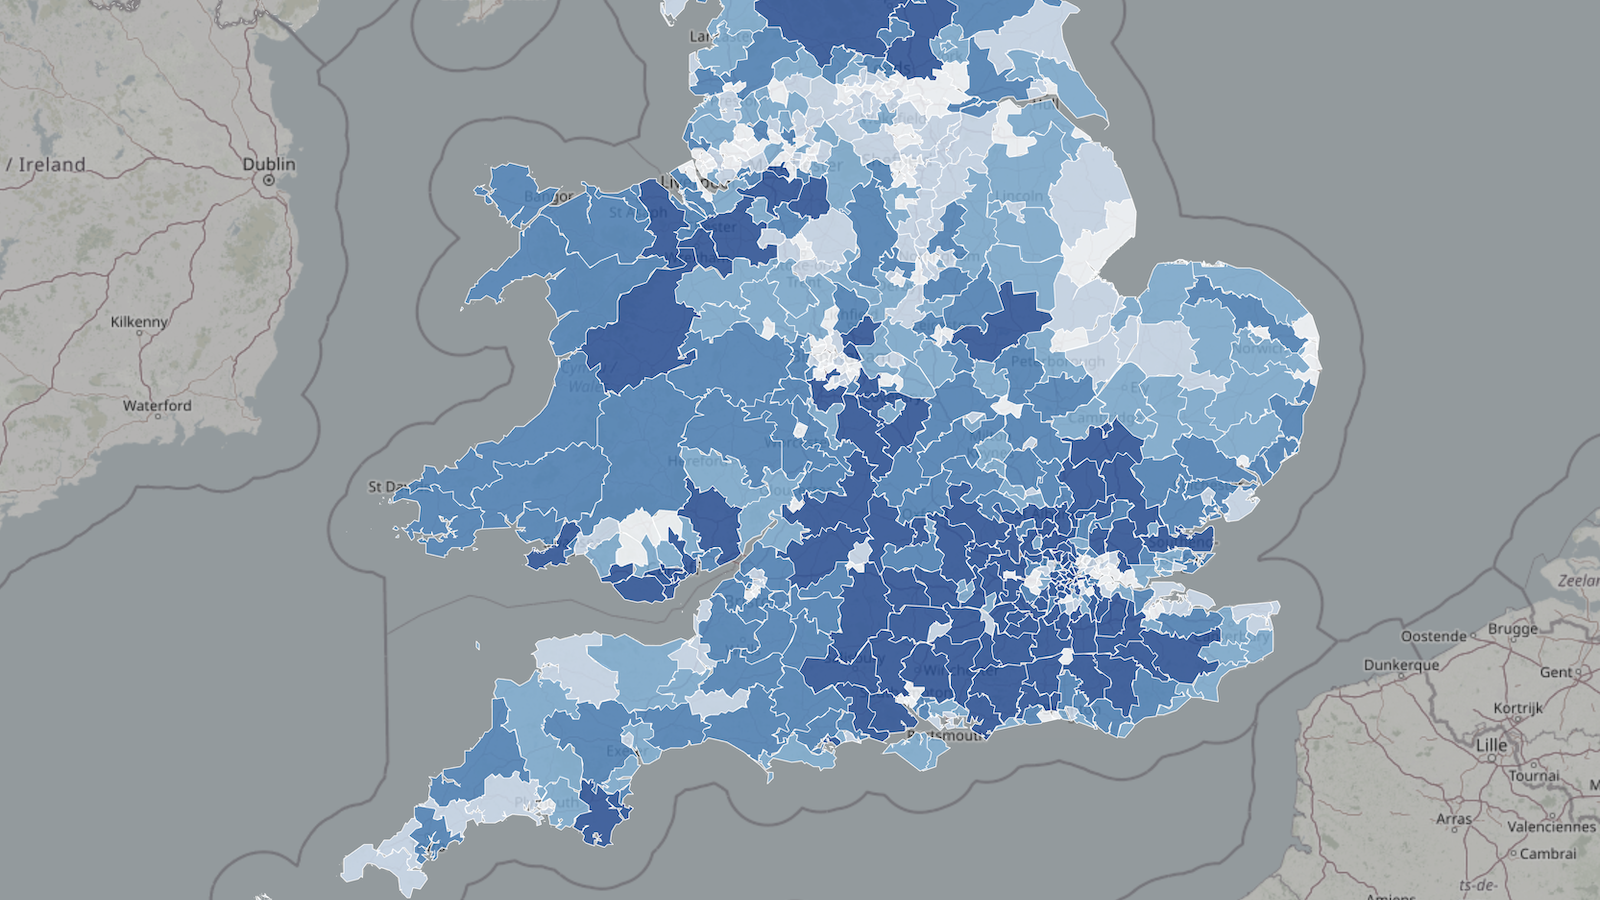
We’ve modelled the impact of the English “mansion tax by analysing land registry data on every property transaction since 1995. This lets us estimate how much each postcode and Parliamentary constituency will pay. It’s an approximate and lower-bound estimate – see methodology details below. As property taxes are devolved, there’s currently no mansion tax in Wales and Scotland – although I rather expect there will be soon.

This interactive map shows the results of our model, marking every postcode that contains “mansion tax” properties. It also shows English and Welsh data on the current council tax bands, median house prices, and the changes in house prices since 1995 (which demonstrate quite how out of date council tax is):

You can view the map fullscreen here. It’s important to stress that this is only showing postcodes – the markers on the map are at the centre of the postcode and do not represent individual properties.

This chart shows our estimate of the revenue from the mansion tax for each constituency. You’ll be unsurprised to see that most affected properties are in London (you can move the mouse over individual constituencies to see full details).

My view is that the tax is good policy. There will be inefficiencies and unfairnesses, as with all taxes, but the basic concept is right: ending the anomaly that someone in a £10m home pays the same council tax as someone in a £1m home – and only twice the council tax of someone in a £400k home. I wrote more about my views here.

This chart shows how the “mansion tax” makes council tax somewhat more progressive:

Methodology and limitations

Our methodology was straightforward: use the Land Registry price paid database to find every property transaction since 1995 that looks residential, and uprate prices by the change in median house prices in each constituency (whilst also displaying council tax data).

The code for the analysis and webapp is available on our GitHub.

It would be technically straightforward for our analysis and map to show the estimated value and mansion tax for individual properties, but we were uncomfortable with the privacy implications (although there are many property price websites that let you see “price paid” data for specific properties). We therefore limit the map to postcodes (which has the side benefit of making the app load and respond much faster).

Our very simple approach has obvious limitations:

  • The open Land Registry data doesn’t include title numbers or other identifiers for properties. So we have to “de-duplicate” repeated transactions in the same property, so we only count the most recent. This is error-prone and we err on the side of conservatism – we’ll therefore be missing some properties.
  • The open Land Registry data also doesn’t differentiate between residential and commercial. We use the “Property Type” field which says whether a property is detached, semi-detached, terraced, flat/maisonette or “other”. In principle, “other” should be commercial property and the other types should be residential – but there will be numerous cases where this isn’t so. For example a farmhouse sold with the farm may be classified as “detached” and so caught in our data as if the full price related to the house, when realistically it won’t.
  • Inflation is higher in some areas within a constituency than others
  • We can’t take account of improvements etc to properties, conversions (e.g. where a property is split into flats), and any other changes after a sale.
  • Our approach completely ignores properties that haven’t been sold since 1995.
  • In some cases (particularly high value property) the price is hidden, or too low.
  • Portfolio transactions are another problem – e.g. where multiple low value properties are acquired for a large £2m+ price, but no separate price is registered for each property. In that case the land registry sees each property as a £2m+ sale, and we end up with multiple false identification of “mansions”. We try to fix this by identifying when there are multiple purchases on the same postcode on the same date for the same price – but this won’t catch all such cases (e.g. where a portfolio transaction spans multiple postcodes). There isn’t an easy way to fix this.

Taken together, our approach is likely generating a lower-bound estimate of the actual static revenue from the tax. The total estimated revenue is £510m.

This is much less than the OBR’s static revenue estimate of £600m – that will be because they used more sophisticated approaches, for example more granular house price inflation corrections, better detection of residential property, inclusion of properties that aren’t in the transaction data. The OBR then adjusts the static estimate to reflect behavioural effects (clustering below thresholds) and losses to other taxes – this brings their total estimated revenue to £400m.

So our figures, and our map, are missing properties and undervaluing properties, and that together amounts to an error of about 20%. We make no attempt to adjust for behavioural effects. So none of the figures we present will be individually accurate, but the overall picture should be an accurate reflection of the constituencies and postcodes from where the “mansion tax” revenues will come.


Contains HM Land Registry data © Crown copyright and database right 2025. This data is licensed under the Open Government Licence v3.0.

Footnotes

  1. Strictly the “high value council tax surcharge” or HVCTS. ↩︎

  2. Unfortunately it’s limited to England and Wales – the Scottish data is separate. ↩︎

  3. Much worse in England than Wales, because England is still on the original 1991 valuations, but Wales revalued council tax in 2003. There was a huge amount of house price inflation in the 1990s. ↩︎

  4. Strictly it’s the address-weighted centre, not the geometric centre. ↩︎

  5. i.e. labelled as detached, semi-detached, terraced or flat/maisonette. Almost all of those are residential. Some of the other category (“Other”) will also be residential, but we’ve no way to screen those using only land registry data – typically one would use a commercial database to cross-check. Government/local authorities can of course use council tax/business rate records. ↩︎

  6. The original version of this article said £400m. We’ve since improved the algorithm; it’s better at removing repeated transactions in the same property (i.e. because we only want to take the most recent). It’s also now using change in median detached house prices per constituency, rather than change in all median house prices. Detached houses are likely a better proxy for change in value of very expensive homes. ↩︎

25 responses to “The mansion tax map: where the money comes from”

  1. Mr G avatar

    Weird feature of the Mansion Tax which no-one has commented on yet: the charge rises with CPI, but the property thresholds don’t seem to.

    Right now the proposal is that if you own a £2m house you pay £2,500/year. But in 5 year’s time, if CPI averages 3% then a house currently worth £1.725m will attract tax of £2,900/year.

    Basically there’s a “double whammy” from inflation if the thresholds don’t change but the tax rises.

    https://www.gov.uk/government/publications/high-value-council-tax-surcharge/high-value-council-tax-surcharge

    1. Dan Neidle avatar

      I’m not sure that’s right because the valuation date is fixed

  2. Richard Skilbeck avatar
    Richard Skilbeck

    Apologies if this is a stupid question. Are the numbers displayed by the map the number of properties estimated to be worth over £2M in that postcode or the number of postcodes containing a property worth over £2m?

    Or, to put it another way, would a postcode containing 15 properties worth over £2M (unrealistic?) be displayed as 1 or 15?

    1. Dan Neidle avatar

      good question! It’s the number of postcodes in that area with a property over £2m. We don’t identify individual properties.

  3. Graham Stanton avatar
    Graham Stanton

    Inefficiencies and unfairnesses is an understatement. I would be fully supportive if it took mortgage debt into account but so far violins have only been reached for when hearing about people who bought decades ago and are now asset rich but cash poor. A far greater unfairness is on someone who might be living in a house currently worth £2m but has a mortgage of £2.5m, or even £1m.

  4. Alex avatar

    Given you’ve included the M&S department store and the Virgin Money bank offices in Harrogate (HG1) as residential; and seem to have an issue distinguishing between actual residential properties and farms (with a house) in North Yorkshire, you may want to revisit the data source for commercial vs residential transactions.

    1. Dan Neidle avatar

      unfortunately the data source is the land registry – as we say in the methodology, this kind of “quick and dirty” analysis just uses the categories in the land registry. If a farmhouse or bank is classified as (eg) a detached house, then this approach marks it as residential. There isn’t an easy way to fix this without either using an expensive commercial database, or access to council tax/business rates data (and ideally both)

  5. Phil Brown avatar

    I presume the chances of this not perpetually being called the “mansion tax” in the popular press is about as great as Inheritance Tax not being called “Death tax” by the Daily Mail.

  6. Nicholas Davis avatar
    Nicholas Davis

    “Homeowners, rather than occupiers, will be liable to the surcharge” (https://www.gov.uk/government/publications/high-value-council-tax-surcharge/high-value-council-tax-surcharge).

    I wonder whether that means freeholders be liable to the surcharge.

  7. jon avatar

    Big thing missing here is that if say one house in a street of similar houses has sold for lets say £3,000,000 its likely all the other houses in the immediate area are worth the same even if there is no recent transactions in that street, so there are likely many many times more properties above the £2m threshold

    1. Dan Neidle avatar

      that’s right, although our approach should catch those if they sold since 1995 (because we uprate property values). I’m sure HMRC/OBR did something much more sophisticated.

  8. Alex M avatar

    Very interesting. Note that the map does identify individual properties when a property’s postcode is unique to that property. Perhaps surprisingly 3-4% of postcodes are for only one address. For privacy these cases should perhaps be excluded or aggregated in some way?

    1. Dan Neidle avatar

      there are lots of property websites where you can see the estimated value of specific identifiable properties – so we go much further to protect privacy, even in single-property-postcode cases.

  9. James Gallagher avatar
    James Gallagher

    I also have had a look at 12 different areas with which I am familiar (rural villages, Lancashire commuter towns, suburbs of Liverpool & London plus Lincoln City Centre). Eleven areas look reasonable but Lincoln city centre has three properties showing in a pedestrianised shopping precinct. I looked at the council tax banding for all three and found that LN57AP, and LN57HE have no residential properties; LN5 7ET had a few apartments all with a band A classification. I think there may be a glitch capturing high value non-residential properties (Banks, large branches of chain stores etc.)

  10. Kerry Stephens avatar

    Not sure about the technology here as I get different results depending whether I look at the map on my phone or on a desktop. The desktop shows one “mansion” in my current post code and in the one we moved from (next road) but the phone shows 2 and 3 respectively (likely more accurate)

  11. James Mackay avatar

    Many of your readers will spend half an hour, or half the morning, enjoying confirming their impressions of which are the most expensive houses around them: thank you for doing the work, albeit with the caveats of generalisation and data oddities which you explain exist.

    One mild criticism: “inflation is higher in some areas within a constituency than others” is not quite correct: inflation is an increase in the general level of prices, price increases of course vary within any overall ‘basket’ of goods and services and outside London and its region, many of the postcode sample sizes are small, so some estimates may be erratic.

    1. David Campbell avatar
      David Campbell

      “Half an hour or half the morning” made me laugh!

      On the inflation rate, I assumed Dan meant specifically the rate of *house price* inflation in particular areas, eg house prices in Kensington may have gone up more since 1991 than those in Twickenham.

  12. Gareth Morgan avatar

    What’s happened to Wales?

    1. Kevin Meaney avatar

      Agreed, no data showing for Wales. Yet the image at the top includes information for Wales.

      1. Dan Neidle avatar

        there’s no mansion tax in Wales!

        1. Nick Simmons avatar

          I could read that two ways – no mansions in Wales or simply no tax on mansions in Wales. I assume it is the latter – is that because they are devolved or something to do with the make up of political landscape in Wales? What about Scotland? And would it be possible to get a carve out for my postcode as well please?!

        2. Chris Callander avatar
          Chris Callander

          Thanks for this. I hadn’t been able to find any such definitive statement in the general U.K. media or in online resources. It would be helpful if the article made clear this is an England-only issue rather than repeatedly mention England and Wales. Thanks again for all your posts.

  13. Kerrin Morgan avatar

    Great visualizations of the areas most affected. This should help with my heated disscussions about tax policy with my family! Thank you.

  14. Tigs avatar

    Lovely! Government data should be free and I am glad the Land Registry released it into the wild a long time ago. Perhaps you can persuade other government departments to release more data without silly licences (looking at you RoS) or more data (why can’t HMRC publish more data on taxpayers that does not allow identification of individuals).

    I had a play around me and looked at some areas I know (using the actual address rather than the postcode). I looked at all 12 properties in a regional city centre. None would appear to actually be in scope. Some seem to be blocks of flats, others include: an office building for conversion into a block of flats, a Burger King restaurant, a convenience store, a lovely house that is now an office, a house that is now (per mark one eye ball with google maps) at least 4 different houses. And the last one is a house that still seems to be a house! It sold for £2.1m seven years ago but it looks to be no different to the neighbouring properties in the terrace that have sold for between £163,000 and £286,000 in the four years before / four years after. Hopefully this typo was spotted before SDLT was paid on it.

Leave a Reply

Your email address will not be published. Required fields are marked *