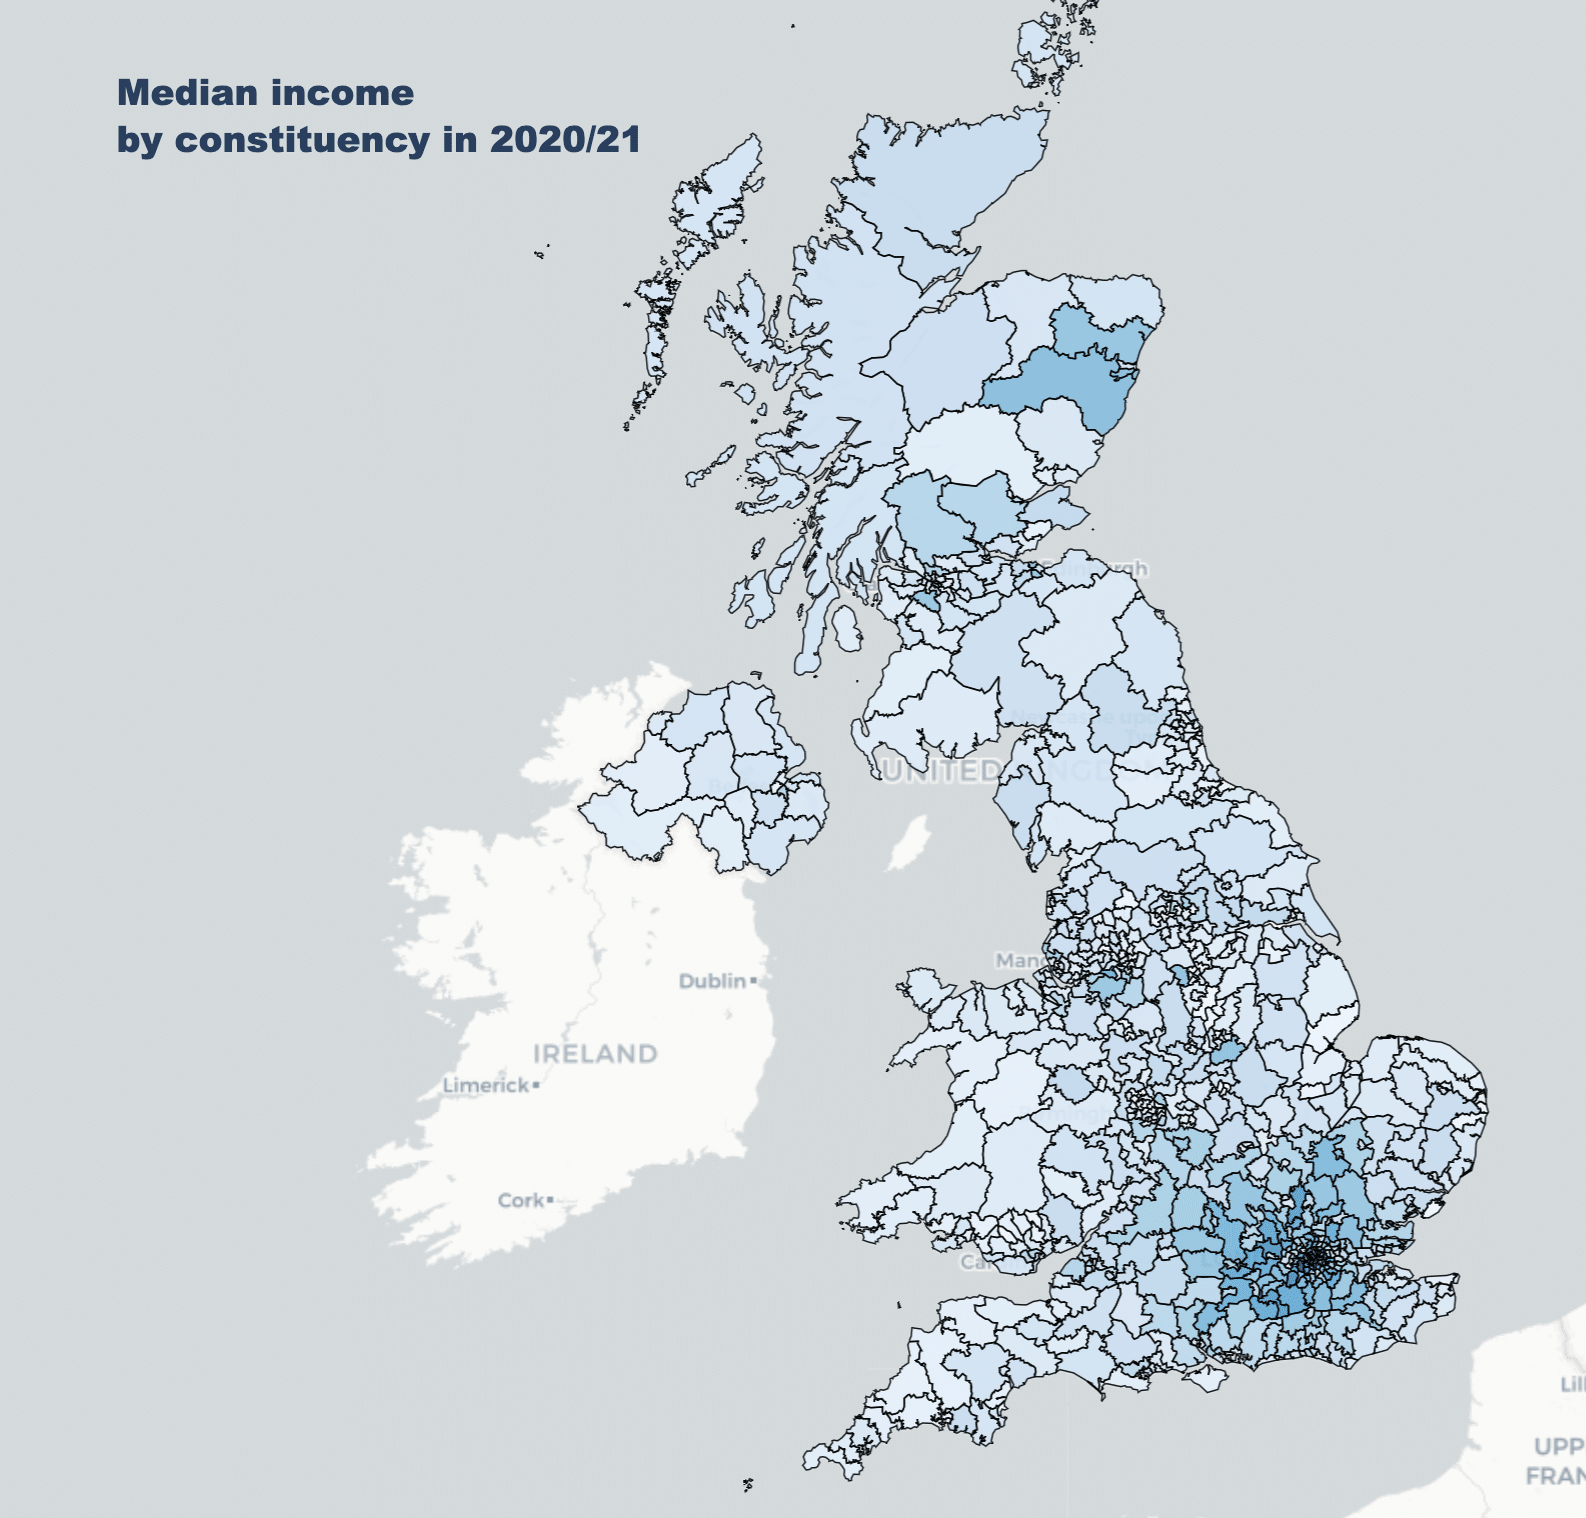
Here’s an interactive map showing incomes in each parliamentary constituency in 2020/21, shaded by median incomes. You should be able to zoom around with your mouse/fingers, and if you hover/touch a constituency you’ll see the full data, broken down by employment income, self-employment income and total income tax paid:
You can see a full-screen version here, and the source code is here.
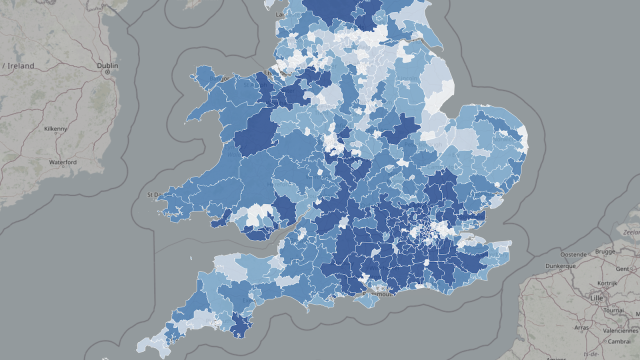
If we shade by mean income, instead of median, the map turns entirely white (and you have to zoom into central London to see any colour). Which tells us something about income inequality:
There are some big caveats here. It’s data from income tax only, so won’t include capital gains. The sample size per constituency is small, so the accuracy won’t be great. Both these reasons mean that very high earnings likely won’t be captured.
The income tax data comes from here.
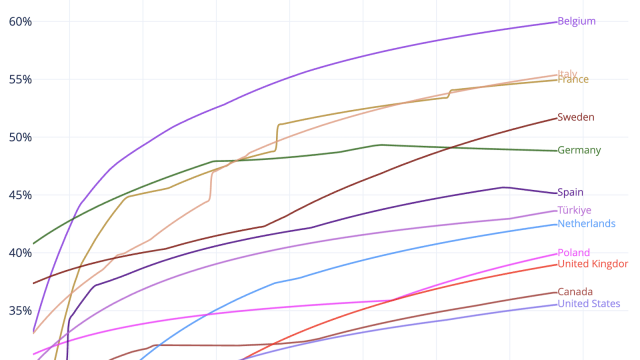
Are UK workers over-taxed? The answer in four infographics

The Scottish Budget – four thoughts on a tiny tax cut
The mansion tax map: where the money comes from
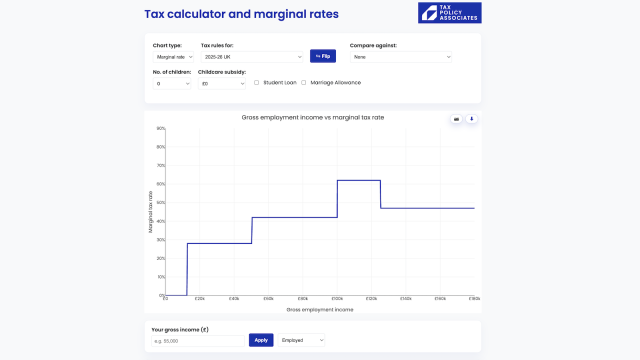
The Budget 2025 tax calculator
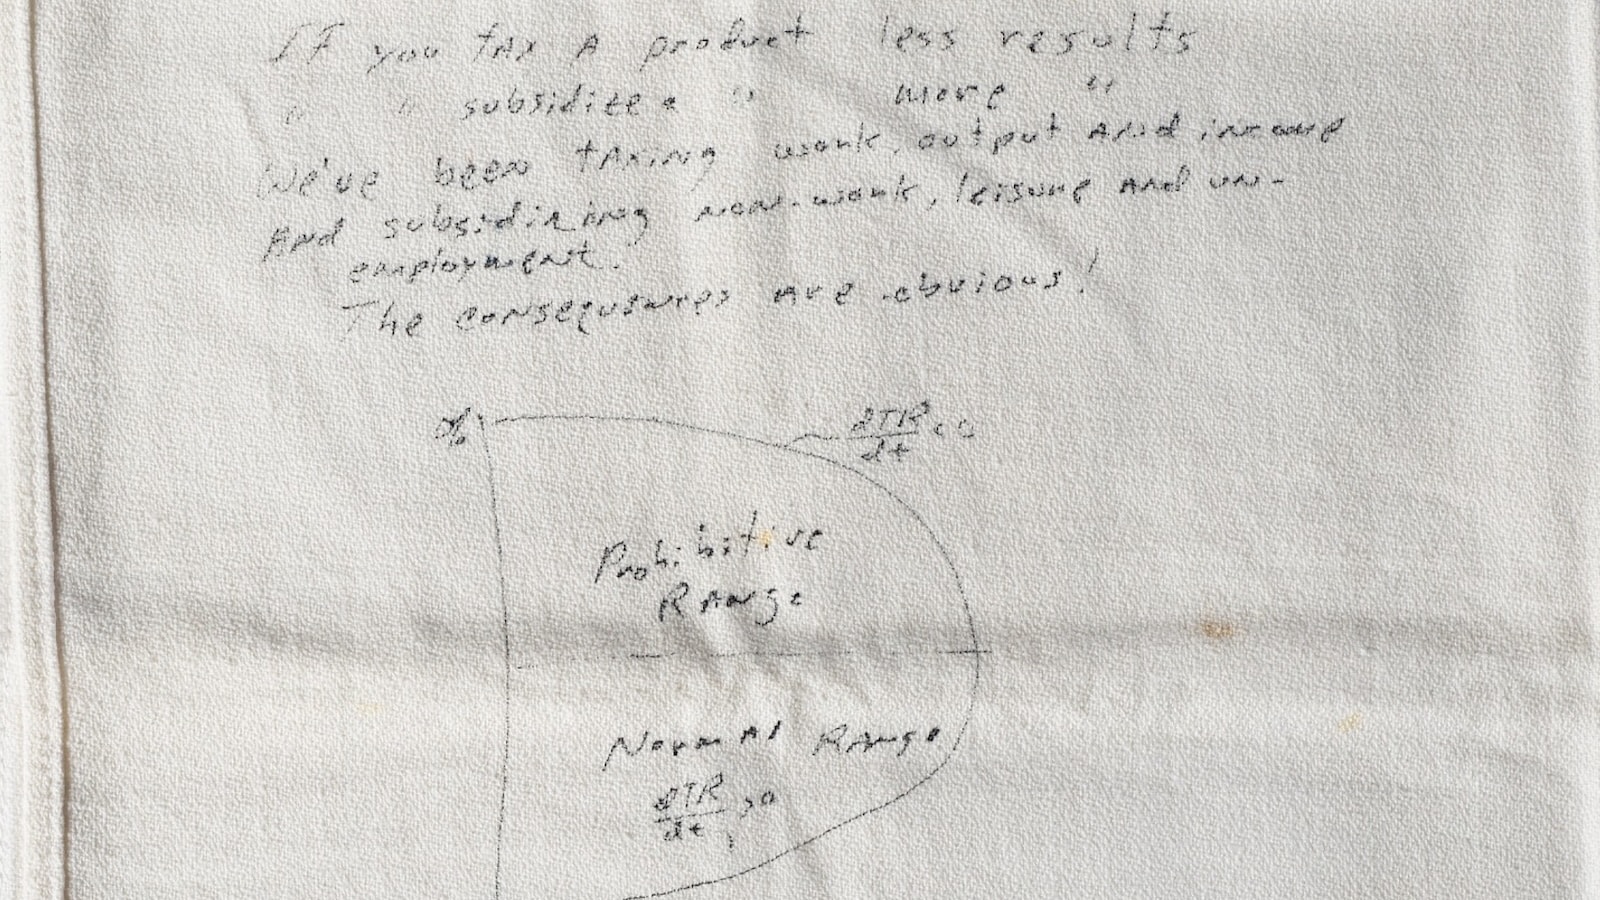
Untaxing – The Laffer curve, and the napkin that changed the world
Leave a Reply