Toggle navigation
All reports
Policy
Analysis
Investigations
About
Contact
×
Subscribe
×
Stay informed
Get new reports by email
Free to sign up. No spam or advertising. Cancel anytime.
Name (optional)
Email
Subscribe
Leave this field empty
Home
›
Infographics
Posts in "Infographics"
All reports
Policy
Analysis
Investigations
Budget
Corporation Tax
VAT
Income Tax
Property Tax
Inheritance Tax
National Insurance
Tax Avoidance
Fraud
SLAPP
Companies House
Infographics
Marginal Rates
Wealth Tax
Council Tax
SDLT
Stamp Duty
DOTAS
Show all +
Hide all –
Toggle search
Aug 23, 2025
Infographics • Policy
Council tax on expensive homes: could the Budget raise £1bn+?
The Government needs money. Council tax is regressive – high-value properties pay a trifling sum in comparison with their value. It must be tempting for Rachel Reeves to solve both problems in one go by raising council tax on high-value properties. We’ve created an interactive calculator that shows how this could be done, and how […]
Sep 24, 2024
Analysis • Infographics
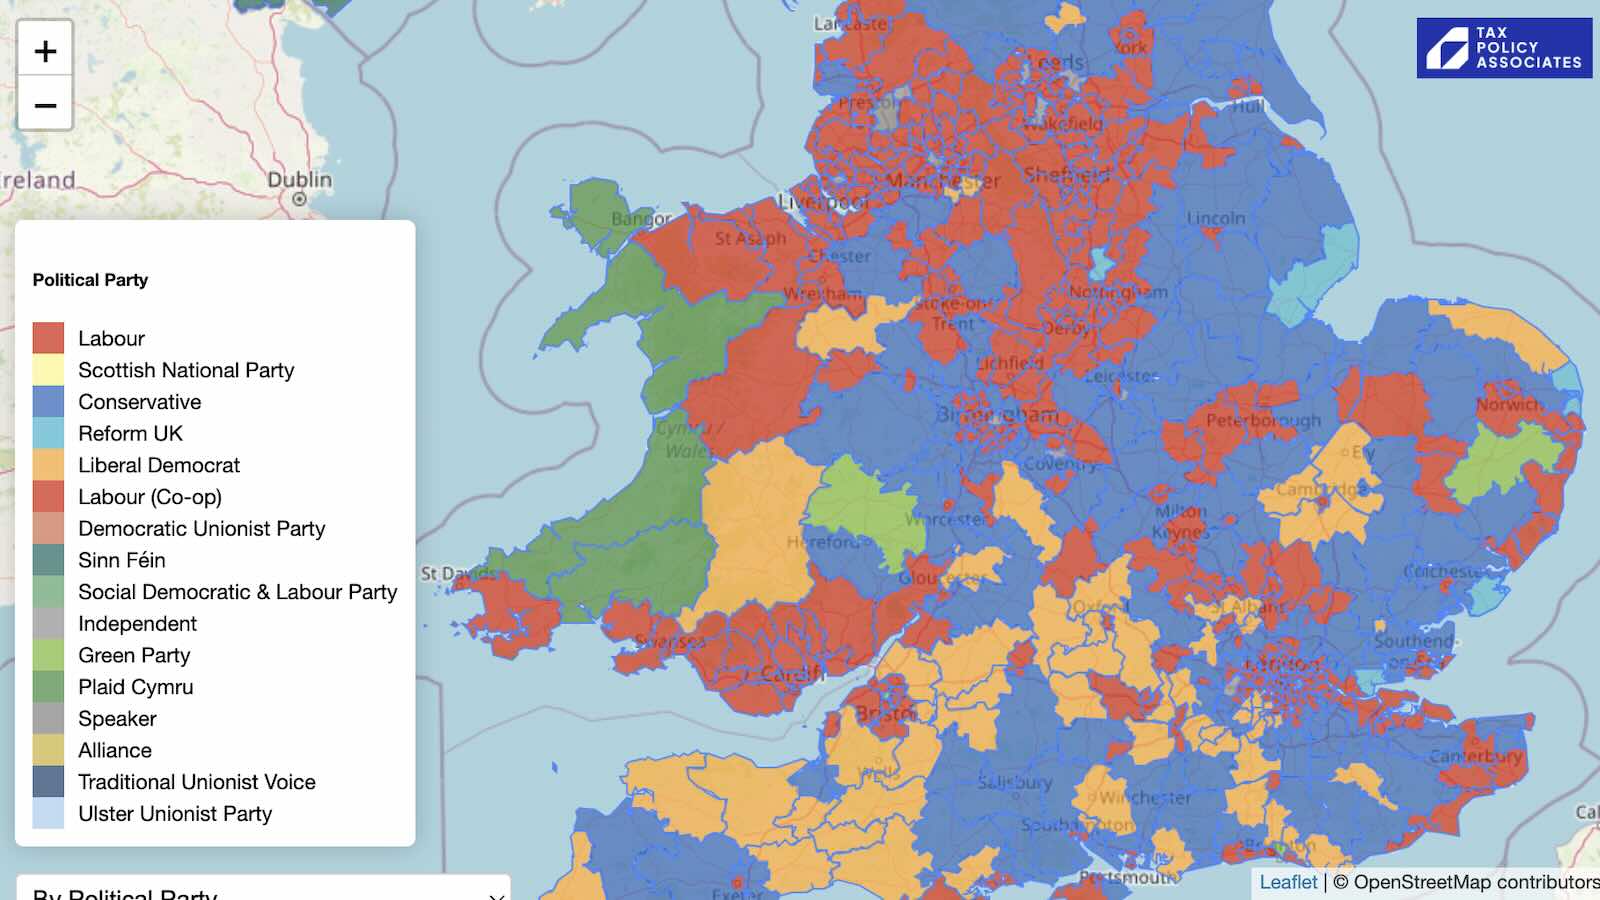
Map of MPs’ donors and interests
Which MP is the highest earner? Who receives the highest donations? Who takes the most foreign trips? We’ve just launched an interactive map that lets you explore all this and more. Apologies – this is currently down… the map needs to be updated. We hope to get to this soon. There’s an important political debate […]
Sep 22, 2024
Infographics
The state of play of open corporate data
Our proposal to end offshore secrecy, and move the world towards open registers, is here. But right now, the world looks like this: The interactive chart above shows how open each country’s corporate registry is. All thanks to data from opencorporates.com, and you can click on a country to go to the individual assessment. Full […]
Mar 10, 2024
Infographics
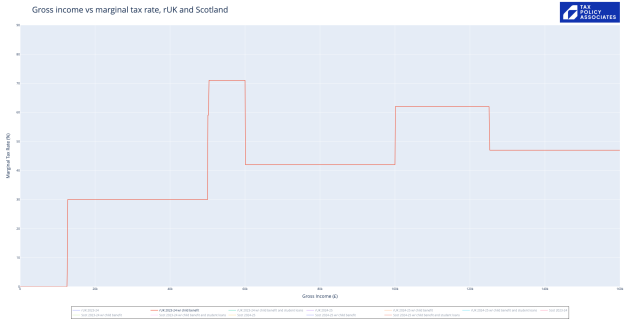
Interactive marginal tax rate chart – June 2024
This interactive chart lets you see the current rUK and Scottish marginal tax rates for 2023/24 and 2024/25, with/without child benefit and student loans. You can turn on/off different years and options by clicking on the legend below the chart. Some of these charts won’t work well on mobile; you can see static versions here. […]
Jan 25, 2024
Infographics
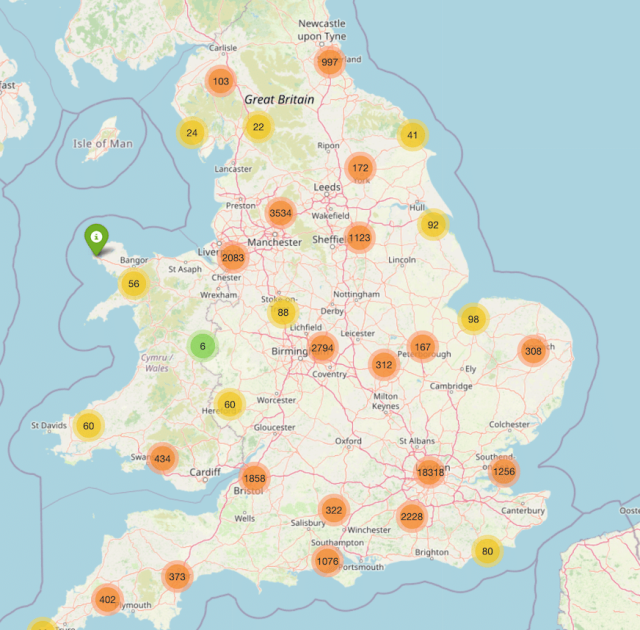
Interactive map of all foreign entities holding English/Welsh real estate (v2)
Since the start of 2023, all overseas entities have had to be registered with the land registry and on Companies House – the “register of overseas entities“. We’ve created a interactive map that lets you see all property held by foreign entities. It’s very large (about 93MB), so people with slow or expensive connections may […]
Sep 25, 2023
Infographics
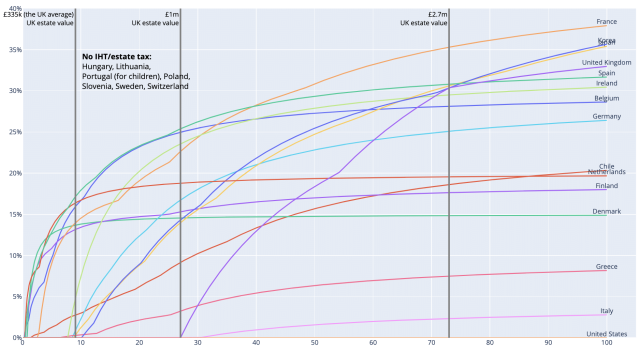
Comparison of OECD inheritance taxes
Jun 20, 2023
Infographics
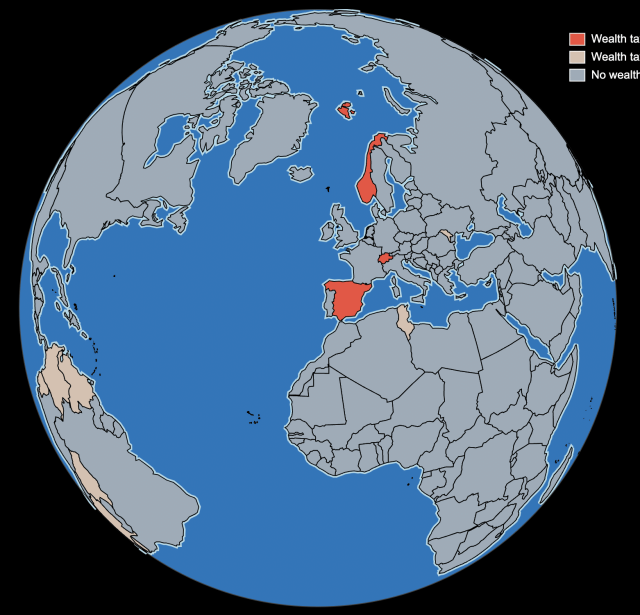
Global wealth taxes at June 2023
Jun 20, 2023
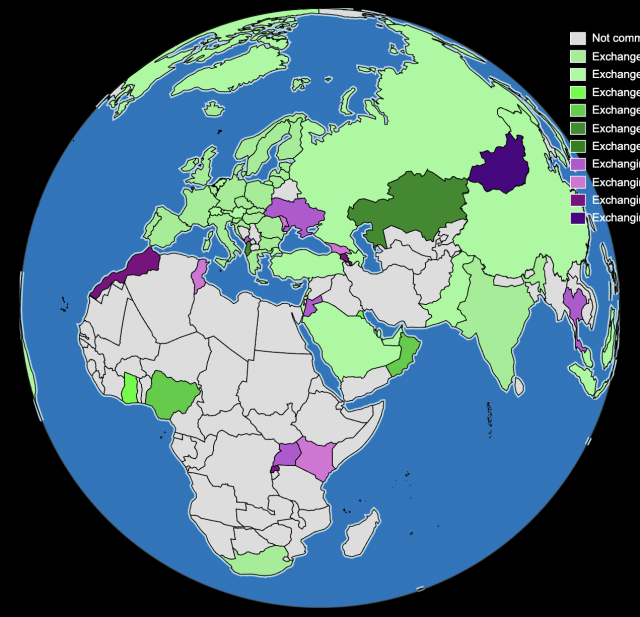
Infographics
CRS implementation as at June 2023
Jun 19, 2023
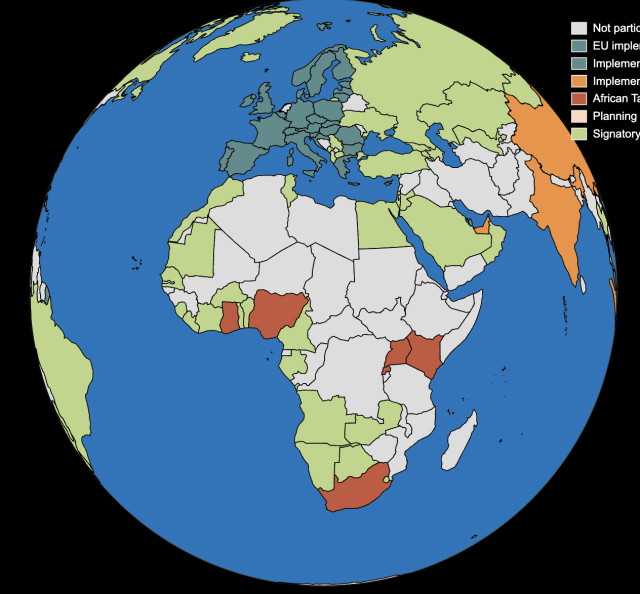
Infographics
Pillar Two implementation as at June 2023
Load more
Stay informed
Get new reports by email
Free to sign up. No spam or advertising. Cancel anytime.
Name (optional)
Email
Subscribe
Leave this field empty