How does the UK1excluding Scotland – that’s very similar but a bit higher… although Scotland’s actual freedom of manoeuvre here is very limitedtax on employment income compare with other countries? It’s a simple question – but not straightforward to answer2This is an update of previous posts with updated data, better code, and more footnotes.
One way is to look at different tax rates. But the rates alone are misleading. The biggest missing element is: when do the rates apply? The 37% top rate of Federal income tax in the US kicks in at $523,600. The top UK rate – now again 45% – applies from £150k. So saying the UK rate is just a bit higher than the US rate misses the most important question: how much tax do people actually pay? What is the effective tax rate on any given income?
So I wrote some simple code3based on data from the wonderful OECD tax database, updated for the Budget changes and the return of the 45p top rate to calculate and chart the effective rate4The effective rate is total tax paid divided by total gross income. Not to be confused with the marginal rate – the tax rate on the next £ you earn of tax. on an employee5The calculation realistically has to include employer national insurance and social security. Yes, it’s paid by the employer, and isn’t visible on our wage slip, but evidence suggests it is mostly borne by workers (i.e. because the employer has an amount they’re willing/able to pay as wages, and employer NICs come out of that). – or the “tax wedge” for different multiples of the average wage in each country6i.e. because realistically you don’t compare taxes on £100k in the UK with £100k in Costa Rica; you should compare taxes on three times the average wage in the UK with three times the average wage in Costa Rica. The OECD adopts a consistent methodology for calculating average wages using national accounts, but a limitation of this approach is that it results in the mean not the median wage. For most purpose this is much less useful, but for this purpose it remains a useful way to meaningfully compare tax rates across different economies… as ever, I’m open to other suggestions. See my previous post introducing this approach for more detail and a complete list of caveats and limitations. The updated code is here.
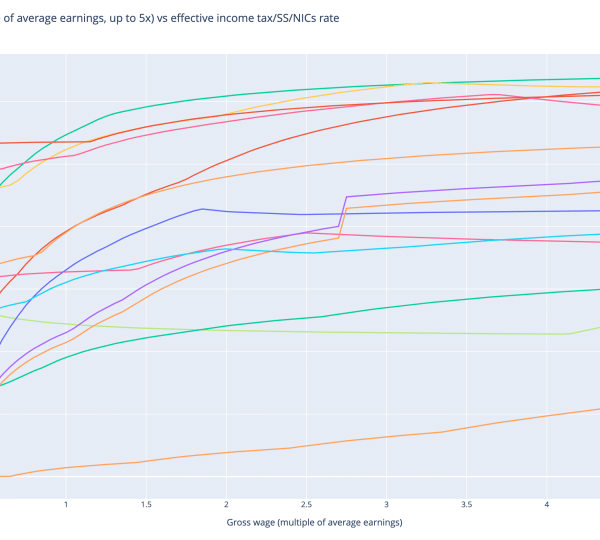
Here’s the chart comparing UK tax (before and after the mini-budget) with the rest of the OECD, looking at incomes going up to 5x average wage. For context: the average (mean) UK wage is about £37k7Yes, that is a lot higher than the usual figures we see because, as above, it’s the median not the mean, and it’s the average wage not average income, so the top end of this chart goes to a touch under £200k.
Click the chart8I crashed WordPress trying to embed this. Any better suggestions would be appreciated! for an interactive version that lets you select/deselect different countries (which prevents it becoming unreadable):

The generous UK personal allowance means that a Brit on an average income pays less income tax/national insurance than most anyone in the developed world. The basic rate and national insurance9Including employer national insurance – for which see the footnote above… we may not recognise it, but it’s nevertheless tax that employees bear economically however are high enough to accelerate our rate towards other countries. The introduction of the higher rate is hard to spot on the chart, because it is (more or less) accompanied by a reduction in national insurance (and these figures don’t model child benefit or other features that can create horrible marginal rates in the UK around the £60k point). Things do kick off at the 2.7x point/£100k, as the phase-out of the personal allowance escalates the effective rate.
What if we look at tax on higher incomes? Let’s go up to 20x average wages, so about £500k in the UK. Again, click the chart for an interactive version:

All in all, the UK has a rather average level of tax on high earners, compared with the rest of the OECD. And for employees the rate caps out at just over 50% once we take employer’s national insurance into account (as we should).
Does anyone actually pay these really high rates?
Usually, the only high earners who pay these rates are employees. For others, the rates are often much less. In the UK the rates drop to 47% (partners in partnerships10Yes, I avoided tax for years, but in my defence it’s just the way partnerships have always worked), 45% (rent), 38.1% (dividends), 28% (capital gains on real estate) or 20% (capital gains on securities). And the evidence is that really higher earners tend to be in these categories (or can plan their way into these categories).
Employment tends to be heavily taxed because it’s so easy to do. Those poor, poor bankers get all the flak, but pay a lot of tax. Their private equity cousins pay about half as much. And the same’s true almost everywhere… call me cynical, but I’m doubtful there are many Austrian millionaires actually paying a 68% effective rate.
So if, as a political or economic matter, we want to increase taxation on high earners, I’d suggest that the focus shouldn’t be on changes that increase the 50% rate (which already looks high) – better to focus on the others.
Can it really be true that the UK taxes average income significantly less than most other countries?
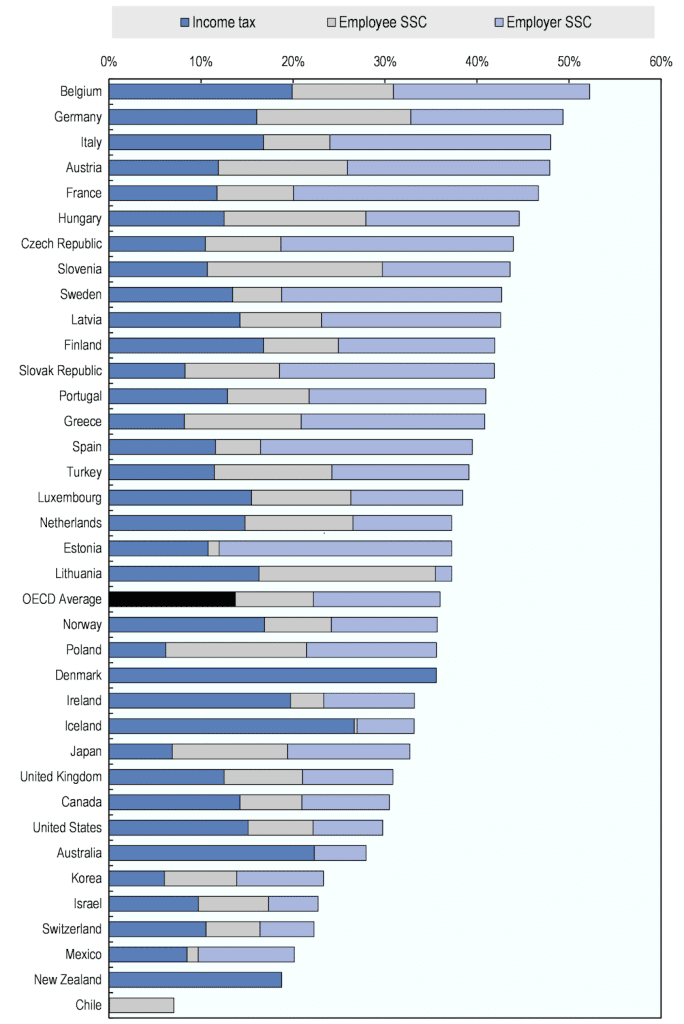
It’s something almost nobody believes – but it’s nevertheless true. If you don’t believe my chart, here’s the OECD comparison for average incomes:

It shouldn’t be a surprise that the countries with more extensive welfare states than the UK have higher rates of tax on the average worker. By contrast, some of them tax higher earners more; some don’t. The thing is, whilst the level of tax on the rich is of huge political significance, it is not very significant to the public finances. The 45p rate which the Tories abolished-then-didn’t raises £2bn. Income tax as a whole raises £228bn. NHS spending is £136bn.
If we want a Scandinavian level of public services, then most people have to pay similar levels of tax to most people in Scandinavia. Sorry about that.
- 1excluding Scotland – that’s very similar but a bit higher… although Scotland’s actual freedom of manoeuvre here is very limited
- 2This is an update of previous posts with updated data, better code, and more footnotes
- 3based on data from the wonderful OECD tax database, updated for the Budget changes and the return of the 45p top rate
- 4The effective rate is total tax paid divided by total gross income. Not to be confused with the marginal rate – the tax rate on the next £ you earn
- 5The calculation realistically has to include employer national insurance and social security. Yes, it’s paid by the employer, and isn’t visible on our wage slip, but evidence suggests it is mostly borne by workers (i.e. because the employer has an amount they’re willing/able to pay as wages, and employer NICs come out of that).
- 6i.e. because realistically you don’t compare taxes on £100k in the UK with £100k in Costa Rica; you should compare taxes on three times the average wage in the UK with three times the average wage in Costa Rica. The OECD adopts a consistent methodology for calculating average wages using national accounts, but a limitation of this approach is that it results in the mean not the median wage. For most purpose this is much less useful, but for this purpose it remains a useful way to meaningfully compare tax rates across different economies… as ever, I’m open to other suggestions
- 7Yes, that is a lot higher than the usual figures we see because, as above, it’s the median not the mean, and it’s the average wage not average income
- 8I crashed WordPress trying to embed this. Any better suggestions would be appreciated!
- 9Including employer national insurance – for which see the footnote above… we may not recognise it, but it’s nevertheless tax that employees bear economically
- 10Yes, I avoided tax for years, but in my defence it’s just the way partnerships have always worked


4 responses to “In which country do employees pay the highest tax on their income? Is it the UK?”
Dan, do these numbers include local income taxes? Some ostensibly low taxed countries can have high local taxes e.g. USA, Switzerland.
They include average local income taxes for each country – that of course means that they aren’t showing the extremes (at either end) within Switzerland or the US.
Interesting analysis.
Five suggestions:
0) A bit of commentary on those nations with high but dropping tax slices like Italy and Luxembourg.
1) Making a set charts using the median incomes (already on your list)
2) Ability to see what the £$€ amounts are in the pops showing the rates along each curve
3) For the US, add population weighted averages rates springing from state and local income taxes
4) Extending the look at US peculiarities, split the US into three lines: as above, no income tax rates, and an aggregate across three high tax states — probably California, New York, and New Jersey.
That is a lot of homework!