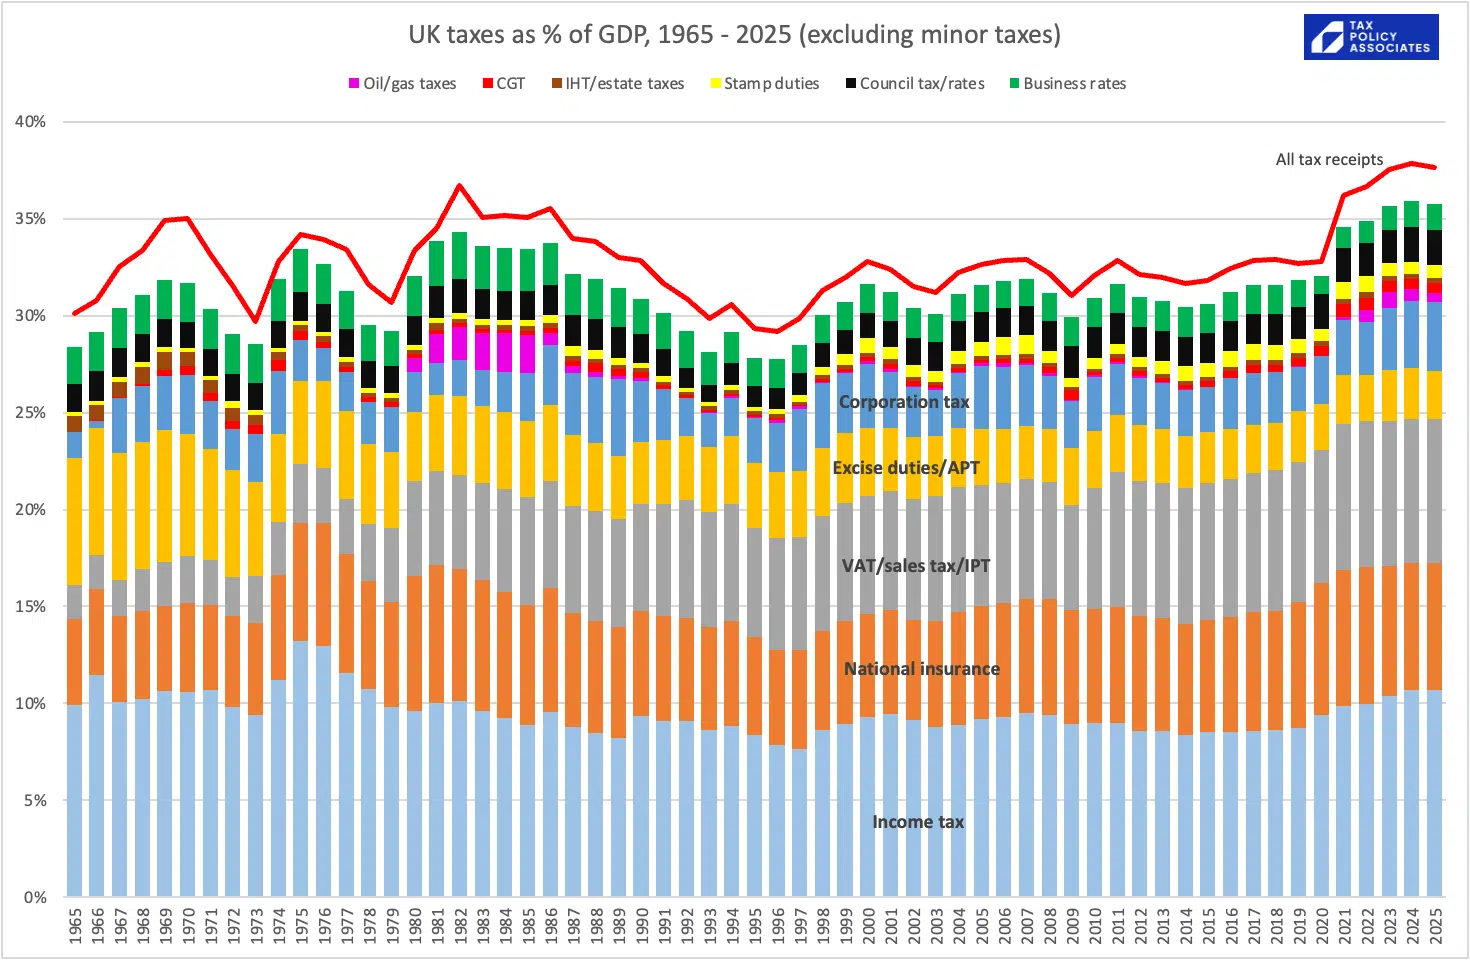
There’s a tax paradox in the UK. Overall, we’re paying more tax as a percentage of GDP than at any time since the 1940s – and most people believe they’re over-taxed.12 Yet, at the same time, the average UK worker paid less tax on their wages in 2024 than any year since the War, and less tax than their counterparts in any other large European country.
How can this be?
This is the first part of a series on the tax mess that the UK is in… and what we can do about it.
How can we fairly compare taxes on wages?
Comparing like-for-like across different countries is not straightforward – wage structures and tax and benefit systems are all very different. Fortunately, the OECD has done all the hard yards, with decades of work analysing the “tax wedge” – the proportion of labour cost paid in tax for the average worker. This includes income tax, and both employee and employer national insurance/social security.3 It also includes cash transfers (which can be viewed as negative tax) – for the average UK worker that means child benefit.
We can use the OECD’s most recent data to chart the tax wedge for every country in the OECD, looking at the average wage of a single worker, a single-earner family4 with two children, and a dual-earner family with two children.5.
The chart shows all four datapoints for each country. It’s interactive, so you can click on a point and see the precise numbers, and reorder the chart using the dropdown box at the bottom right. On mobile you’ll need to view in landscape mode. There’s a full screen version here.
The result is striking – the UK has one of the lowest tax wedges in the OECD for single workers and dual-earner families, but a comparatively higher tax wedge for single earner families (but still lower than average). The reason is simple: in many countries (like France) the family is taxed as a unit, meaning that the single wage is split between either the parents or the entire family, therefore bringing the earnings into lower tax brackets. In the UK this doesn’t happen, and there is only a small tax benefit for married couples.
Here’s how the picture changes if we look at different income levels.
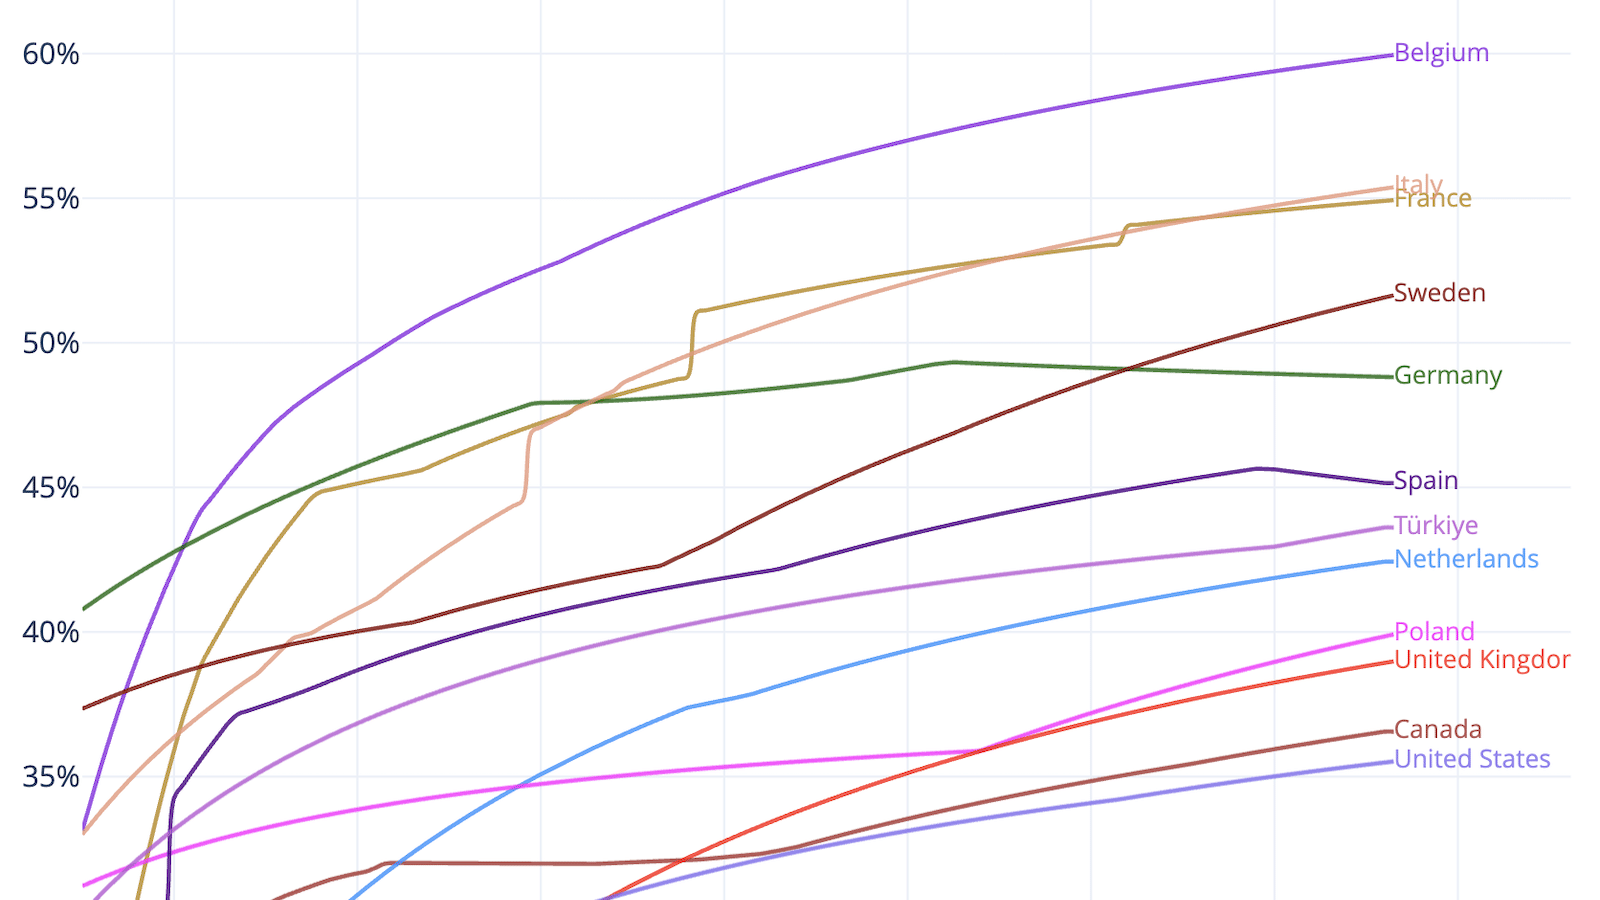
This interactive chart plots tax wedge against % of average income for the ten largest European OECD members, plus the US and Canada. You can change the taxpayer type with the dropdown at the top right, and add/remove countries by clicking on the legend on the right hand side. Again, on mobile you’ll need to view in landscape mode. There’s a full screen version here.
The 50% to 250% x-axis covers incomes up to roughly £130,000 in UK terms. (Why is the “average” £50k? See the methodology below!)
Some thoughts:
- Single workers: At every wage level the UK tax wedge sits well below that of all the other 10 largest European economies.
- With kids, the picture shifts: Poland becomes much lower tax than the UK, at all levels.6 Perhaps unexpectedly, the Netherlands edges below the UK.
- Higher earners with kids: from about 150 % of average income, Germans with kids also pay less tax than their UK counterparts.7
- A UK single worker on the average wage pays less tax than their Canada and the US counterparts, but more once we reach about 120% of average wage (£60k). Marriage immediately lowers the US rates. Children take the US and Canada rates well below the UK’s.
The simple story is that, at all points, French, Italian, Scandinavian, Spanish etc workers pay around 50% more tax on their wages than a comparable earner in the UK. For other countries things are more nuanced, with some surprising countries (Germany!) becoming lower tax than the UK once kids are in the picture.
How did the UK’s tax wedge change over time?
Here’s the data from 1979 to 2024, and my estimate for 2025:
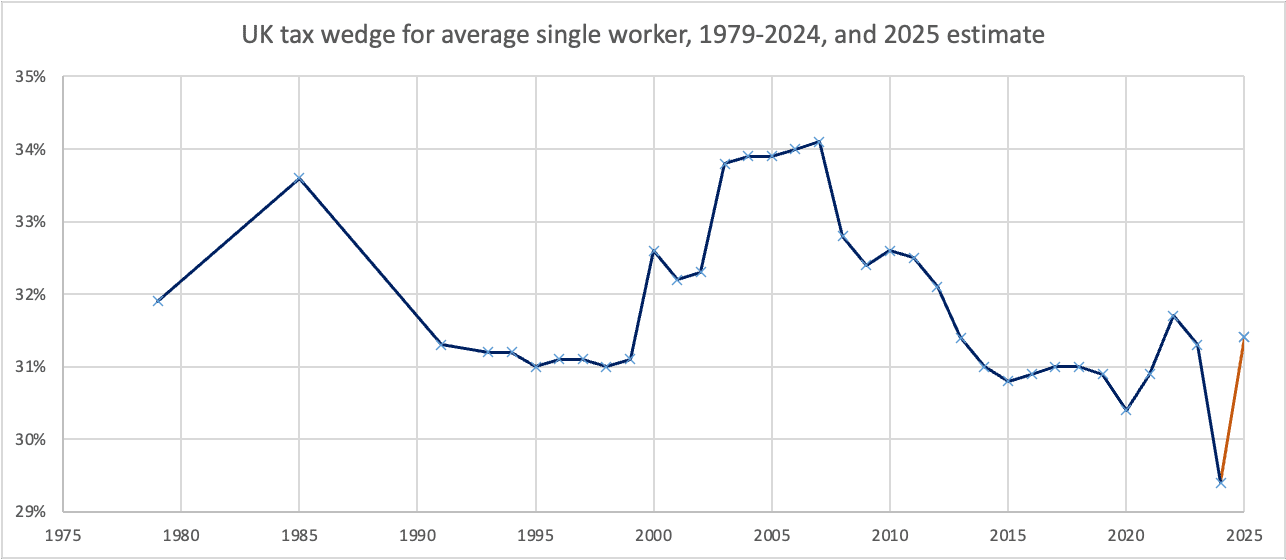
The degree of change here should not be exaggerated – peak to trough represents about £1,500 for a median earner (in today’s money), and the 2024-to-2025 change about half that.8
The recent bump downwards in 2024 was caused by Jeremy Hunt’s cut in employee national insurance, which took tax wedge from 31.3% to 29.4%. The tick up to 31.4% in 2025 is thanks to the rise in employer national insurance in the October 2024 Budget.
Unfortunately the OECD tax wedge data in its modern form only starts in 1979, but the higher rates of income tax (30% to 45%) and lower personal allowance (never more than half the current level, in today’s money) mean we can be reasonably confident that the tax wedge on the average single worker was higher in previous decades.9
How progressive is the UK tax system compared to other countries?
John Burn-Murdoch in the FT has written about how the UK tax system is surprisingly progressive compared to other countries.
We can draw a simple bar chart showing how the tax “wedge” on people earning 50% of average income compares to people earning 250% of average income:
My feeling is that the charts probably overstate the tax wedge on higher incomes in many countries. I’ve previously written about how the UK’s high statutory rates of income tax in the 1970s were not in fact paid by well-advised people on high incomes – there were many tricks that could be played to reduce the rate. In the main, these tricks no longer work in the UK. Someone on high income wanting to pay less tax has relatively few options – pension contributions (subject to a cap), venture capital trusts and similar investment reliefs, and that’s about it. In France (for example) the use of tax-advantaged “insurance vie” investment wrappers is common for high earners. Incorporation is often used to avoid the very high social security (in the UK the lower national insurance means the benefit is less, and rules like IR35 make the saving harder to achieve).
What does it all mean?
My conclusions:
- Most people in the UK on low, moderate or reasonably high earnings (i.e. up to about £100k) pay less tax on their wages than their counterparts in other large developed countries, with the notable exception of the US.
- 2024 set a post-war record: the average UK worker paid less wage tax than at any time since the 1940s. 2025 nudged upward – back to roughly 1990s levels, which were already the lowest in the modern era.
But we started with:
- The UK is paying more tax as a percentage of GDP than at any time since the 1940s, and most people think they pay too much tax.
How can all these things be true at the same time?
I’ll write about that soon.10
Methodology and limitations
All of this is based on the OECD tax wedge data:
- The source for the UK 1979-1999 numbers is this 1999 OECD report.
- The source for the 2000-2024 numbers recent numbers is the excellent OECD data explorer. You can see the exact data for this chart here⚠️ (but make sure you download a CSV rather than Excel file, or some of the data will be cut off).
- The estimate for the UK tax wedge in 2025 is our simple approximation based on the OECD 2024 average wage data, ONS data on the rise in average earnings, and tax changes in 2025/26.
There’s an excellent paper explaining the tax wedge, and its uses and limitations, here.
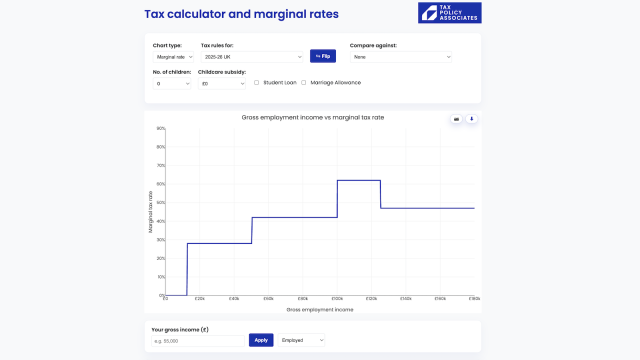
Note that the tax wedge is very different from the marginal rate. The “tax wedge” tells you how much of your overall wage packet goes on tax. The “marginal rate” tells you how much of the next pound you earn goes on tax.11The marginal rate is critically important because it affects incentives – and the UK income tax system has unfortunately created a horrible mess of marginal rates. I wrote about that here.
An important point of detail is that “average worker” doesn’t mean “median worker” (and I misunderstood this myself until recently, for which my apologies). The “average worker” is a concept the OECD defines so that it can make a like-for-like comparison across different countries. So instead of the usual approach of taking the median of all full-time employment, it covers a specific mix of sectors, job-types and seniority levels, which are applied in the same way to each country. In the UK that means the OECD “average” wage is considerably higher than the median wage – £51,310 in 2024 rather than £37,340, and therefore the tax wedge for the median worker will be lower than the figures shown here (about 28% for 2024 instead of 29.4%).12
These kinds of international comparisons can only ever tell part of the story. A few caveats:
- The charts don’t include VAT. You can see the complete picture here – OECD countries tend to have similar levels of VAT, with the big exception of the US. Most US States have a sales tax, but it’s typically less than 8% and applies to a narrower range of goods and services than VAT. So whilst the charts above show the UK worker as comparably taxed to their US equivalent, once VAT is taken into account we can be confident the UK worker is more highly taxed. But VAT won’t change the picture much when we compare the UK against other OECD countries.
- On the other hand, a US worker may pay less tax, but has to pay for healthcare (either directly or via insurance from their employer, which in the long run is paid by employees in the form of lower wages). In an ideal world this would be built into the data, but that’s far from straightforward. You can compare private healthcare spending here.
- The charts also don’t include annual property taxes. In the UK that’s council tax. In many parts of the world, including most US states, it’s an annual levy on the value of property. Council tax is rather low in international terms for people living in high-value property, and rather high in international terms for people living in low-value property.
- There are other smaller differences – for example in Germany you have to pay for your bins to be collected by the local authority.
And finally one obvious point: tax doesn’t usually just go up in smoke – countries with higher tax will (all things being equal) have better funded welfare systems and public services. Whether you’d prefer a country more like the US (with lower tax and less expansive welfare and public services than the UK) or more like Denmark (much higher tax, much more generous welfare and more expansive public services) is a political question that no chart can assist with.
Many thanks to P for help with the coding, and to the OECD – both for creating the data and making it so easily accessible to the public. It’s a triumph of open data.
The code that created the interactive charts is available here.
Footnotes
See this Survation polling from November 2023, Table_Q4. Considering the levels of various taxes such as Income Tax, Council Tax, Value Added Tax (VAT), National Insurance, Excise duties and others, do you believe you are currently ‘Paying too much tax’ (52%), ‘Paying about the right amount of tax’ (27%), ‘Paying too little tax’ (8%), ‘Don’t know’ (13%). ↩︎
Polling from the Mile End Institute at Queen Mary University of London found that 54% of Londoners thought they were over-taxed. ↩︎
Because the evidence is that, in the long run, the economic burden of employer national insurance/social security falls on employees in the form of lower wages. ↩︎
Many tax systems provide a more favourable result for families. In some countries there are cash benefits for people on average income with children (like child benefit in the UK). In other countries (like France) there’s a tax credit for people with children. In others (like the US) there’s a child tax credit that is refundable in cash for taxpayers on low income. The tax wedge calculation takes all credits and cash benefits/transfers into account. ↩︎
where one earner is on the average wage and the other on two-thirds of the average wage ↩︎
That’s because of the Family 800+ cash non-taxable benefit (which alone is worth about 20% of the median Polish gross wage), the refundable child tax credit (which can eliminate most income tax for low and moderate earners), and a series of other smaller cash benefits. ↩︎
In part because German marginal income tax rates fall considerably once wages hit the Beitragsbemessungsgrenze (the contributions ceiling) ↩︎
The early data points are a little sparse, but the big moments are Nigel Lawson’s 1988 cut of the basic rate to 25%, and the use of fiscal drag in the 2000s by Gordon Brown to significantly increase tax and increase funding on public services – part of that involved freezing the personal allowance, and therefore increasing the tax wedge. ↩︎
The basic rate of income tax was 45% in the 1940s and the personal allowance was (in today’s money) about £6,000. The rate wobbled around the high 30s and low 40s through to 1972, when Anthony Barber’s first Budget he unified income tax and introduced a 30% basic rate. It then went up to 35% under the Labour Government. The personal allowance was eroded in the 1990s, went up significantly from 2010 to 2020, and has since been eroded by inflation, but remains higher than at any time before 2008. The Family Allowance and (later) child benefit are broadly comparable to today’s figures in real terms. ↩︎
The first version of this article said “next week”. That was woefully optimistic. The answers are not at all obvious. ↩︎
Imagine a country where there is zero tax until you earn £50,000 and then 50% tax after that. If I earn £50,000 my tax wedge is zero; my marginal tax rate is 50%. ↩︎
For the earlier years of the OECD Taxing Wages series, this was the “Average Production Worker” (APW), which was focused on full-time manual workers in the manufacturing sector. This later evolved into the broader “Average Worker” (AW) definition. See Annex A, page 652 here. This is one of the reasons why pre-1979 datasets can’t be compared with later datasets. ↩︎

The Scottish Budget – four thoughts on a tiny tax cut
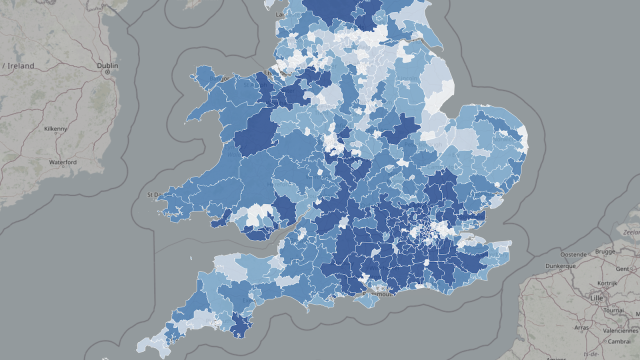
The mansion tax map: where the money comes from
The Budget 2025 tax calculator
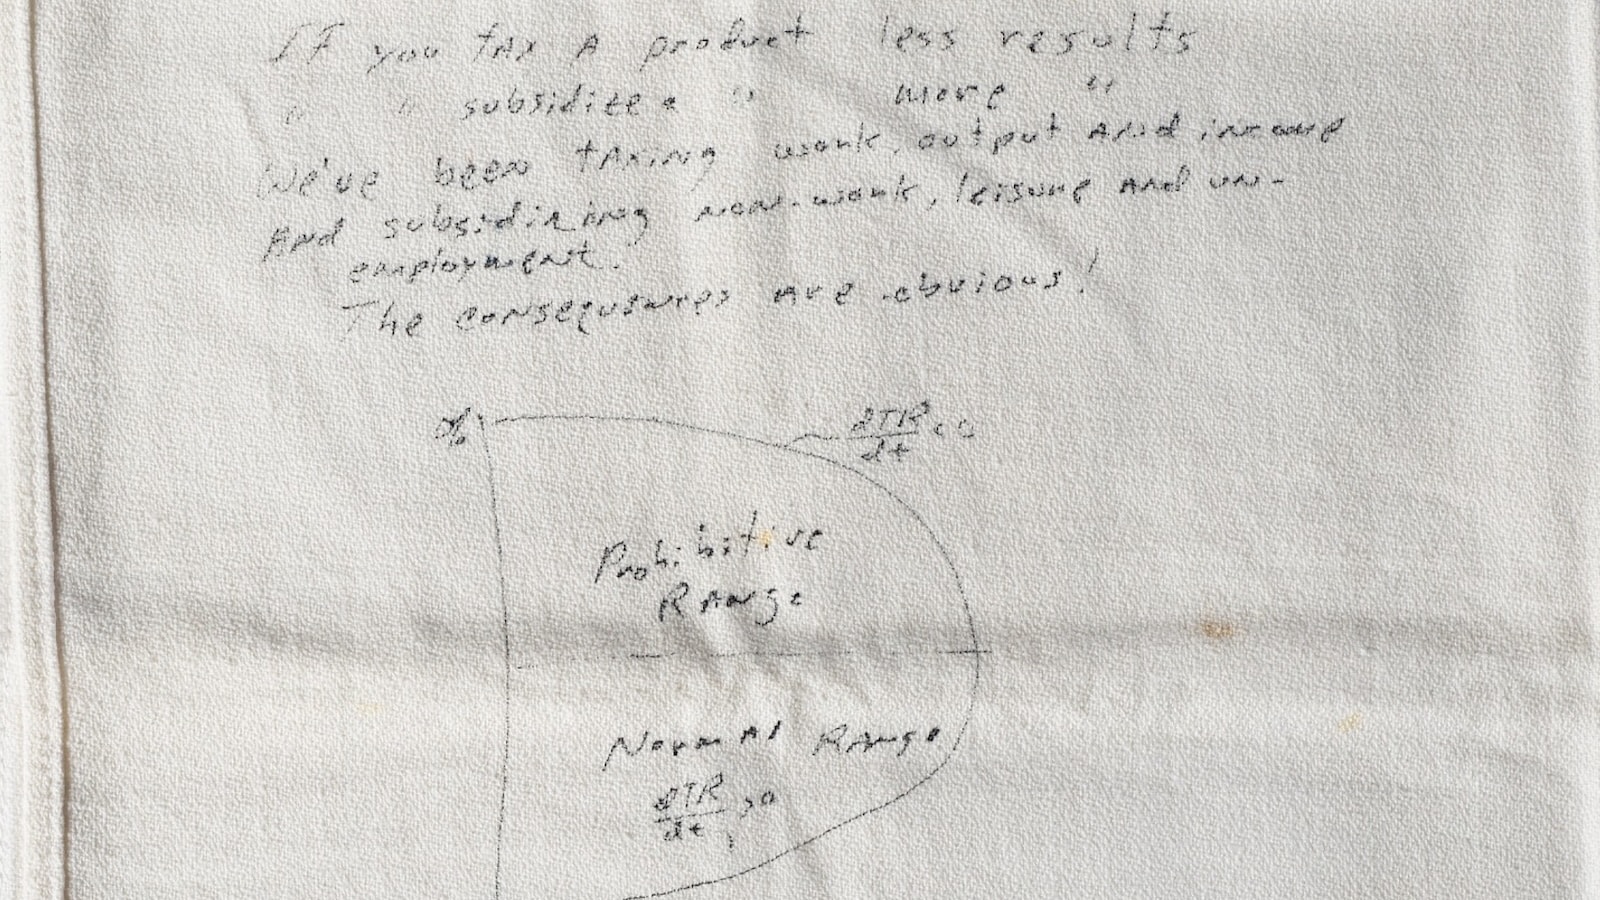
Untaxing – The Laffer curve, and the napkin that changed the world
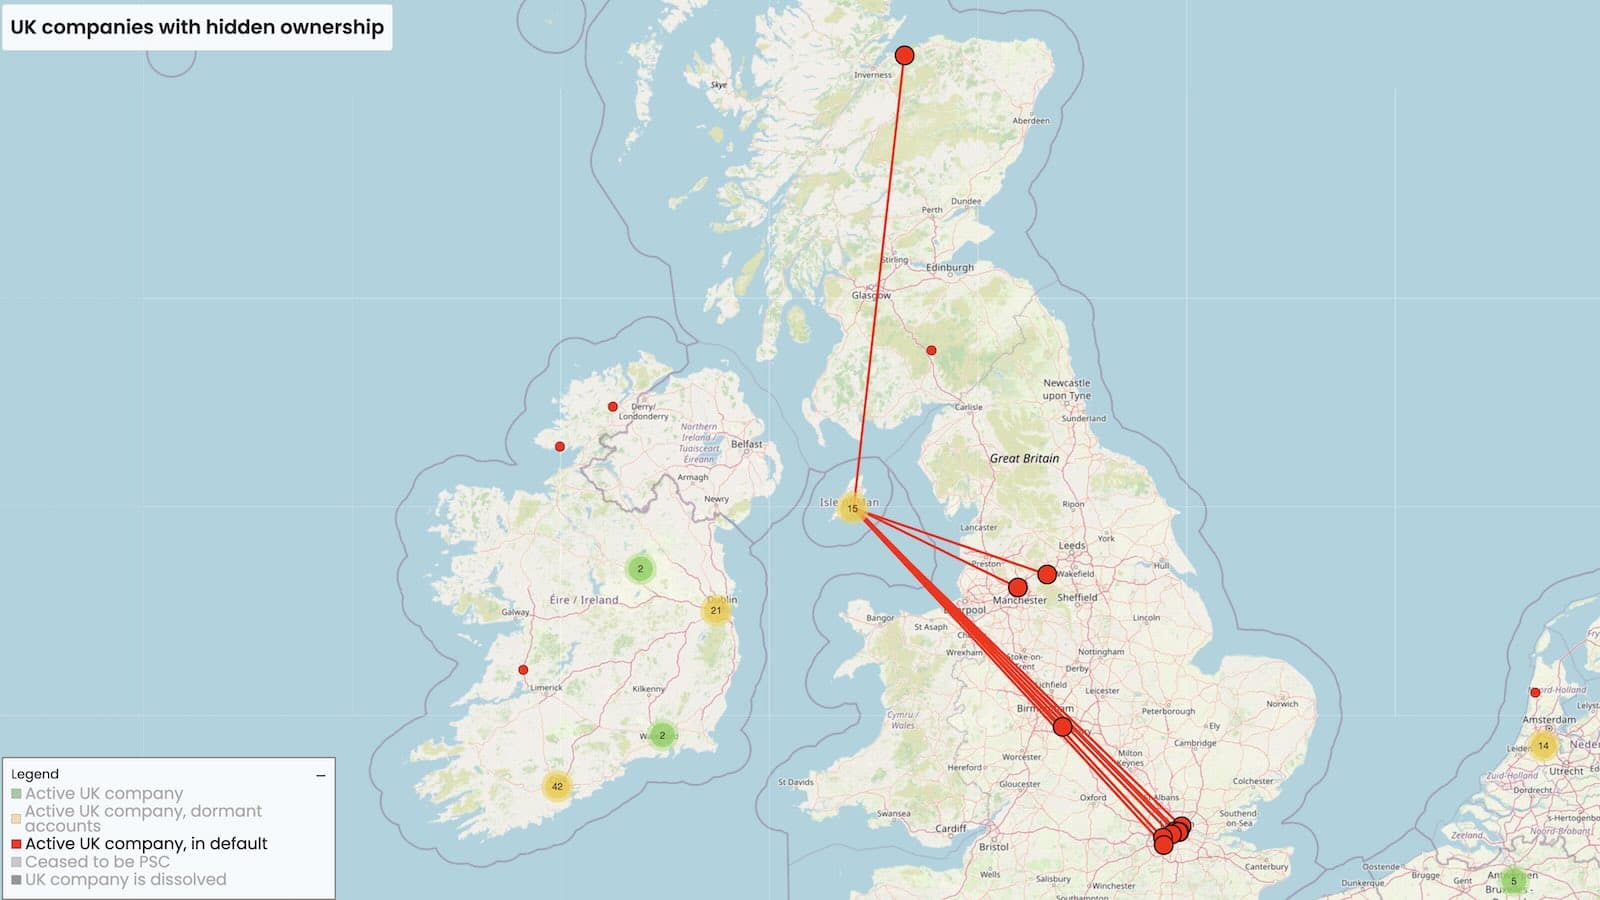
50,000 UK companies are unlawfully hiding their true owners

Leave a Reply